スーパートレンド追跡戦略
作成日:
2023-12-26 15:58:55
最終変更日:
2023-12-26 15:58:55
コピー:
1
クリック数:
729
1
フォロー
1750
フォロワー
概要
この戦略は,追跡型の超トレンド戦略であり,主な考えは,異なるパラメータの設定を組み合わせた超トレンド指標を組み合わせて追跡効果を実現し,フィルター指標を利用してリスク管理を行うことである.戦略の核心思想は,シンプルで実用的で,容易に理解し,初心者向けに適したものである.
戦略原則
この戦略は,主に3組の異なるパラメータ設定のスーパートレンド指標で構成されています. 第一組の主なスーパートレンド指標は,市場トレンドの方向を基本的に判断するためにデフォルトパラメータを採用します. 第二組副スーパートレンド指標は,ATRサイクルを減らしATR倍数を拡大することによって,価格変化をより敏感に追跡できます. 第三組のフィルタースーパートレンド指標は,偽の突破をフィルターするためにATRサイクルとATR倍数を適切に拡大します.
メインスーパートレンドが買入シグナルを発信するとき,副スーパートレンドも同時に信号を発信し,フィルタースーパートレンドの方向が上昇している場合,戦略は追跡買いを取ります. メインスーパートレンドが販売シグナルを発信するとき,副スーパートレンドも同時に信号を発信し,フィルタースーパートレンドの方向が低下している場合,戦略は追跡販売を取ります.
戦略的優位性
- 戦略はシンプルでわかりやすく,初心者向けです.
- 戦略パラメータの設定は合理的で,動きを効果的に追跡し,リスクを制御します.
- 戦略信号はより正確で信頼性があり,勝利率は高い.
- 異なるパラメータの組み合わせで追跡効果を実現する
- フィルターメカニズムが追加され,誤報信号を効果的にフィルターし,リスクを制御する.
戦略リスク
- 株式そのもののシステムリスク
- 超トレンド指数は,一部の市場において遅れをとる可能性があります.
- ATR指標でパラメータが正しく設定されていない場合,戦略信号の偏差が発生する可能性があります
- 戦略的な取引量不足により,全ポジションをクリアすることが困難になる可能性がある.
主なリスク対策:
- 流動性があり 変動が大きい株を選びましょう
- 適切な最適化パラメータで,遅滞の可能性を減らす
- パラメータテストの最適化,信号の精度向上
- 適切な取引量を増やして,ストップ・ローズを確保する
戦略最適化の方向性
- 異なるATR周期パラメータの組み合わせをテストし,追跡効果を最適化
- ATRの代わりに他のボラティリティ指標を試してみましょう.
- 超トレンドの組み合わせの数を増加または減少させ,テスト効果
- 信号フィルタリングを他の指標と組み合わせて最適化します.
- リスクの低減を試みる
要約する
この戦略の概要は明確でシンプルで,異なるパラメータ設定による複数のスーパートレンド指標が相互に協働し,入場追跡とリスク制御を実現する.戦略の信号は精度があり,実盤でのパフォーマンスは良好で,初心者の学習に適しており,また,テンプレートとして様々な指標とパラメータのテスト最適化を行うことができる.これは推奨されるスーパートレンド戦略である.
ストラテジーソースコード
/*backtest
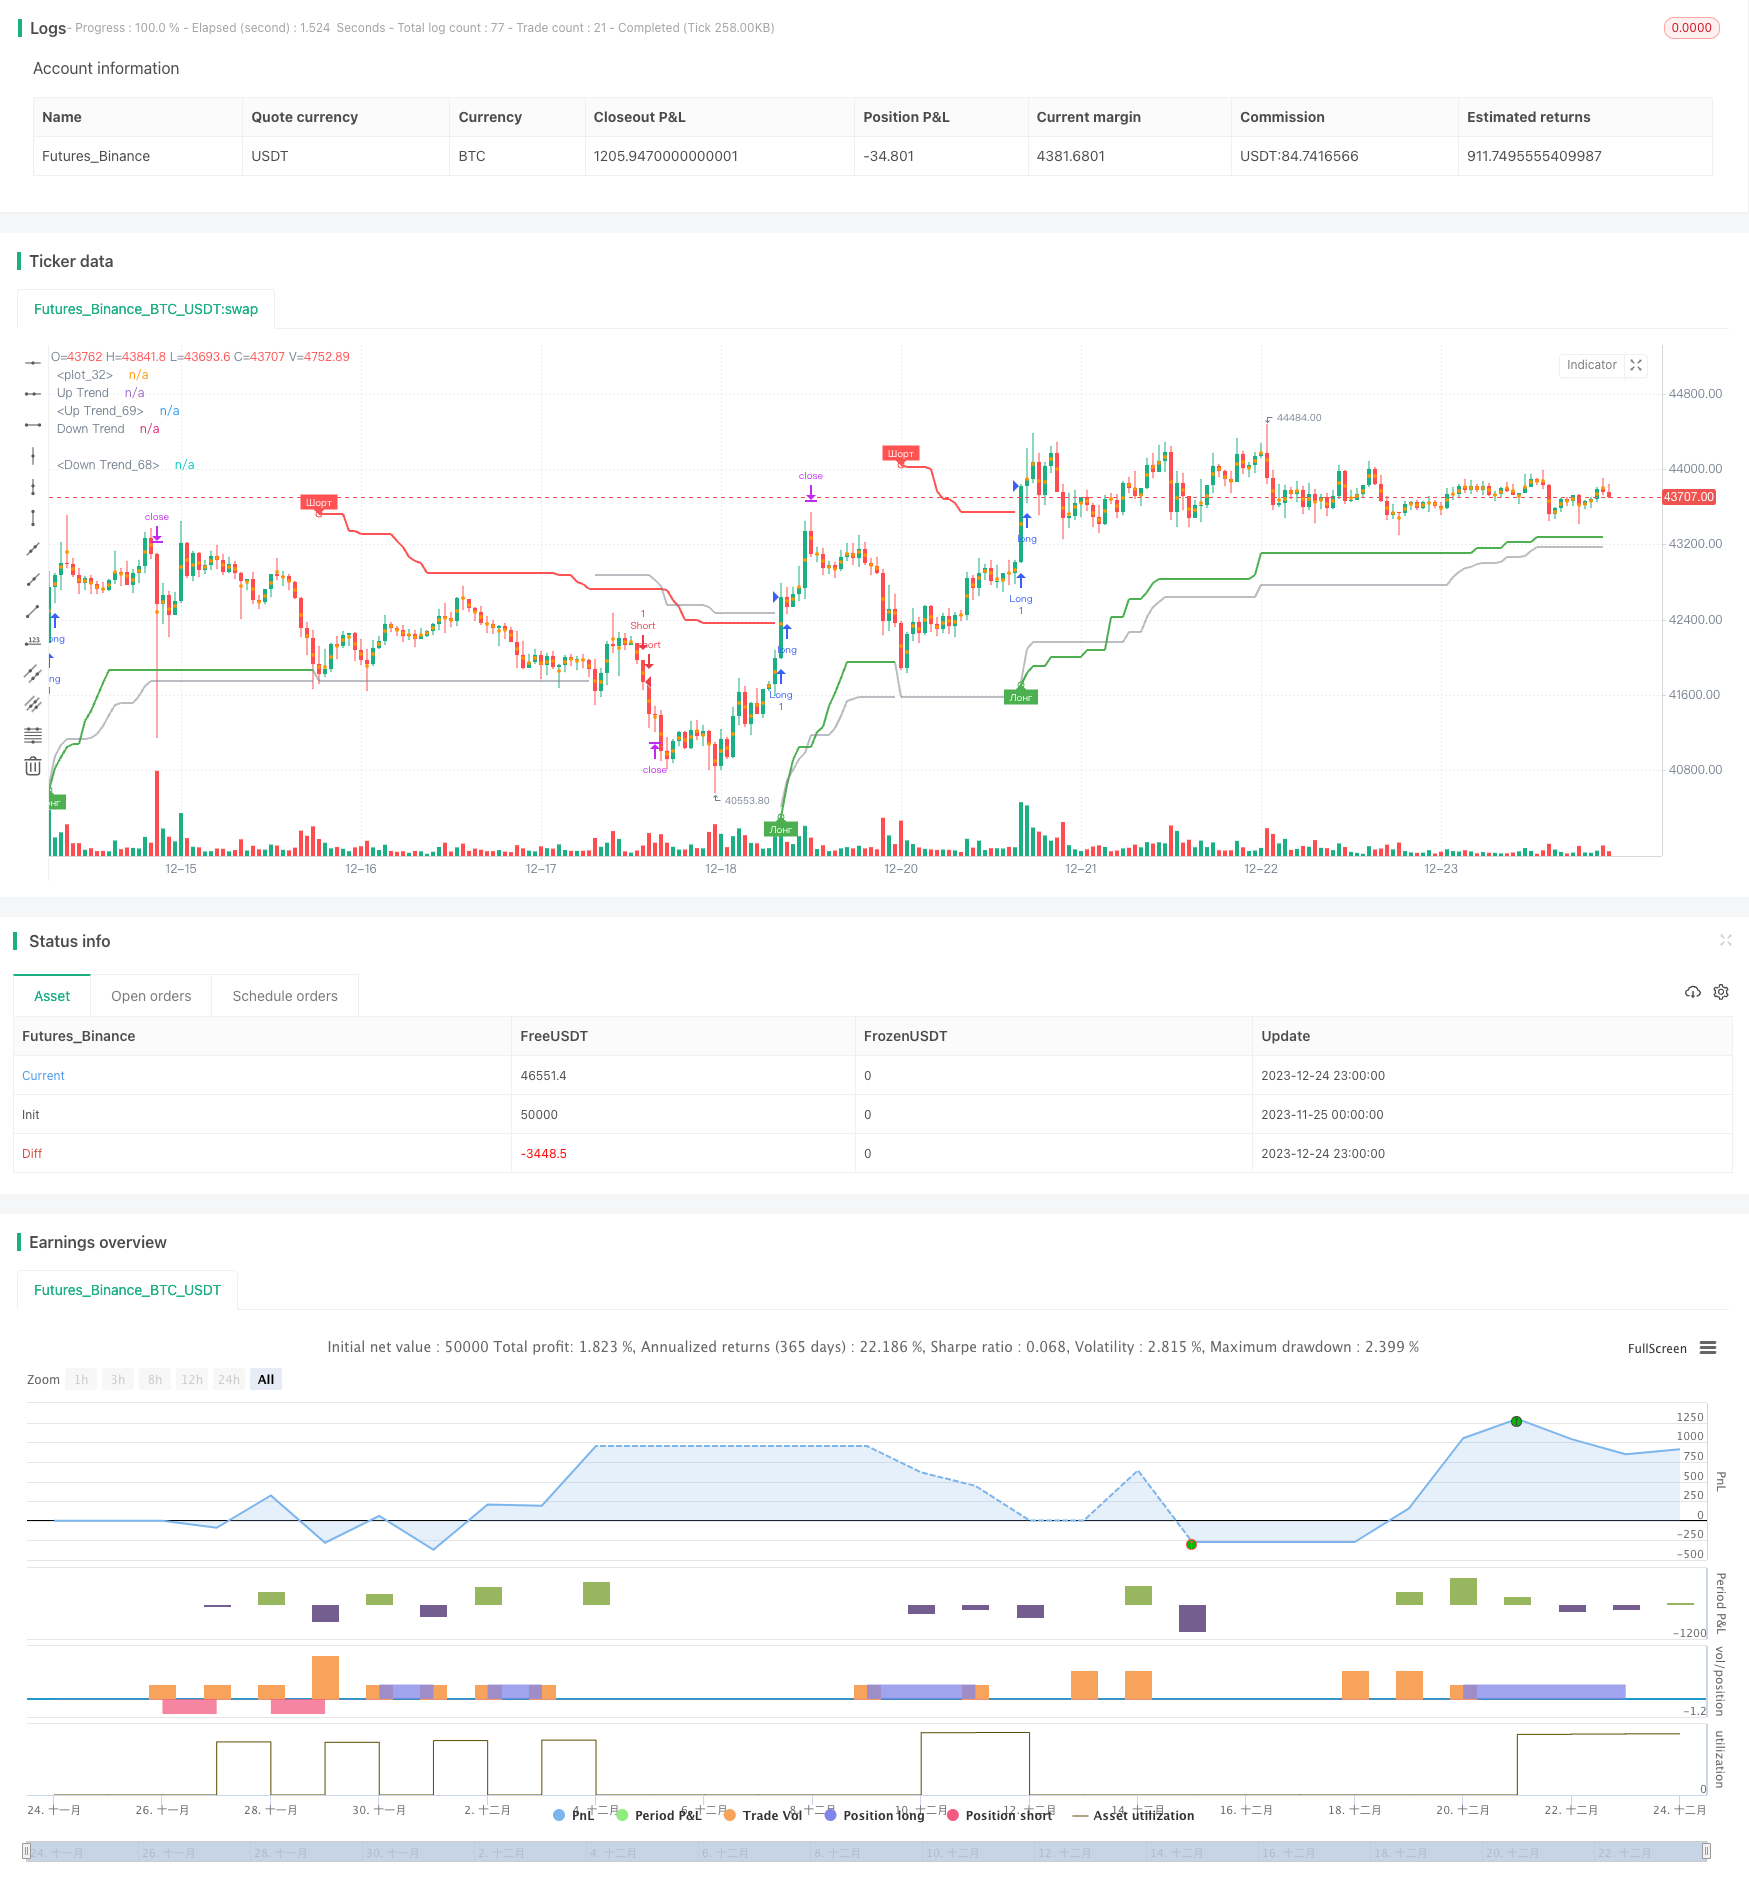
start: 2023-11-25 00:00:00
end: 2023-12-25 00:00:00
period: 1h
basePeriod: 15m
exchanges: [{"eid":"Futures_Binance","currency":"BTC_USDT"}]
*/
//@version=4
strategy("Supertrend TEST 2 Strategy", overlay = true, format=format.price, precision=2)
Periods = input(title="ATR Period", type=input.integer, defval=4)
src = input(hl2, title="Source")
Multiplier = input(title="ATR Multiplier", type=input.float, step=0.1, defval=4.7)
changeATR= input(title="Change ATR Calculation Method ?", type=input.bool, defval=true)
showsignals = input(title="Show Buy/Sell Signals ?", type=input.bool, defval=true)
highlighting = input(title="Highlighter On/Off ?", type=input.bool, defval=true)
tp=close
sl=close
atr2 = sma(tr, Periods)
atr= changeATR ? atr(Periods) : atr2
up=src-(Multiplier*atr)
up1 = nz(up[1],up)
up := close[1] > up1 ? max(up,up1) : up
dn=src+(Multiplier*atr)
dn1 = nz(dn[1], dn)
dn := close[1] < dn1 ? min(dn, dn1) : dn
trend = 1
trend := nz(trend[1], trend)
trend := trend == -1 and close > dn1 ? 1 : trend == 1 and close < up1 ? -1 : trend
upPlot = plot(trend == 1 ? up : na, title="Up Trend", style=plot.style_linebr, linewidth=2, color=color.green)
buySignal = trend == 1 and trend[1] == -1
plotshape(buySignal ? up : na, title="UpTrend Begins", location=location.absolute, style=shape.circle, size=size.tiny, color=color.green )
plotshape(buySignal and showsignals ? up : na, title="Лонг", text="Лонг", location=location.absolute, style=shape.labelup, size=size.tiny, color=color.green, textcolor=color.white )
dnPlot = plot(trend == 1 ? na : dn, title="Down Trend", style=plot.style_linebr, linewidth=2, color=color.red)
sellSignal = trend == -1 and trend[1] == 1
plotshape(sellSignal ? dn : na, title="DownTrend Begins", location=location.absolute, style=shape.circle, size=size.tiny, color=color.red )
plotshape(sellSignal and showsignals ? dn : na, title="Шорт", text="Шорт", location=location.absolute, style=shape.labeldown, size=size.tiny, color=color.red, textcolor=color.white )
mPlot = plot(ohlc4, title="", style=plot.style_circles, linewidth=0)
longFillColor = highlighting ? (trend == 1 ? color.green : color.white) : color.white
shortFillColor = highlighting ? (trend == -1 ? color.red : color.white) : color.white
sPeriods=input(title="ATR Period", type=input.integer, defval=8)
sMultiplier=input(title="dop ATR Multiplier", type=input.float, step=0.1, defval=1.5)
satr2 = sma(tr, sPeriods)
satr= changeATR ? atr(sPeriods) : satr2
ssup=ohlc4-(sMultiplier*satr)
ssup1 = nz(ssup[1],ssup)
ssup := close[1] > ssup1 ? max(ssup,ssup1) : ssup
sdn=ohlc4+(sMultiplier*satr)
sdn1 = nz(sdn[1], sdn)
sdn := close[1] < sdn1 ? min(sdn, sdn1) : sdn
strend = 1
strend := nz(strend[1], strend)
strend := strend == -1 and close > sdn1 ? 1 : strend == 1 and close < ssup1 ? -1 : strend
sbuySignal = strend == 1 and strend[1] == -1
ssellSignal = strend == -1 and strend[1] == 1
fPeriods=input(title="ATR Period", type=input.integer, defval=10)
fMultiplier=input(title="filter ATR Multiplier", type=input.float, step=0.1, defval=5)
fatr2 = sma(tr, fPeriods)
fatr= changeATR ? atr(fPeriods) : fatr2
fup=ohlc4-(fMultiplier*fatr)
fup1 = nz(fup[1],fup)
fup := close[1] > fup1 ? max(fup,fup1) : fup
fdn=ohlc4+(fMultiplier*fatr)
fdn1 = nz(fdn[1], fdn)
fdn := close[1] < fdn1 ? min(fdn, fdn1) : fdn
ftrend = 1
ftrend := nz(ftrend[1], ftrend)
ftrend := ftrend == -1 and close > fdn1 ? 1 : ftrend == 1 and close < fup1 ? -1 : ftrend
fbuySignal = ftrend == 1 and ftrend[1] == -1
fsellSignal = ftrend == -1 and ftrend[1] == 1
tcolor=color.new(color.gray,50)
fdnPlot = plot(ftrend == 1 ? na : fdn, title="Down Trend", style=plot.style_linebr, linewidth=2, color=tcolor)
fupPlot = plot(ftrend == 1 ? fup : na, title="Up Trend", style=plot.style_linebr, linewidth=2, color=tcolor)
if (strategy.position_size > 0)
tp:=tp[1]
sl:=up
strategy.exit("Long_TP/SL","Long",limit=tp, stop=sl)
if (strategy.position_size < 0)
tp:=tp[1]
sl:=dn
strategy.exit("Short_TP/SL","Short",limit=tp, stop=sl)
if ((buySignal and ftrend==1) or (sbuySignal and trend==1 and ftrend==1))
tp:=close+(close-up)*0.382
strategy.entry("Long", strategy.long, limit=tp, comment=tostring(round(tp)))
if ((sellSignal and ftrend==-1) or (ssellSignal and trend==-1 and ftrend==-1))
tp:=close-(dn-close)*0.382
strategy.entry("Short", strategy.short, limit=tp, comment=tostring(round(tp)))