双方向RSIブレイクアウト戦略の使用
作成日:
2023-12-27 14:33:15
最終変更日:
2023-12-27 14:33:15
コピー:
0
クリック数:
1129
1
フォロー
1750
フォロワー
概要
双方向RSI突破戦略は,RSI指標を使用して価格の逆転点を識別するアルゴリズム取引戦略である.これは,RSI指標を設定された上下下下値と比較して,市場が超買超売りしているかどうかを判断し,取引シグナルを発信する.
戦略原則
この戦略は,主にRSI指数による判断である. RSI指数は,特定の周期内の閉盘価格の変化に基づいて計算され,それは株式の買取力を反映する. RSI上での設定された上値 (デフォルト75) を突破すると,株式が超買い領域に入ることを示す.
戦略的な判断のルール:
- RSIが値に達すると空白する.
- RSIが下位に突破する時には,もっと努力する.
- ストップ・ローズまたはストップ・ストップ後の平仓.
取引ロジックはシンプルで明快で,参照パラメータは合理的に設定され,配置スペースが広く,市場における大きなトレンドを捕捉するのに適しています.
優位分析
この戦略の利点は以下の通りです.
- 論理がシンプルで,理解し,実行しやすい.
- 参照パラメータは合理的に設定され,個別化できます.
- 逆転取引ロジックを構成し,柔軟に対応します.
- 価格の逆転点を効果的に識別し,大きなトレンドを捉える.
総じて,この戦略の参照パラメータは合理的に設定され,実行が簡単で,RSI指標によって価格逆転を効果的に判断でき,中長線で市場の大きなトレンドを捕捉するのに適しており,使いやすい量化戦略である.
リスク分析
この戦略は単純で信頼性があるものの,潜在的なリスクも無視できない:
- RSI指標は誤った信号を発する可能性が高い. RSIは価格の逆転を完璧に予測することはできません.誤判が発生する可能性があります.
- トレンド行情の中で連続した破損の可能性. RSI指標は,通常の範囲の調整とトレンドの逆転を区別するのが難しい.
- 震動の状況では損失が大きい。RSI指標は震動の動向を効果的に判断できない,この環境では戦略の損失が増加する。
危険を抑えるために,注意すべき点は以下の通りです.
- 誤判率を高すぎないようにパラメータを適切に調整する.
- 他の指標と組み合わせた取引信号の正確性を向上させる.
- ストップレスを増やし,単発ストップを減らす.
- 金融危機の危機を避けるために注意してください
最適化の方向
この戦略は,主に反転誤判と震動状況での損失のリスクを考慮して,以下のような点で最適化することができます.
- 他の指標と組み合わせて信号フィルタリングを行う.例えば,KDJ,MACDなどの指標は,誤判を避けるためにフィルタリング作用を行う.
- 条件の単一ストップ額を増加させる. 単一ストップスペースを適切に拡大することで,戦略が大きなトレンドと動作するのに役立ちます.
- ポジション開設頻度制限を設定します. 周期ごとに1回またはN回しか取引しない論理的値を追加し,過密なポジション開設を制御できます.
- 状況判断を設定する.判断策は,トレンドの状況下でのみ動作し,震動の状況を回避し,戦略の利益リスク比率を大幅に最適化することができる.
要約する
双方向RSI突破策は,全体的に見ると,シンプルで実用的な量化策である.それは,RSI指標によって価格反転を判断し,簡単なトレンド追跡を実現している.ある程度の誤判リスクがあるにもかかわらず,パラメータ調整と信号フィルタリングによって最適化され,中長線トレンドを捕獲する上で重要な役割を果たしている.その論理は簡潔で,量化取引の初心者の参考学習に適している.この戦略は,最適化によって,比較的安定した量化利益を得ることを期待できる.
ストラテジーソースコード
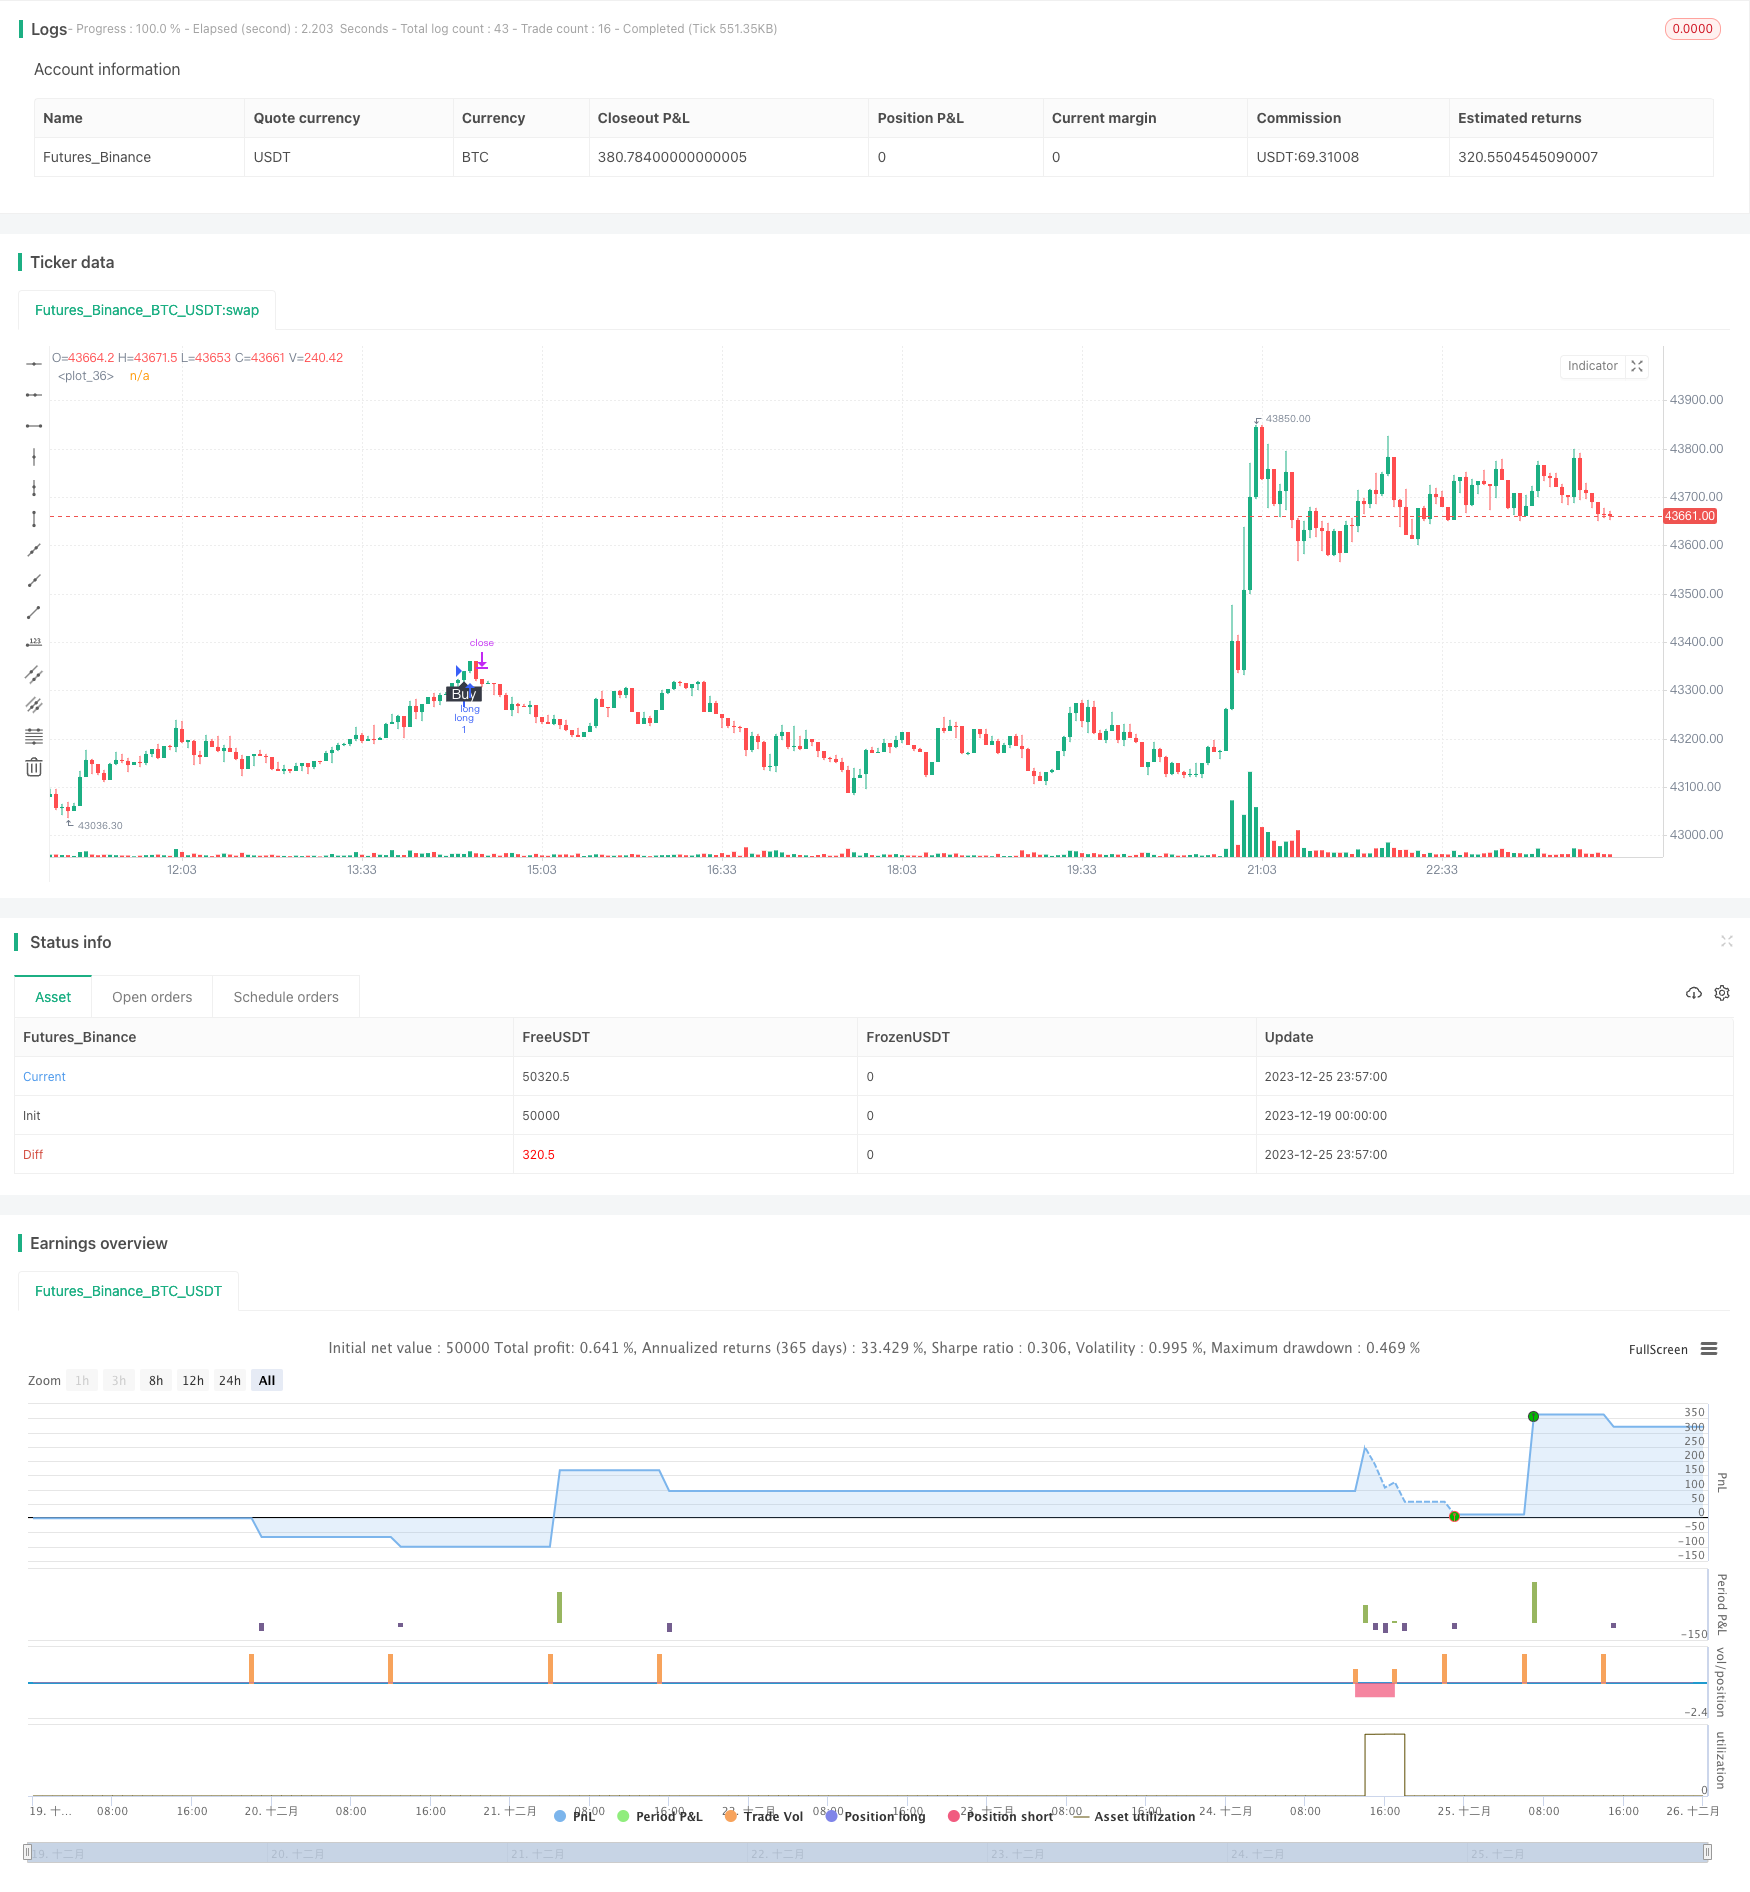
/*backtest
start: 2023-12-19 00:00:00
end: 2023-12-26 00:00:00
period: 3m
basePeriod: 1m
exchanges: [{"eid":"Futures_Binance","currency":"BTC_USDT"}]
*/

//@version=4
strategy("RSI Algo", overlay=true)

// Calculate start/end date and time condition
DST = 1 //day light saving for usa
//--- Europe
London = iff(DST==0,"0000-0900","0100-1000")
//--- America
NewYork = iff(DST==0,"0400-1500","0500-1600")
//--- Pacific
Sydney = iff(DST==0,"1300-2200","1400-2300")
//--- Asia
Tokyo = iff(DST==0,"1500-2400","1600-0100")

//-- Time In Range
timeinrange(res, sess) => time(res, sess) != 0

london = timeinrange(timeframe.period, London)
newyork = timeinrange(timeframe.period, NewYork)

time_cond = true


myPeriod = input(defval=14, type=input.integer, title="Period")
myThresholdUp = input(defval=75, type=input.float, title="Upper Threshold")
myThresholdDn = input(defval=25, type=input.float, title="Lower Threshold")
myAlgoFlipToggle = input(defval=false, type=input.bool, title="Imverse Algorthim")
myLineToggle = input(defval=true, type=input.bool, title="Show Lines")
myLabelToggle = input(defval=true, type=input.bool, title="Show Labels")
myRSI=rsi(close, myPeriod)
buy = myAlgoFlipToggle ? falling(myRSI,1) and cross(myRSI, myThresholdDn) : rising(myRSI, 1) and cross(myRSI,myThresholdUp) //and time_cond
sell = myAlgoFlipToggle ? rising(myRSI, 1) and cross(myRSI,myThresholdUp) : falling(myRSI,1) and cross(myRSI, myThresholdDn) //and time_cond
myPosition = 0
myPosition := buy==1 ? 0 : sell==1 or myPosition[1]==1 ? 1 : 0
trendColor = buy ? color.red : sell ? color.green : na
plot(myLineToggle ? buy and myPosition[1]==1 ? low - 0.004: sell and myPosition[1]==0 ? high + 0.004 : na : na, color=trendColor, style=plot.style_line, linewidth=4, editable=false)
plotshape(myLabelToggle ? buy and myPosition[1]==1 ? low - 0.005 : na : na, style=shape.labelup, location=location.absolute, text="Buy", transp=0, textcolor = color.white, color=color.black, editable=false)
plotshape(myLabelToggle ? sell and myPosition[1]==0 ? high + 0.005 : na : na, style=shape.labeldown, location=location.absolute, text="Sell", transp=0, textcolor = color.white, color=color.black, editable=false)

strategy.initial_capital = 50000
    //Calculate the size of the next trade
balance = strategy.netprofit + strategy.initial_capital //current balance
floating = strategy.openprofit          //floating profit/loss
risk = input(2,type=input.float,title="Risk %")/100           //risk % per trade
isTwoDigit = input(false,"Is this a 2 digit pair? (JPY, XAU, XPD...")


stop = input(250, title="stop loss pips")
tp = input(2500, title="take profit pips")
if(isTwoDigit)
    stop := stop/100

temp01 = balance * risk     //Risk in USD
temp02 = temp01/stop        //Risk in lots
temp03 = temp02*100000      //Convert to contracts
size = 1

strategy.entry("long",1,size,when=buy and myPosition[1]==1 )
strategy.entry("short",0,size,when=sell and myPosition[1]==0)

strategy.exit("exit_long","long",loss=stop, profit=tp)      //Long exit (stop loss)
strategy.exit("exit_short","short",loss=stop, profit=tp)      //Short exit (stop loss)

//strategy.close_all(when= not time_cond)