スローRSI買われすぎと売られすぎ戦略
作成日:
2023-12-28 18:07:48
最終変更日:
2023-12-28 18:07:48
コピー:
4
クリック数:
877
1
フォロー
1751
フォロワー
概要
遅いRSIの超買い超売り戦略は,RSIの回転周期を延長し,RSI曲線の波動性を低下させ,新しい取引機会を開きます.この戦略は,MACDなどの他の技術指標にも適用されます.
戦略原則
この戦略の核心的な考え方は,RSIの回顧周期の長さを延長し,500サイクルをデフォルトし,その後SMAを介してRSI曲線を平坦化し,デフォルト周期は250である.これは,RSI曲線の波動性を大幅に減らし,RSIの反応速度を遅くし,新しい取引機会を生成する.
超長期の回転周期はRSI曲線の波動性を弱め,超買い超売りを判断する基準も調整する必要がある.戦略は,超買線52と超売り線48をカスタムに設定している.重圧RSIが下から超売り線を突破すると多信号が作られ,上から超買線を突破すると空売り信号が作られる.
戦略的優位性
- 革新的で,周期を延長することで新しい取引方法を開拓する
- 偽信号を大幅に減らし,安定性を向上させる
- オーバー・バイ・オーバー・セール・値をカスタマイズし,異なる市場に対応
- 貯蔵庫を植え上げ,収益率を上げることができます.
戦略リスク
- 周期が長すぎると ショートラインのチャンスを逃してしまう
- 忍耐強く待たなければいけません
- 超買超売 値設定を間違えた場合 損失が増加する
- 利回りのリスク
解決策は
- 適切なサイクルを短縮し,取引の頻度を増やす
- 貯蔵庫を分批に建設し,リスクを分散する
- 市場環境に適応する値下げパラメータの最適化
- ストップポイントを設定し,大きな損失を回避する
戦略最適化の方向性
- RSIのパラメータを最適化して,最適な周期組み合わせを見つける
- SMA平滑周期のパラメータをテストする
- 超買超売のパラメータを最適化して,異なる市場に対応する
- 単一損失をコントロールするストップ・ロース戦略
要約する
ゆっくりとしたRSI超買い超売り戦略は,周期を延長し,均線を抑制する方法で,新しい取引理念を成功的に開拓した.この戦略は,パラメータの最適化とリスクの制御が置かれた場合に,安定した高効率の余分な収益を期待している.全体的に,この戦略は,非常に強い革新性と使用価値を持っている.
ストラテジーソースコード
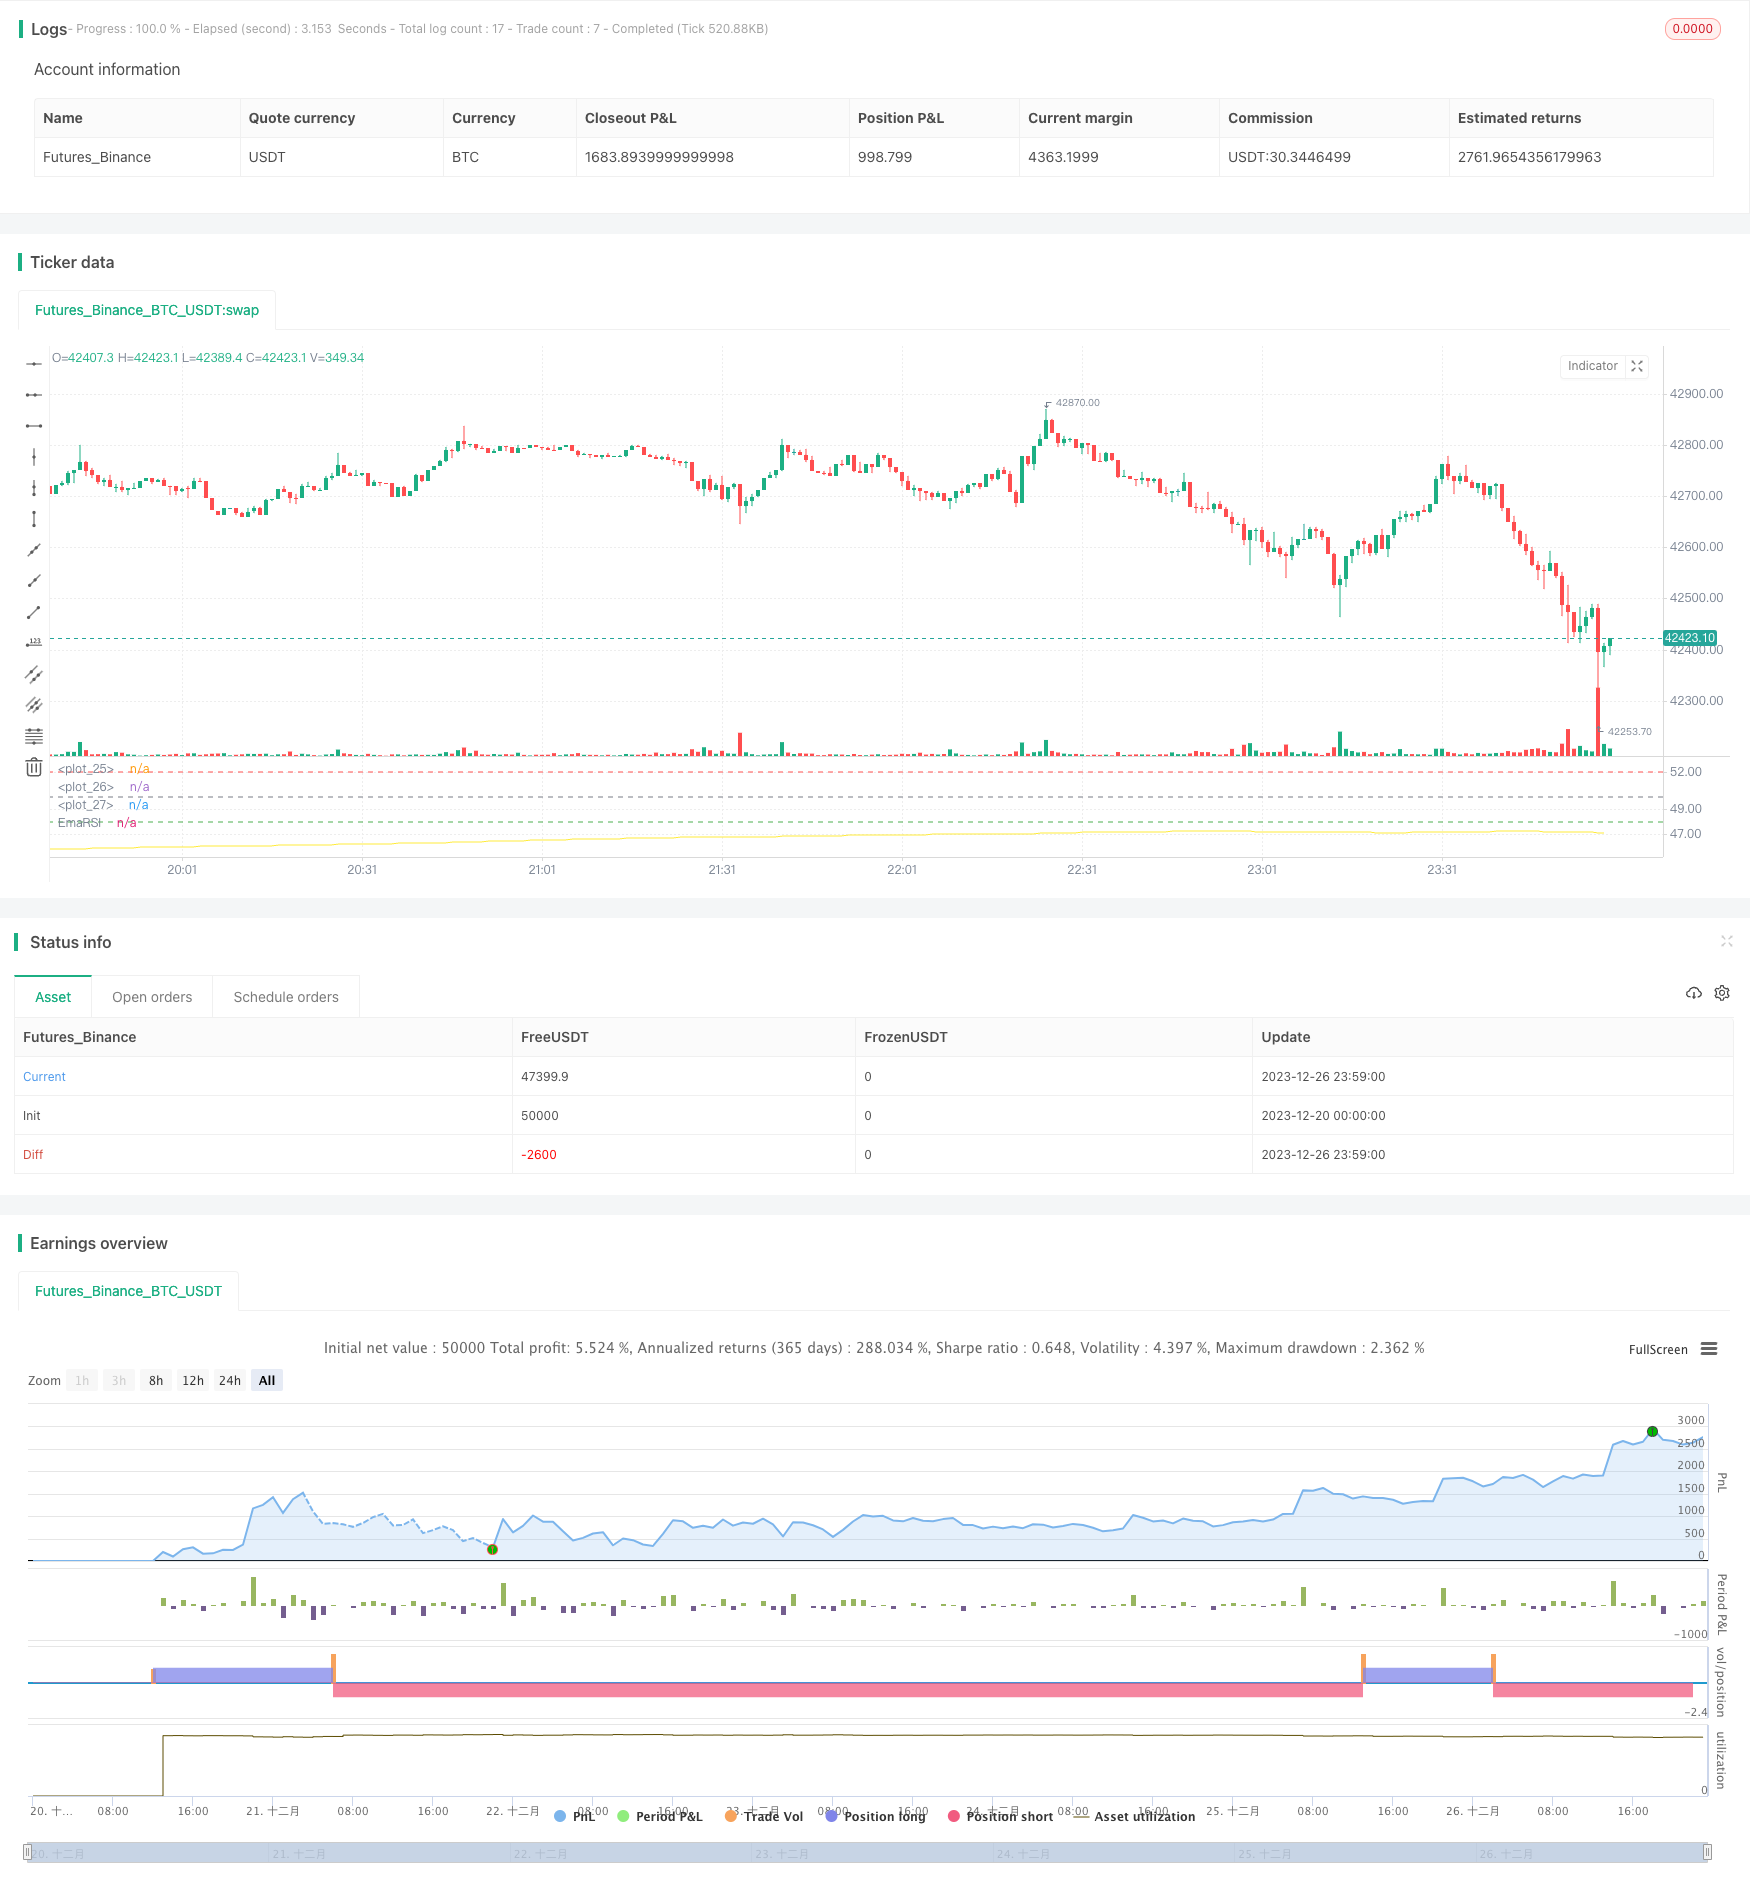
/*backtest
start: 2023-12-20 00:00:00
end: 2023-12-27 00:00:00
period: 1m
basePeriod: 1m
exchanges: [{"eid":"Futures_Binance","currency":"BTC_USDT"}]
*/


// Wilder was a very influential man when it comes to TA. However, I'm one to always try to think outside the box.
// While Wilder recommended that the RSI be used only with a 14 bar lookback period, I on the other hand think there is a lot to learn from RSI if one simply slows down the lookback period
// Same applies for MACD.
// Every market has its dynmaics. So don't narrow your mind by thinking my source code input levels are the only levels that work.
// Since the long lookback period weakens the plot volatility, again, one must think outside the box when trying to guage overbought and oversold levels.

// Good luck and don't bash me if some off-the-wall FA spurned divergence causes you to lose money.
// And NO this doesn't repaint and I won't answer those who ask.
//@version=4

strategy("SLOW RSI OB/OS Strategy", overlay=false)
price = input(ohlc4, title="Price Source")
len = input(500, minval=1, step=5,  title="RSI Length")
smoother = input(250, minval=1, step=5, title="RSI SMA")
up = rma(max(change(price), 0), len)
down = rma(-min(change(price), 0), len)
rsi = down == 0 ? 100 : up == 0 ? 0 : 100 - (100 / (1 + up / down))
EmaRSI = ema(rsi,smoother)
plot(EmaRSI, title="EmaRSI", style=line, linewidth=1, color=yellow)


OB = input(52, step=0.1)
OS = input(48, step=0.1)
hline(OB, linewidth=1, color=red)
hline(OS,linewidth=1, color=green)
hline(50,linewidth=1, color=gray)


long = change(EmaRSI) > 0 and EmaRSI <= 50 and crossover(EmaRSI, OS)
short = change(EmaRSI) < 0 and EmaRSI >= 50 and crossunder(EmaRSI, OB)


strategy.entry("Long", strategy.long, when=long) //_signal or long) //or closeshort_signal)
strategy.entry("Short", strategy.short, when=short) //_signal or short) // or closelong_signal)

// If you want to try to play with exits you can activate these!

//closelong = crossunder(EmaRSI, 0) //or crossunder(EmaRSI, OS)
//closeshort = crossover(EmaRSI, 0) //or crossover(EmaRSI, OB)

//strategy.close("Long", when=closelong)
//strategy.close("Short", when=closeshort)