ダブルEMAゴールデンクロスデスクロストレンド戦略
作成日:
2023-12-29 15:46:15
最終変更日:
2023-12-29 15:46:15
コピー:
2
クリック数:
835
1
フォロー
1750
フォロワー
概要
この戦略は,現在のトレンドの方向を判断するために,双EMA指標の金叉デッドフォークを使用し,RSI指標と組み合わせて,買入機会を逃さないようにする典型的なトレンド追跡戦略です.
戦略原則
- 10期と20期のEMA平均線を計算し,それぞれma00とma01と命名
- 買取信号は,ma00上でma01を打つときに発生します.
- 売る信号は,ma00の下からma01を突破するときに発生します.
- また,価格がma00を超えると,ma00がma01より高い場合,買入シグナルも発生します.
- 価格がma00を下回ると,ma00がma01を下回ると,売り込みシグナルが作られます.
- この二重の判断によって,いくつかの取引を逃すことができます.
- ストップ・ロズとストップ・ストップ・価格を設定し,リスクコントロールを実現する
優位分析
- 偽突破を効率的にフィルタリングするために,双重EMA判断を使用します.
- 双重条件判定 漏れ紙を避ける
- ストップ・ストップの設定は,リスク管理に有利である
リスク分析
- 二重EMA均線戦略は,トレンドフォロー戦略であり,震動の状況で頻繁に買い買いされ,損失を容易にする.
- 市場が逆転する点を正確に判断できず,損失を招く可能性がある.
- ストップポイントの不適切な設定は損失を拡大する可能性があります
最適化の方向
- EMAサイクルを適切に最適化して,最適なパラメータの組み合わせを探します.
- 戦略の安定性を高めるために,他の指標の判断を組み込むことができます.
- ダイナミックなストップを設定し,市場の波動に応じてストップポイントをリアルタイムで調整できます.
ストラテジーソースコード
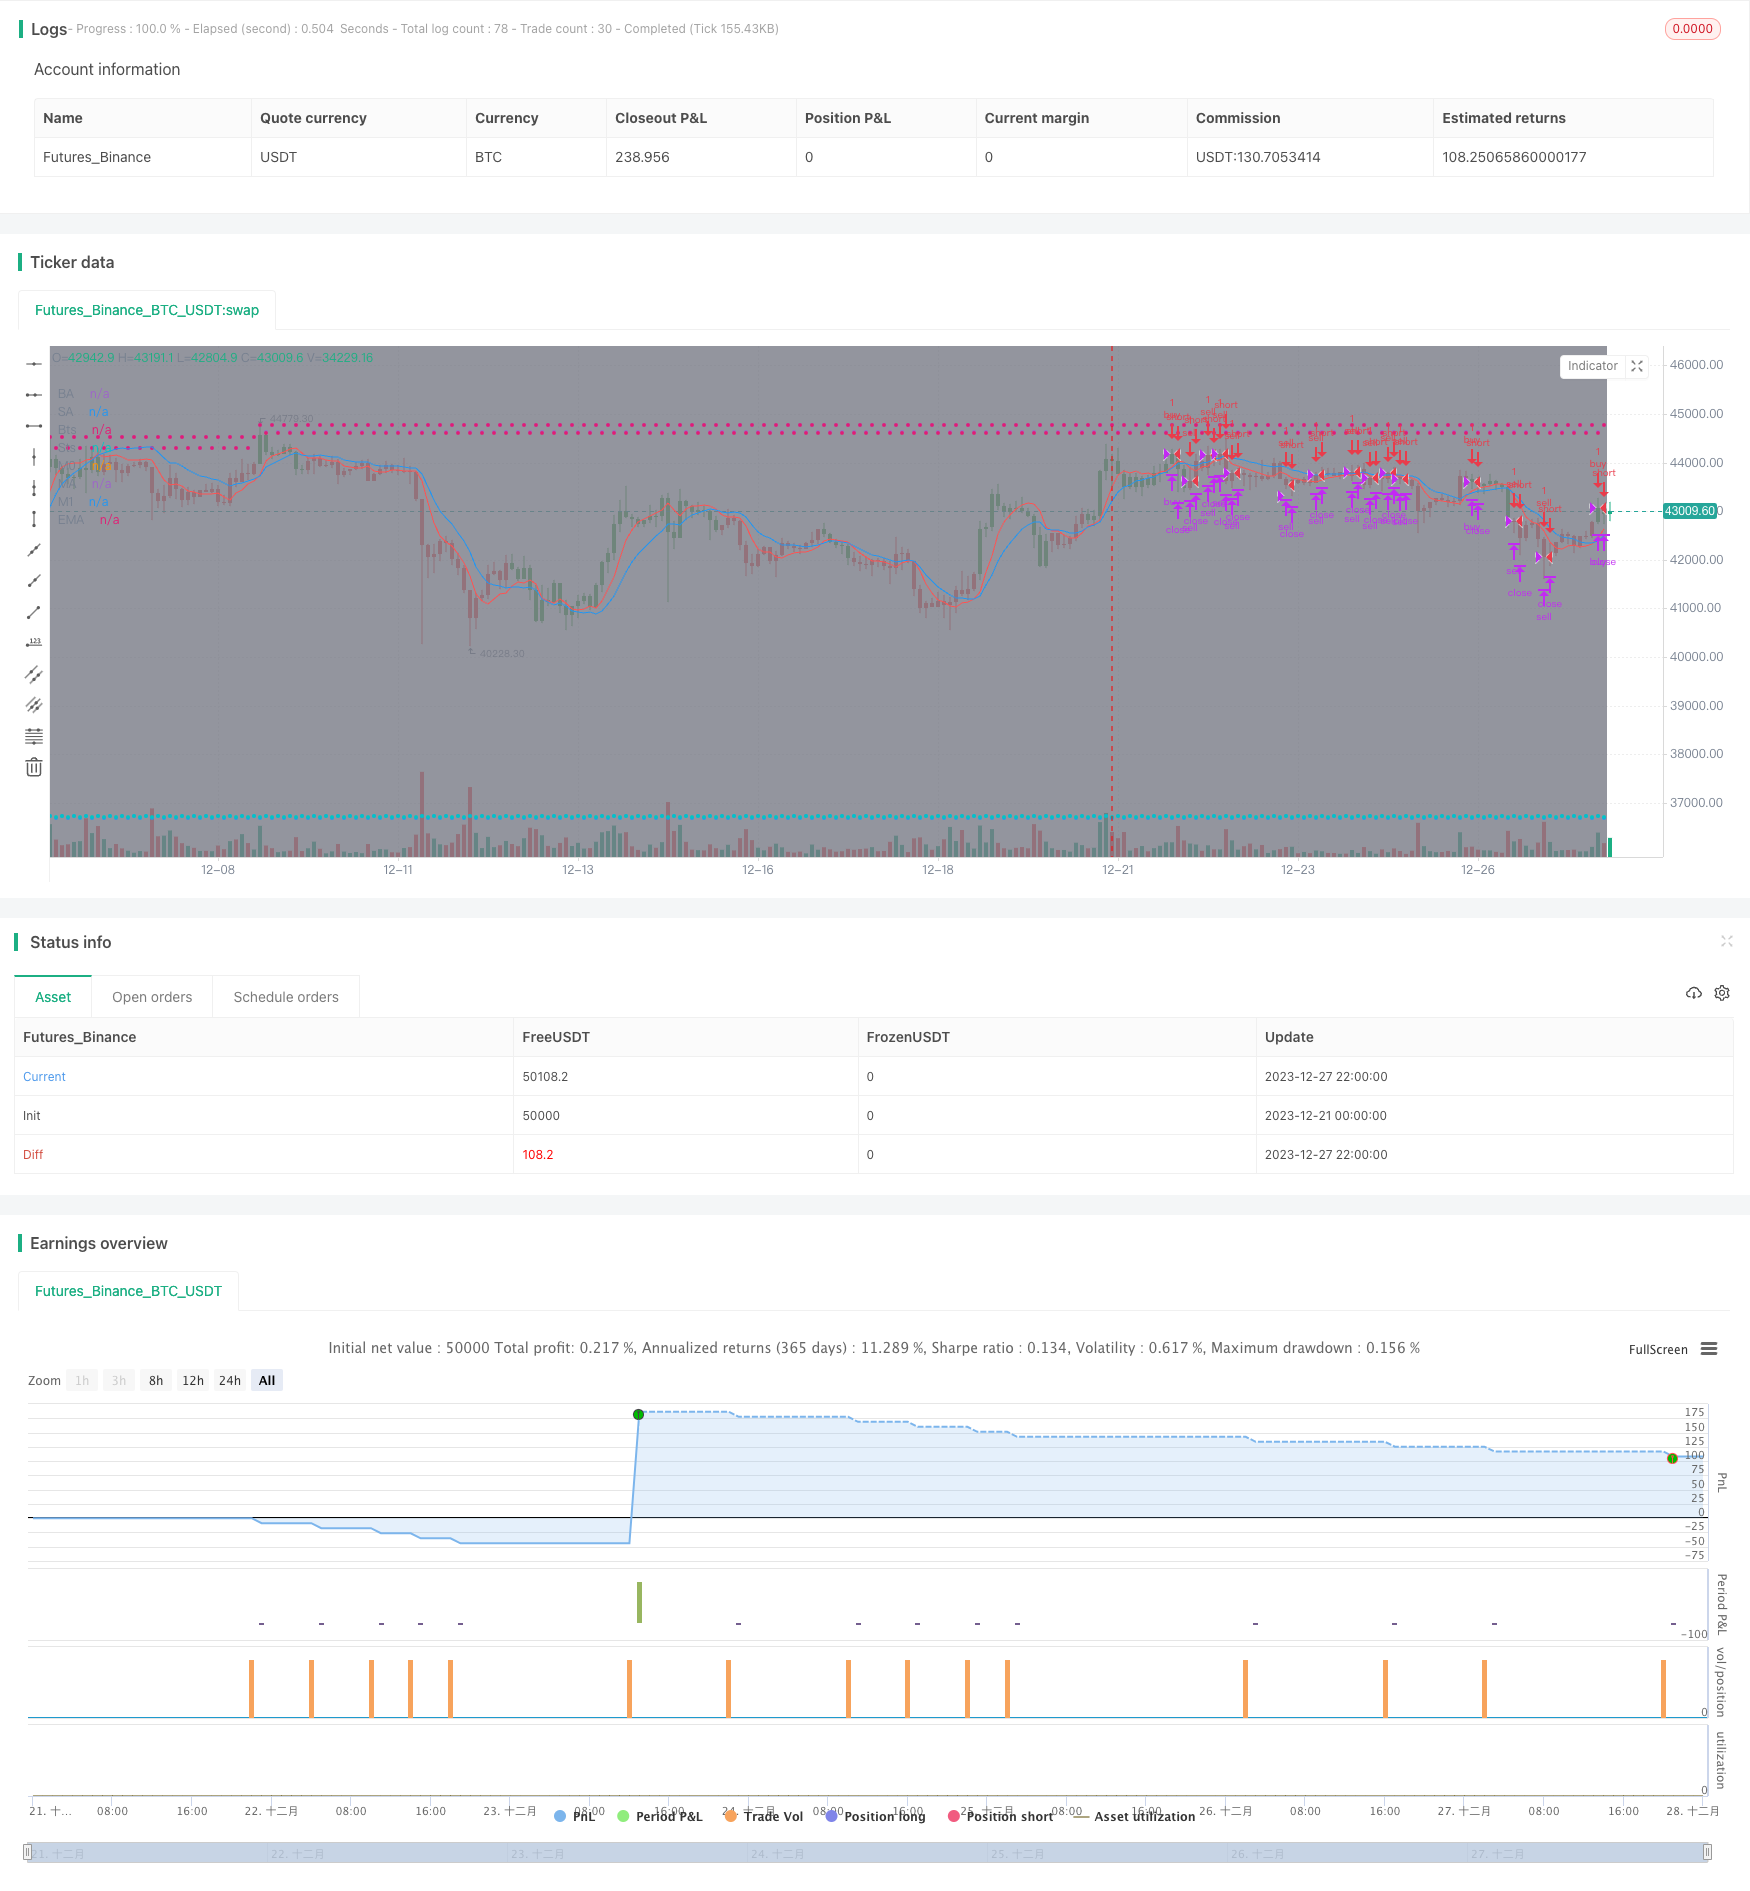
/*backtest
start: 2023-12-21 00:00:00
end: 2023-12-28 00:00:00
period: 2h
basePeriod: 15m
exchanges: [{"eid":"Futures_Binance","currency":"BTC_USDT"}]
*/

//@version=4

strategy(title='[STRATEGY][RS]MicuRobert EMA cross V1', shorttitle='S', overlay=true, pyramiding=0, initial_capital=100000)
USE_TRADESESSION = input(title='Use Trading Session?', type=bool, defval=true)
USE_TRAILINGSTOP = input(title='Use Trailing Stop?', type=bool, defval=true)
trade_session = input(title='Trade Session:',  defval='0400-1500', confirm=false)
istradingsession = not USE_TRADESESSION ? false : not na(time('1', trade_session))
bgcolor(istradingsession?color.gray:na)
trade_size = input(title='Trade Size:', type=float, defval=1)
tp = input(title='Take profit in pips:', type=float, defval=55.0) * (syminfo.mintick*10)
sl = input(title='Stop loss in pips:', type=float, defval=11.0) * (syminfo.mintick*10)
ma_length00 = input(title='EMA length:',  defval=10)
ma_length01 = input(title='DEMA length:',  defval=20)
price = input(title='Price source:', defval=open)

//  ||--- NO LAG EMA, Credit LazyBear:  ---||
f_LB_zlema(_src, _length)=>
    _ema1=ema(_src, _length)
    _ema2=ema(_ema1, _length)
    _d=_ema1-_ema2
    _zlema=_ema1+_d
//  ||-------------------------------------||

ma00 = f_LB_zlema(price, ma_length00)
ma01 = f_LB_zlema(price, ma_length01)
plot(title='M0', series=ma00, color=black)
plot(title='M1', series=ma01, color=black)

isnewbuy = change(strategy.position_size)>0 and change(strategy.opentrades)>0
isnewsel = change(strategy.position_size)<0 and change(strategy.opentrades)>0

buy_entry_price = isnewbuy ? price : buy_entry_price[1]
sel_entry_price = isnewsel ? price : sel_entry_price[1]
plot(title='BE', series=buy_entry_price, style=circles, color=strategy.position_size <= 0 ? na : aqua)
plot(title='SE', series=sel_entry_price, style=circles, color=strategy.position_size >= 0 ? na : aqua)
buy_appex = na(buy_appex[1]) ? price : isnewbuy ? high : high >= buy_appex[1] ? high : buy_appex[1]
sel_appex = na(sel_appex[1]) ? price : isnewsel ? low : low <= sel_appex[1] ? low : sel_appex[1]
plot(title='BA', series=buy_appex, style=circles, color=strategy.position_size <= 0 ? na : teal)
plot(title='SA', series=sel_appex, style=circles, color=strategy.position_size >= 0 ? na : teal)
buy_ts = buy_appex - sl
sel_ts = sel_appex + sl
plot(title='Bts', series=buy_ts, style=circles, color=strategy.position_size <= 0 ? na : red)
plot(title='Sts', series=sel_ts, style=circles, color=strategy.position_size >= 0 ? na : red)

buy_cond1 = crossover(ma00, ma01) and (USE_TRADESESSION ? istradingsession : true)
buy_cond0 = crossover(price, ma00) and ma00 > ma01 and (USE_TRADESESSION ? istradingsession : true)
buy_entry = buy_cond1 or buy_cond0
buy_close = (not USE_TRAILINGSTOP ? false : low <= buy_ts) or high>=buy_entry_price+tp//high>=last_traded_price + tp or low<=last_traded_price - sl //high >= hh or
sel_cond1 = crossunder(ma00, ma01) and (USE_TRADESESSION ? istradingsession : true)
sel_cond0 = crossunder(price, ma00) and ma00 < ma01 and (USE_TRADESESSION ? istradingsession : true)
sel_entry = sel_cond1 or sel_cond0
sel_close = (not USE_TRAILINGSTOP ? false : high >= sel_ts) or low<=sel_entry_price-tp//low<=last_traded_price - tp or high>=last_traded_price + sl //low <= ll or

strategy.entry('buy', long=strategy.long, qty=trade_size, comment='buy', when=buy_entry)
strategy.close('buy', when=buy_close)
strategy.entry('sell', long=strategy.short, qty=trade_size, comment='sell', when=sel_entry)
strategy.close('sell', when=sel_close)

//What i add .!
pos = iff(ma01 < ma00 , 1,
	    iff(ma01 > ma00 , -1, nz(pos[1], 0)))
barcolor(pos == -1 ? red: pos == 1 ? green : blue)
plot(ma00, color=red, title="MA")
plot(ma01, color=blue, title="EMA")