ダイナミックサポートとレジスタンスバックテスト戦略
作成日:
2023-12-29 15:50:57
最終変更日:
2023-12-29 15:50:57
コピー:
1
クリック数:
954
1
フォロー
1750
フォロワー
概要
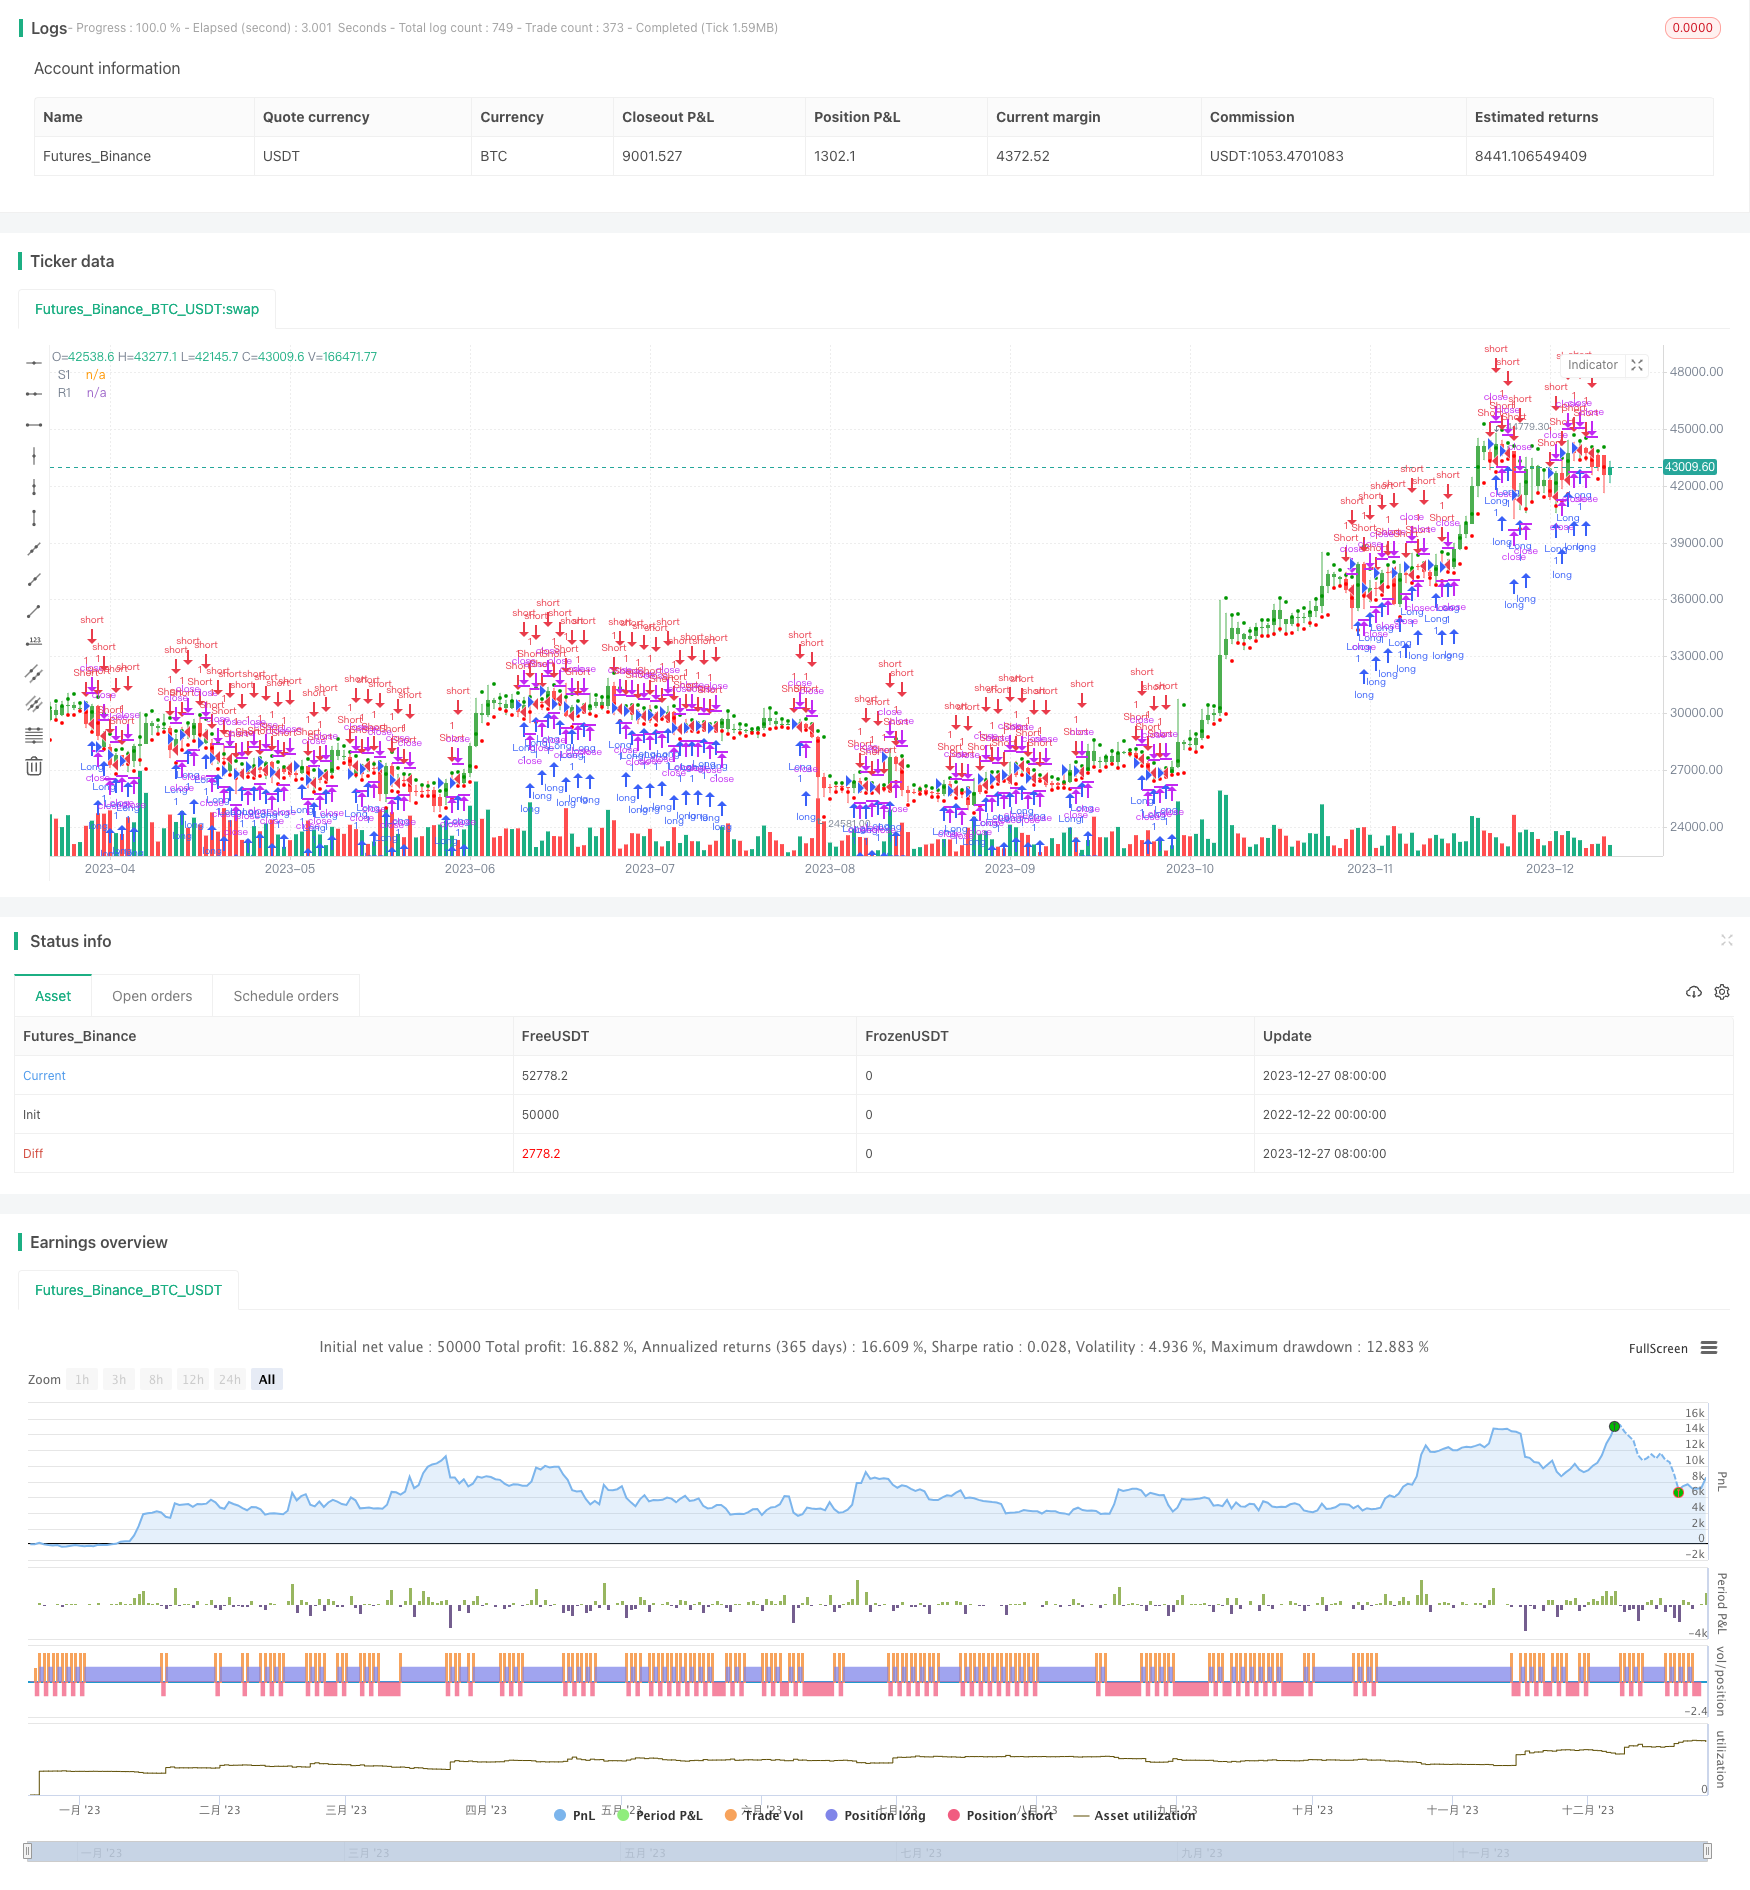
この戦略は,前日取引の最高価格,最低価格,および閉店価格の計算されたサポートレジスタンスレベルに基づいて,現在の取引日にロングポジションまたはショートポジションの操作を行います. 価格が上方レジスタンスレベルR1を突破すると,多額の取引を行います. 価格が下方レジスタンスレベルS1を突破すると,空白を行います. この戦略は,ダイナミックサポートレジスタンス戦略に属します.
戦略原則
- 前日の最高値xHigh,最低値xLow,閉盘値xCloseに基づいて,その日のサポートレベルS1,レジスタンスレベルR1,および枢軸ポイントvPPを計算する.
vPP = (xHigh+xLow+xClose) / 3
vR1 = vPP+(vPP-xLow)
vS1 = vPP-(xHigh - vPP)
- 価格がvR1またはvS1を突破するかどうかを判断し,vR1を突破すると多めにし,vS1を下回ると空っぽにします.POS記録は空っぽの方向を多めにします.
pos = iff(close > vR1, 1,
iff(close < vS1, -1, nz(pos[1], 0)))
possigは実際の取引方向を記録する.反転取引をreverse=trueに開いた場合,取引信号は反転する.
POSSIG信号によると,vR1を突破すると多行,vS1を突破すると空行.
戦略的優位性
- この戦略は,動的サポートとレジスタンス指標を活用して,突破的な動きを捉えることができます.
- サポートレジスタンス位は毎日更新され,動的である.
- ポジティブ取引または反転取引の選択があり,異なる市場環境に適用されます.
- 戦略はシンプルでわかりやすく,実行は簡単です.
- 支持するレジスタンス値を視覚的に表示し,直観的にトレンドの転換を判断する.
リスク分析
- 市場が揺れ動けば,不必要な買い/売りシグナルが繰り返し発せられるかもしれない.
- 異常なトレンド性行為が発生した場合,サポートレジスタンスが破られた後,継続して延長され,損失を引き起こす可能性があります.
- 枢軸点と支柱抵抗位の計算方法は比較的単純で,さらに最適化される必要がある.
リスク対策:
- 持株規模を適切に調整し,単発損失を制御する.
- ストップ・ロスを設定して,許容範囲を超える損失を避ける.
- 他の指標のフィルタリング信号と組み合わせて,変動の時に頻繁に取引を避ける.
最適化の方向
- サポート抵抗位の計算方法を最適化して,より予測できるようにする.
- 傾向やモメンタムなどの指標の組み合わせを増やし,不必要な取引を避ける.
- ストップ・ロスの策略を増やし,単発と最大損失をコントロールする.
- 機械学習の手法と組み合わせて,支柱抵抗位計算を動的に最適化することができる.
要約する
この戦略は,動的サポート・レジスタンス指標に基づいて,価格突破の方向に応じてポジションを保持する.戦略の構想は単純で,理解しやすく,実行でき,トレンドの転換点を効果的に捕捉することができる.しかし,他の指標と組み合わせてさらに最適化する必要のあるリスクもあります.取引信号をより正確に信頼できるようにする.全体的に,この戦略は,補助判断指標として使用する,または取引を量化するための基礎戦略の1つとして適しています.
ストラテジーソースコード
//@version=2
////////////////////////////////////////////////////////////
//  Copyright by HPotter v1.0 14/06/2018
// This Pivot points is calculated on the current day.
// Pivot points simply took the high, low, and closing price from the previous period and
// divided by 3 to find the pivot. From this pivot, traders would then base their
// calculations for three support, and three resistance levels. The calculation for the most
// basic flavor of pivot points, known as ‘floor-trader pivots’, along with their support and
// resistance levels.
//
// You can change long to short in the Input Settings
// WARNING:
// - For purpose educate only
// - This script to change bars colors.
////////////////////////////////////////////////////////////
strategy(title="Dynamic Pivot Point Backtest", shorttitle="Dynamic Pivot Point", overlay = true)
reverse = input(false, title="Trade reverse")
xHigh  = request.security(syminfo.tickerid,"D", high[1])
xLow   = request.security(syminfo.tickerid,"D", low[1])
xClose = request.security(syminfo.tickerid,"D", close[1])
vPP = (xHigh+xLow+xClose) / 3
vR1 = vPP+(vPP-xLow)
vS1 = vPP-(xHigh - vPP)
pos = iff(close > vR1, 1,
       iff(close < vS1, -1, nz(pos[1], 0)))
possig = iff(reverse and pos == 1, -1,
          iff(reverse and pos == -1, 1, pos))
if (possig == 1)
    strategy.entry("Long", strategy.long)
if (possig == -1)
    strategy.entry("Short", strategy.short)
barcolor(possig == -1 ? red: possig == 1 ? green : blue )
plot(vS1, color=#ff0000, title="S1", style = circles, linewidth = 1)
plot(vR1, color=#009600, title="R1", style = circles, linewidth = 1)