取引戦略を改善するためのRSIインジケーター
戦略概要
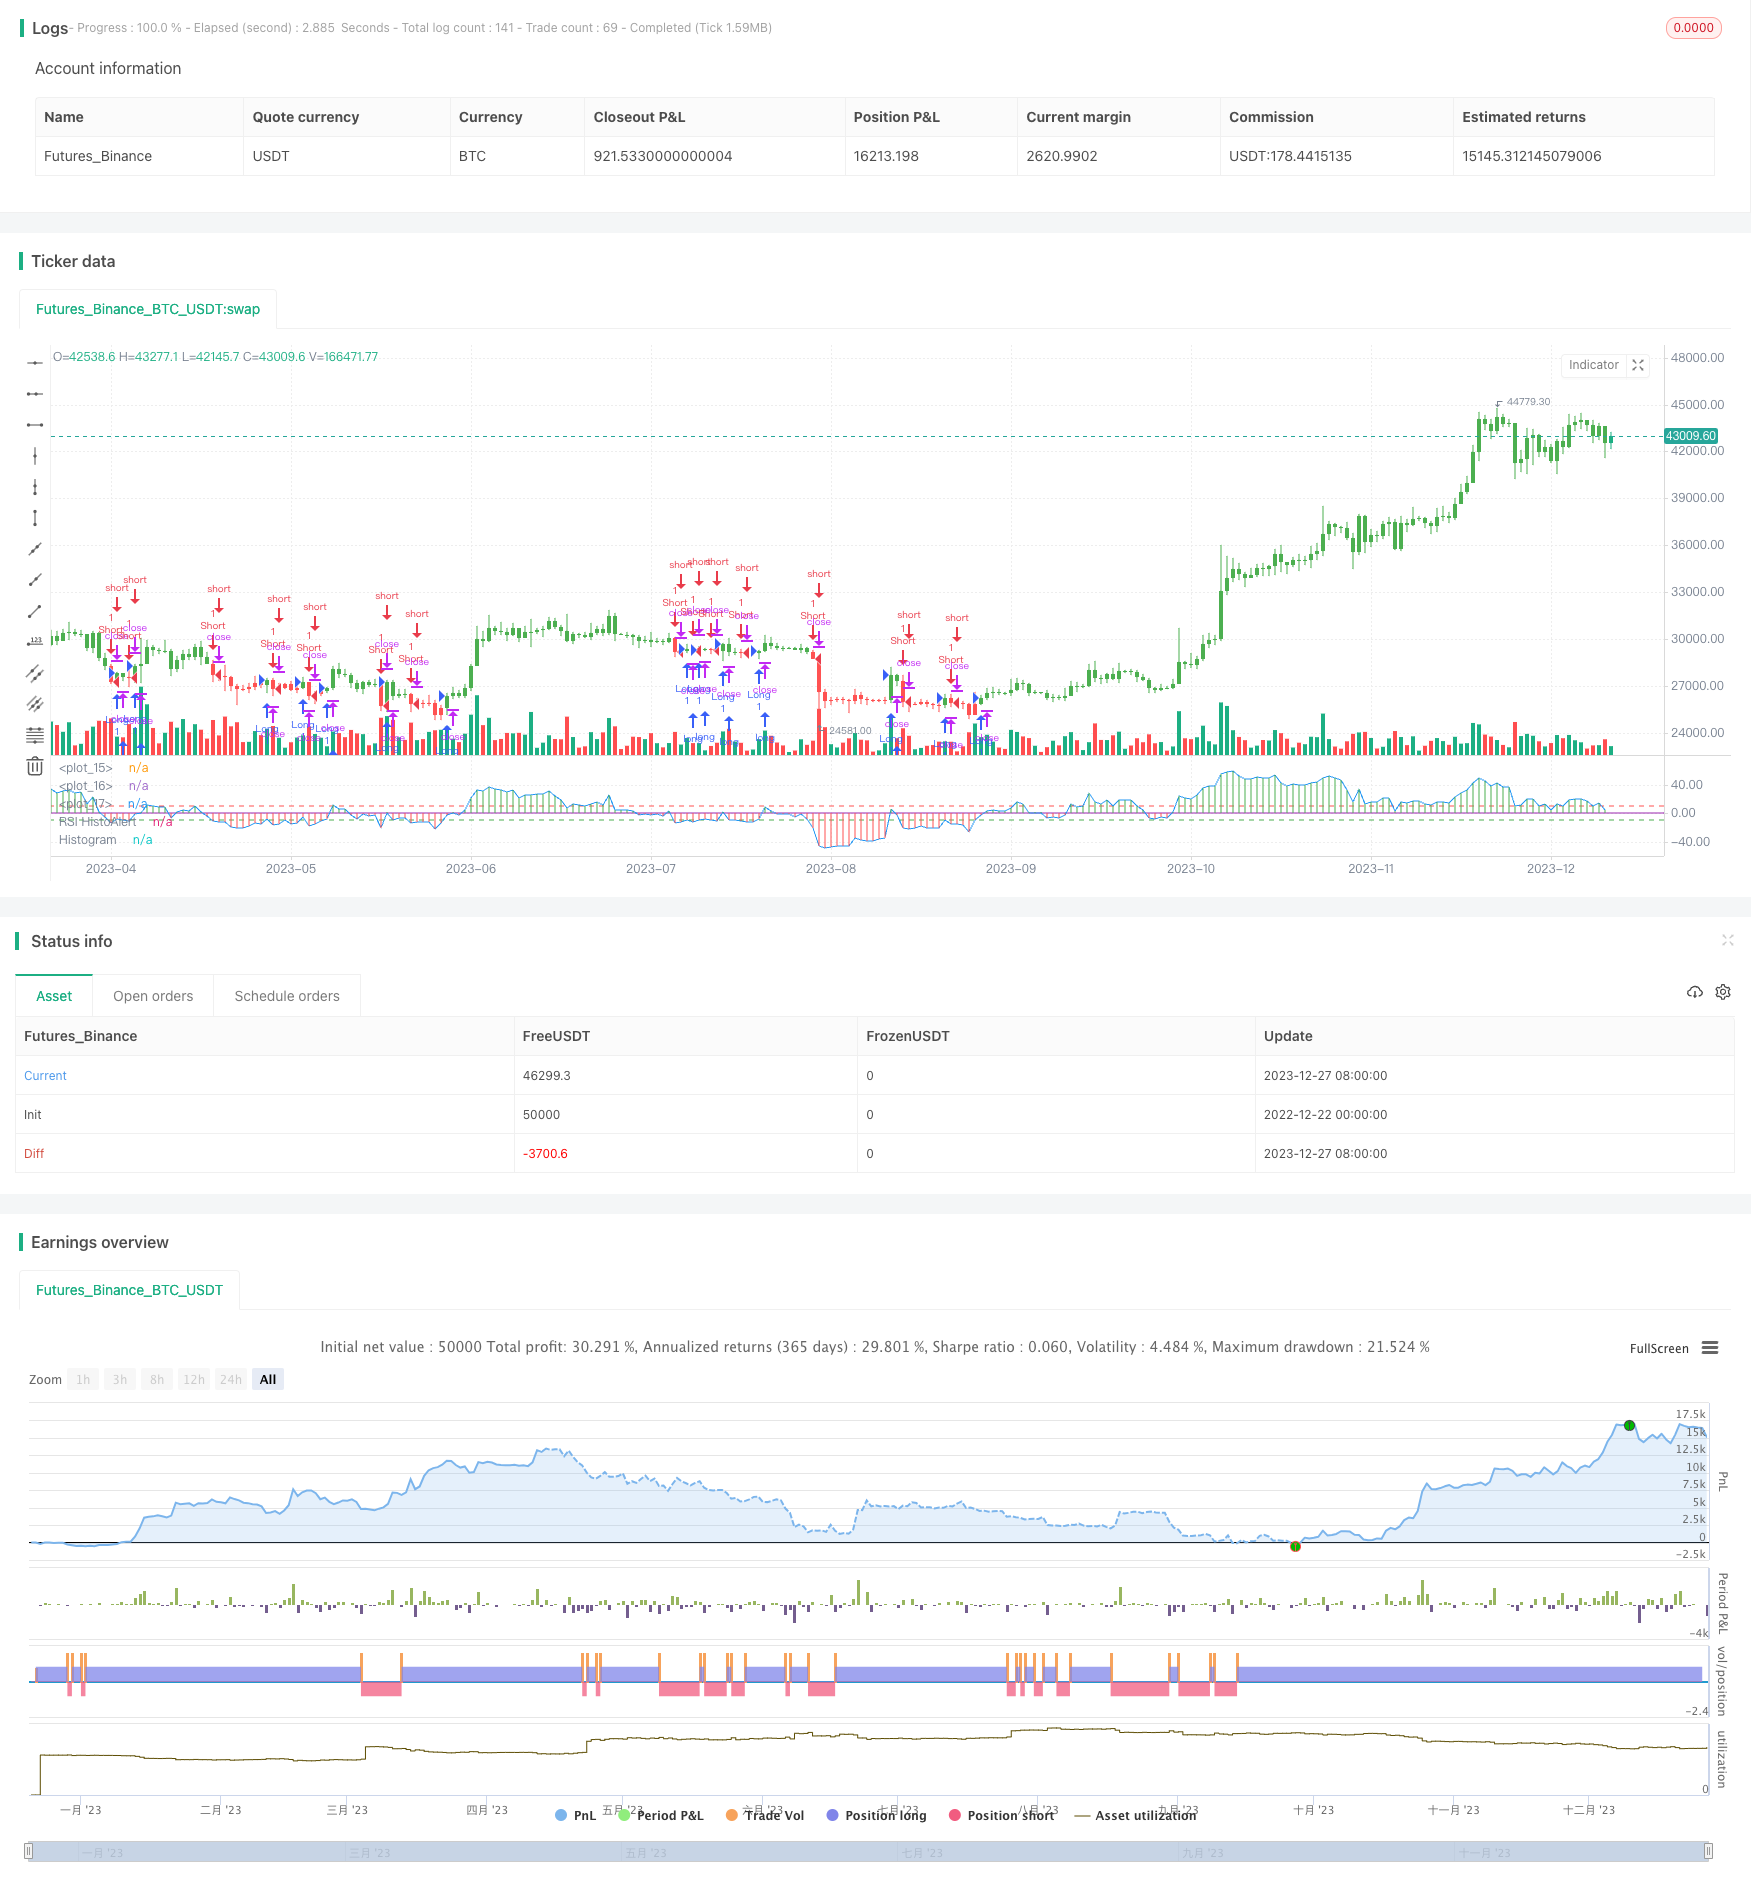
この戦略は,従来のRSI指標に改良され,購入と販売の警戒線を設定し,RSI指標が警戒線を突破すると,購入または販売の操作を行う.同時に,この戦略は,長短ポジションの切り替え機能も提供している.
2 戦略の詳細
1. 戦略名:RSI ヒストグラム アレート 戦略
この戦略は,RSI指標のヒストグラムによって,買い/売却のシグナルをトリガーします.
2. 戦略の原則
(1) RSIの値の計算は次の式で行われます.
RSIMain = (rsi(xPrice, RSIPeriod) - 50) * RSIHistoModify
xPriceは価格の順序,RSIPeriodはRSIを計算するパラメータ,RSIHistoModifyはRSIの値のスケーリング係数である.
(2) BuyAlertLevelとSellAlertLevelの買入警戒線を設定します. RSI指標が買入警戒線より高く,売出警戒線より低く,買入信号になります.
(3) RSI指標のヒストグラムを描画し,買付信号を可視化する.
(4) ポジションposを設定し,シグナルがトリガーされると,posを1 ((多) や-1 ((空) に設定し,正向取引または逆向取引を選択することができます.
(5) 入場方向と価格をposの値から判断する.
3. 戦略的優位性
(1) RSIの使い方が改善され,買い物シグナルがより明確に表示されます.
(2) RSI指標と警戒線を調整し,異なる市場に対応するカスタマイズ可能なパラメータ.
(3) 直観的な買取・売買信号のヒストグラム
(4) ポジティブ取引と逆取引の選択
(5) 戦略はシンプルでわかりやすく,理解しやすく,変更しやすい.
4. 戦略的リスク
(1) 誤信号を誘発しやすい.RSI指数はそれ自体で誤信号を誘発しやすい.
(2) 止損を考慮していない場合,大きな損失のリスクがある.
(3) パラメータを正しく設定しない場合も失敗に繋がります.
5. 戦略の最適化方向
(1) 他の指標のフィルタリング信号と組み合わせて,誤信号を避ける.例えば,取引量の突破を考慮する.
(2) 損失防止装置を設置する.
(3) パラメータ最適化,最適なパラメータを見つける.
(4) 最適なパラメータをアルゴリズムで自動検索する機械学習の組み合わせを検討する.
3つ目 結論
この戦略は,RSI指標の使い方を改善し,買入警戒線を設定し,より明確に直感的に買入信号を表現する.原始RSI指標に比べて,より強力な実用性がある.しかし,一定のリスクも存在し,リスクを軽減するために,他の技術指標とストップと組み合わせて,さらに最適化する必要があります.この戦略の構想はシンプルで,量化取引の初心者の学習と実践に適しています.
/*backtest
start: 2022-12-22 00:00:00
end: 2023-12-28 00:00:00
period: 1d
basePeriod: 1h
exchanges: [{"eid":"Futures_Binance","currency":"BTC_USDT"}]
*/

//@version=2
////////////////////////////////////////////////////////////
//  Copyright by HPotter v1.0 22/12/2016
// This simple indicator modified RSI
// You can use in the xPrice any series: Open, High, Low, Close, HL2, HLC3, OHLC4 and ect...
// You can change long to short in the Input Settings
// Please, use it only for learning or paper trading. Do not for real trading.
////////////////////////////////////////////////////////////
strategy(title="RSI HistoAlert Strategy")
RSIPeriod = input(13, minval=1)
BuyAlertLevel = input(-10)
SellAlertLevel = input(10)
RSIHistoModify = input(1.5)
reverse = input(false, title="Trade reverse")
hline(0, color=purple, linestyle=line)
hline(BuyAlertLevel, color=green)
hline(SellAlertLevel, color=red)
xPrice = close
RSIMain = (rsi(xPrice, RSIPeriod) - 50) * RSIHistoModify
rsiHcolor =  iff(RSIMain >= 0 , green,
              iff(RSIMain < 0, red, black))
pos = iff(RSIMain > BuyAlertLevel, 1,
	     iff(RSIMain < SellAlertLevel, -1, nz(pos[1], 0)))
possig = iff(reverse and pos == 1, -1,
          iff(reverse and pos == -1, 1, pos))
if (possig == 1)
    strategy.entry("Long", strategy.long)
if (possig == -1)
    strategy.entry("Short", strategy.short)
barcolor(possig == -1 ? red: possig == 1 ? green : blue )
plot(RSIMain, color=blue, title="RSI HistoAlert")
plot(RSIMain, color=rsiHcolor, title="Histogram", style = histogram, linewidth  = 1)