移行ゾーン戦略
作成日:
2023-12-29 17:03:27
最終変更日:
2023-12-29 17:03:27
コピー:
1
クリック数:
975
1
フォロー
1750
フォロワー
概要
トランジション区間戦略は,価格の波動区間に基づくショートライン取引戦略である.それは,価格が一定の時間帯で形成される波動区間を使用して,市場動向を判断し,区間が破られたときに買い出しをする/空にする.
戦略原則
この戦略は,過去N根K線の最高値と最低値を計算して,価格の波動区間を構成する.最新のK線がこの区間を貫通すると,トレンドが逆転することを判断し,取引信号を生成する.
具体的には,ストラテジーは,最終のN根K線 ((調整可能なパラメータN) の最高値と最低値を追跡し続けており,そのうち:
- 値の最小値 = 過去のN根K線の最小値
- 値の最大値 = 過去のN根K線の最高値
価格の変動区間が作られるのです.
最新のK線の閉盘価格が区間の最高価格より高いとき,区間の突破を示し,多行シグナルを生成する. 最新のK線の閉盘価格が区間の最低価格より低いとき,区間の突破を示し,空白シグナルを生成する.
さらに,カラーフィルターと実体フィルターが追加された.カラーフィルターはK線の色に基づいて信号をフィルターし,実体フィルターはK線実体のサイズに基づいて信号をフィルターする.これは,いくつかの偽信号をフィルターする.
戦略的優位性
この戦略の利点は以下の通りです.
- 価格の区間を把握し,トレンドの転換点を判断し,多空を正確に行う
- カラーフィルターと実体フィルター,偽信号をフィルターする
- 戦略の論理はシンプルで明快で,パラメータを簡単に理解し,調整できます.
- 調整可能なパラメータが多く,戦略を最適化できます.
リスク分析
この戦略にはいくつかのリスクがあります.
- パラメータの不適切な設定は,取引頻度が高く,取引費用が高くなる可能性があります.
- 区間範囲の設定が不適切で,区間突破の偽信号が多すぎる可能性があります.
- 市場が激しく波動する時には,価格区間の予測は効果的ではない.
- 価格の空飛ぶギャップに対処できない状況
これらのリスクは,区間パラメータの調整,信号フィルタリング条件の最適化などの方法によって軽減できます.
最適化の方向
この戦略は以下の方向から最適化できます.
- 固定N根K線ではなく,価格区間の範囲を動的に調整する
- ストップ・ロジックを導入し,損失のリスクを低減する
- フィルターパラメータを最適化し,信号品質を向上させる
- 価格のギャップを処理する論理を追加
- 複数のタイムサイクルを組み合わせた判断信号で,罠にはならない.
要約する
トランジション区間戦略は,全体として比較的シンプルで実用的なショートライン取引戦略である.価格区間によってトレンドの転換点を判断し,市場情勢の機会を迅速に捉えることができる.同時に,注意すべきいくつかのリスクもある.パラメータの調整と最適化により,この戦略をさらに完善し,収益性を向上させることができる.
ストラテジーソースコード
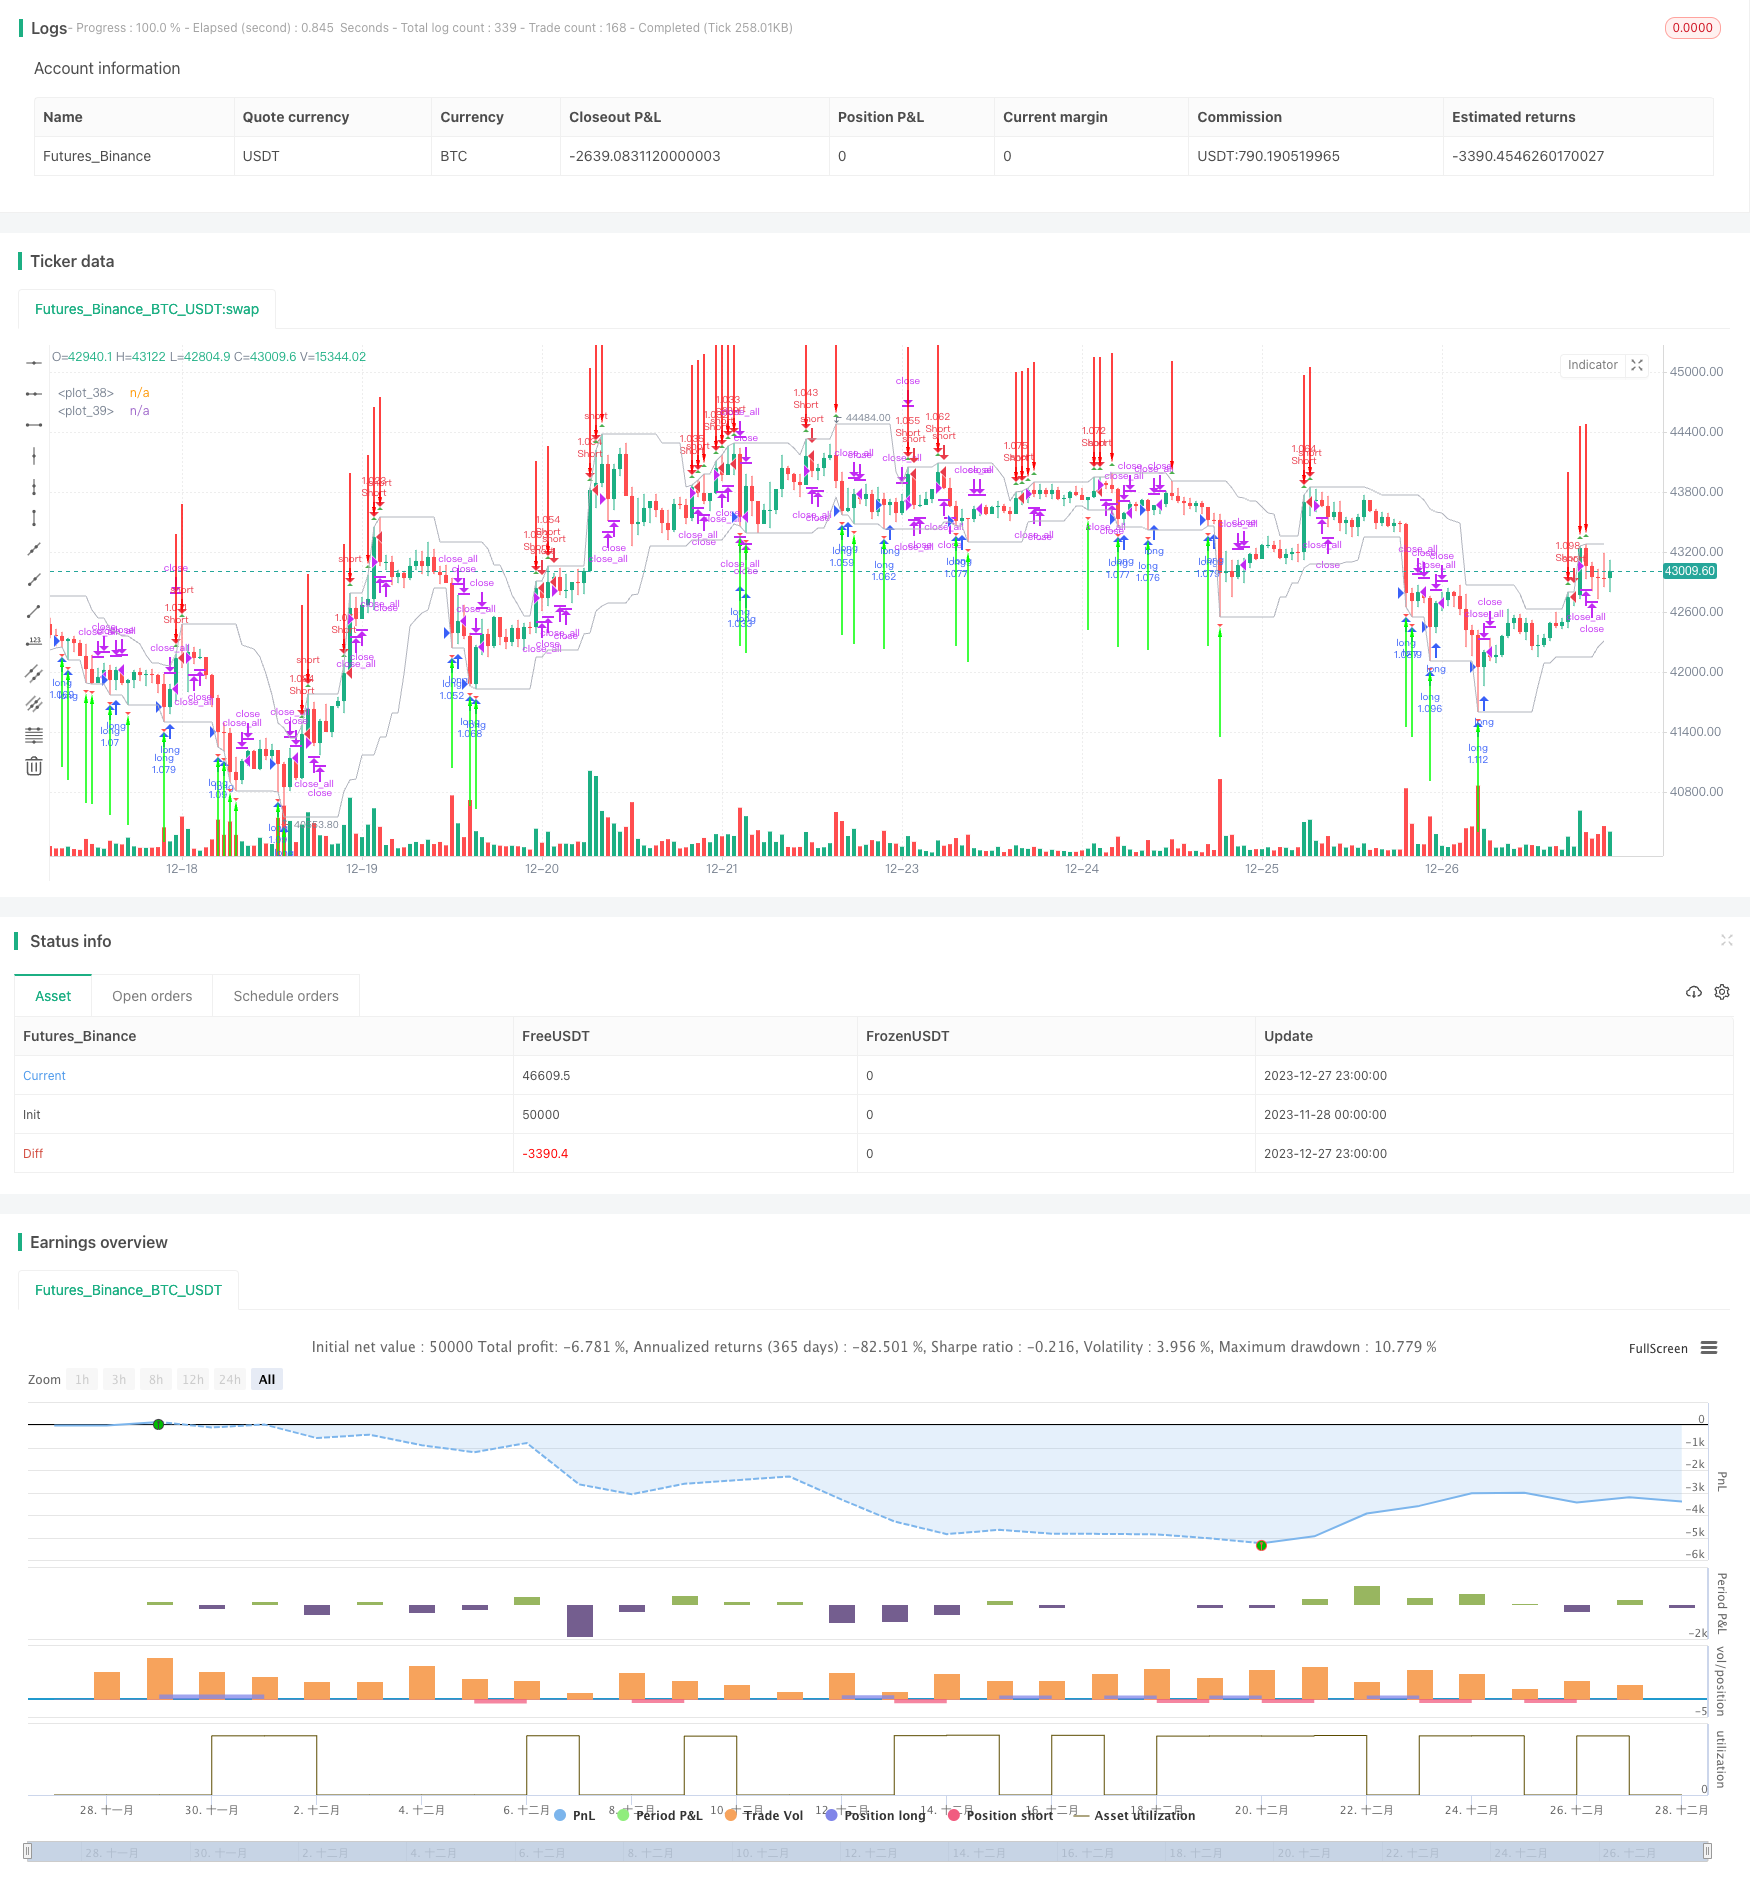
/*backtest
start: 2023-11-28 00:00:00
end: 2023-12-28 00:00:00
period: 1h
basePeriod: 15m
exchanges: [{"eid":"Futures_Binance","currency":"BTC_USDT"}]
*/

//Noro
//2018

//@version=2
strategy("Noro's Transient Zones Strategy v1.0", shorttitle = "TZ str 1.0", overlay=true, default_qty_type = strategy.percent_of_equity, default_qty_value = 100, pyramiding = 0)

//Settings
needlong = input(true, defval = true, title = "Long")
needshort = input(true, defval = true, title = "Short")
capital = input(100, defval = 100, minval = 1, maxval = 10000, title = "Capital, %")

usecol = input(true, defval = true, title = "Use Color-Filter")
usebod = input(true, defval = true, title = "Use Body-Filter")

h_left = input(title = "H left", defval = 10)
h_right = -1
sample_period = input(title = "Sample bars for % TZ",  defval = 5000)
show_ptz = input(title = "Show PTZ", type = bool, defval = true)
show_channel = input(title = "Show channel", type = bool, defval = true)

fromyear = input(2018, defval = 2018, minval = 1900, maxval = 2100, title = "From Year")
toyear = input(2100, defval = 2100, minval = 1900, maxval = 2100, title = "To Year")
frommonth = input(01, defval = 01, minval = 01, maxval = 12, title = "From Month")
tomonth = input(12, defval = 12, minval = 01, maxval = 12, title = "To Month")
fromday = input(01, defval = 01, minval = 01, maxval = 31, title = "From day")
today = input(31, defval = 31, minval = 01, maxval = 31, title = "To day")

//By Jurij w/ TZ percent occurrence by SPYderCrusher

//barCount = nz(barCount[1]) + 1
//check history and realtime PTZ
h_left_low = lowest(h_left)
h_left_high = highest(h_left)
newlow = low <= h_left_low
newhigh = high >= h_left_high
plotshape(newlow and show_ptz, style=shape.triangledown, location=location.belowbar, color=red)
plotshape(newhigh and show_ptz, style=shape.triangleup, location=location.abovebar, color=green)
channel_high = plot(show_channel ? h_left_low : 0, color=silver)
channel_low = plot (show_channel ? h_left_high : 0, color=silver)

//check true TZ back in history
central_bar_low = low[h_right + 1]
central_bar_high = high[h_right + 1]
full_zone_low = lowest(h_left + h_right + 1)
full_zone_high = highest(h_left + h_right + 1)
central_bar_is_highest = central_bar_high >= full_zone_high
central_bar_is_lowest = central_bar_low <= full_zone_low
plotarrow(central_bar_is_highest ? -1 : 0, offset=-h_right-1)
plotarrow(central_bar_is_lowest ? 1 : 0, offset=-h_right-1)

//Color Filter
bar = close > open ? 1 : close < open ? -1 : 0

//Body Filter
nbody = abs(close - open)
abody = sma(nbody, 10)
body = nbody > abody / 3 or usebod == false

//Signals
up1 = central_bar_is_lowest and body and (bar == -1 or usecol == false)
dn1 = central_bar_is_highest and body and (bar == 1 or usecol == false)
exit = ((strategy.position_size > 0 and close > open) or (strategy.position_size < 0 and close < open)) and body

//Trading
lot = strategy.position_size == 0 ? strategy.equity / close * capital / 100 : lot[1]

if up1
    if strategy.position_size < 0
        strategy.close_all()

    strategy.entry("long", strategy.long, needlong == false ? 0 : lot, when=(time > timestamp(fromyear, frommonth, fromday, 00, 00) and time < timestamp(toyear, tomonth, today, 23, 59)))

if dn1
    if strategy.position_size > 0
        strategy.close_all()

    strategy.entry("Short", strategy.short, needshort == false ? 0 : lot, when=(time > timestamp(fromyear, frommonth, fromday, 00, 00) and time < timestamp(toyear, tomonth, today, 23, 59)))

if time > timestamp(toyear, tomonth, today, 23, 59) or exit
    strategy.close_all()