適応型カウフマン移動平均トレンドフォロー戦略
作成日:
2024-01-03 16:01:20
最終変更日:
2024-01-03 16:01:20
コピー:
2
クリック数:
923
1
フォロー
1750
フォロワー
概要
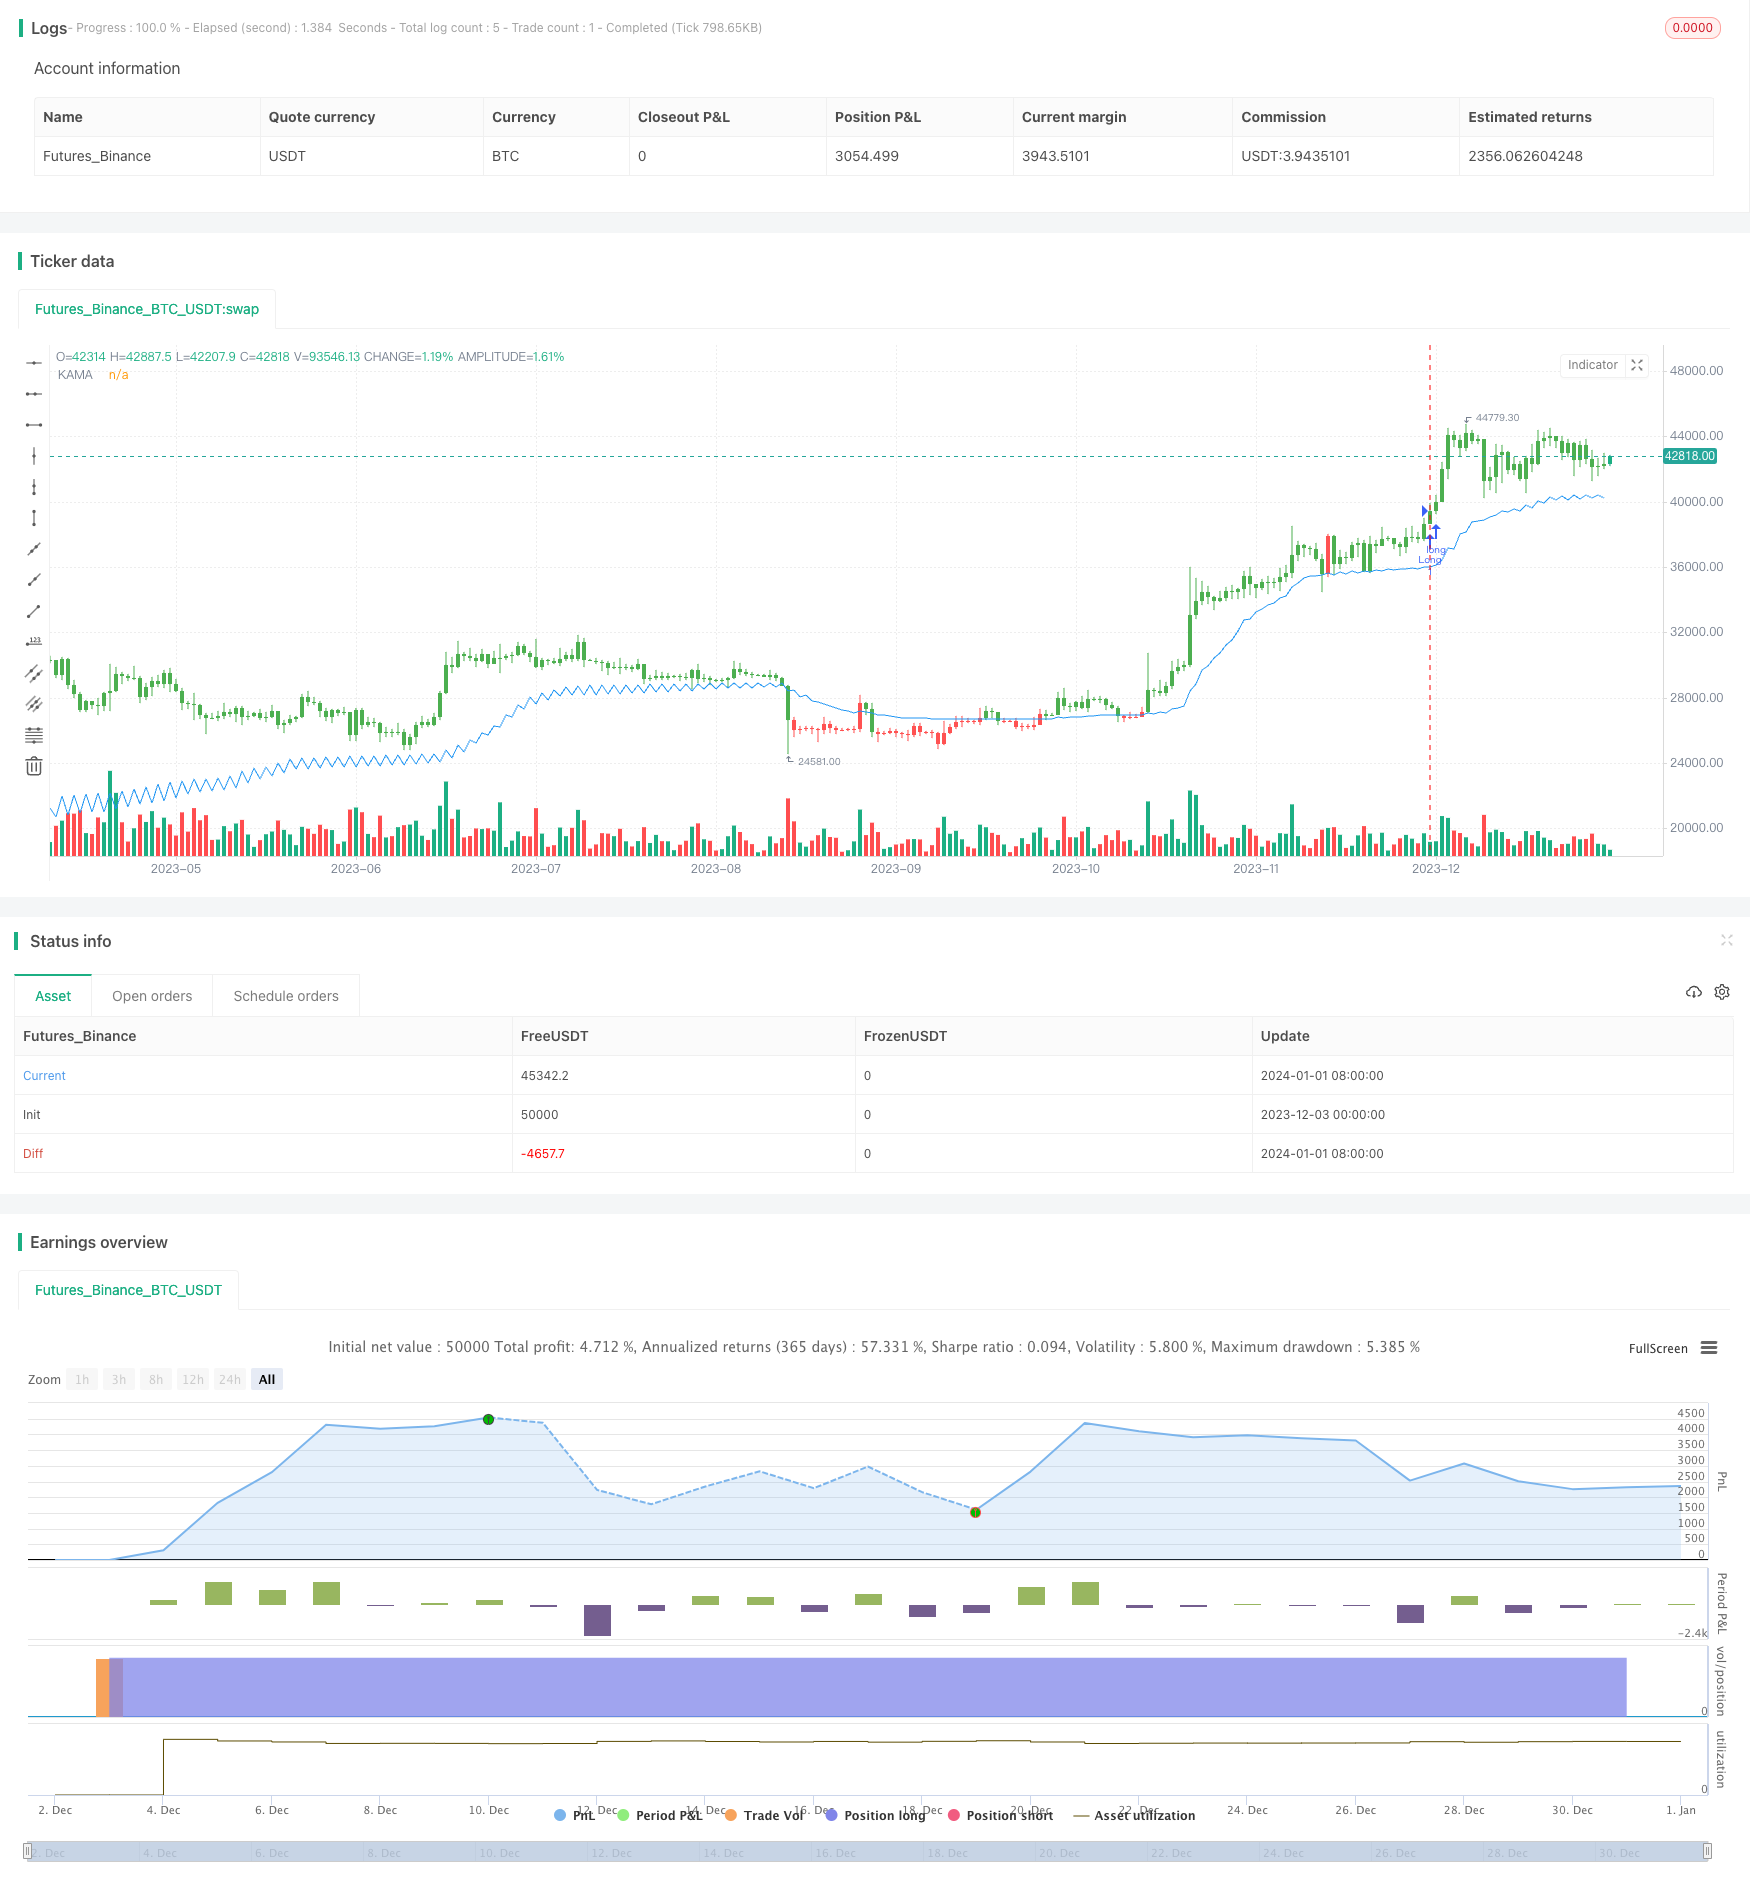
この戦略は,自律移動平均指標カフマン自律移動平均 ((KAMA) を利用して価格動向を追跡し,低価格で高価格で売り,利益を得る.
戦略原則
カフマン自律移動平均 (KAMA) の計算式は以下のとおりである.
nAMA = nz(nAMA[1]) + nsmooth * (Close - nz(nAMA[1]))

其中:

nsmooth = (nefratio * (nfastend - nslowend) + nslowend)^2

nefratio = nsignal / nnoise

nsignal = |Close - Close[Length]|

nnoise = sum(|Close - Close[1]|, Length)

nfastend = 0.666

nslowend = 0.0645
この指標は,市場の変動と価格変化の傾向を考慮し,価格の動向をより迅速に追跡することができます.具体的には:
- 市場波動が小さいとき,nsmoothはnslowendに近づき,KAMA線はゆっくり変化し,市場騒音を抑制する.
- 市場波動が大きくなり,トレンドが現れたとき,nsmoothはnfastendに近づき,KAMA線は急速に変化し,トレンドを追跡する.
価格とKAMAの関係を比較することで,価格の傾向方向を判断し,空白を増やすことを決定することができます.
戦略的優位性
この戦略の最大の利点は,価格動向の変化を追跡する自適性のある移動平均指標を利用することで,ノイズの影響を効果的に軽減でき,追跡効果が良好であることです.具体的利点は以下の通りです.
- KAMA指数は市場の騒音を抑制し,不必要な取引の組み合わせを減らすことができます.
- KAMA指数は価格の変化の傾向に素早く反応し,その効果を追跡する.
- 戦略的意思決定のルールはシンプルで明確で,理解し,実行しやすい.
- 逆取引を設定して,異なる市場環境に対応します.
戦略リスク
この戦略にはいくつかのリスクがあります.
- 震動状況では,KAMA指標は誤差信号が発生する可能性がある。パラメータを調整することで指標効果を最適化することができる。
- 追跡の遅延は存在し,短期的な価格逆転を逃す可能性があります.
- 取引費用やスライドポイントを考慮しないと,リッドディスクの効果は回測よりも弱くなる.
戦略最適化の方向性
この戦略は,以下の点で最適化できます.
- KAMAパラメータを最適化して,指標の追跡感度を向上させる.
- 単一取引の最大損失をコントロールする 損失防止メカニズムを追加する
- 他の指標と組み合わせたフィルタリング信号により,意思決定の精度が向上します.
- また,再入学メカニズムを追加し,さらにトレンドを追跡する.
要約する
この戦略は,カフマン自適応移動平均指標を用いて価格トレンドを追跡し,意思決定規則はシンプルで明快で,实体操作は簡単である.この指標は,ノイズを抑制しながら価格の変化に迅速に対応し,追跡効果は良好で,推奨されるトレンド追跡戦略である.
ストラテジーソースコード
/*backtest
start: 2023-12-03 00:00:00
end: 2024-01-02 00:00:00
period: 1d
basePeriod: 1h
exchanges: [{"eid":"Futures_Binance","currency":"BTC_USDT"}]
*/

//@version=2
////////////////////////////////////////////////////////////
//  Copyright by HPotter v1.0 25/08/2017
// Everyone wants a short-term, fast trading trend that works without large
// losses. That combination does not exist. But it is possible to have fast
// trading trends in which one must get in or out of the market quickly, but
// these have the distinct disadvantage of being whipsawed by market noise
// when the market is volatile in a sideways trending market. During these
// periods, the trader is jumping in and out of positions with no profit-making
// trend in sight. In an attempt to overcome the problem of noise and still be
// able to get closer to the actual change of the trend, Kaufman developed an
// indicator that adapts to market movement. This indicator, an adaptive moving
// average (AMA), moves very slowly when markets are moving sideways but moves
// swiftly when the markets also move swiftly, change directions or break out of
// a trading range.
//
// You can change long to short in the Input Settings
// Please, use it only for learning or paper trading. Do not for real trading.
////////////////////////////////////////////////////////////
strategy(title="Kaufman Moving Average Adaptive (KAMA)", shorttitle="Kaufman Moving Average Adaptive (KAMA)", overlay = true)
Length = input(21, minval=1)
xPrice = close
xvnoise = abs(xPrice - xPrice[1])
nfastend = 0.666
nslowend = 0.0645
reverse = input(false, title="Trade reverse")
nsignal = abs(xPrice - xPrice[Length])
nnoise = sum(xvnoise, Length)
nefratio = iff(nnoise != 0, nsignal / nnoise, 0)
nsmooth = pow(nefratio * (nfastend - nslowend) + nslowend, 2)
nAMA = nz(nAMA[1]) + nsmooth * (xPrice - nz(nAMA[1]))
pos = iff(close[1] > nAMA, 1,
	   iff(close[1] < nAMA, -1, nz(pos[1], 0)))
possig = iff(reverse and pos == 1, -1,
          iff(reverse and pos == -1, 1, pos))
if (possig == 1)
    strategy.entry("Long", strategy.long)
if (possig == -1)
    strategy.entry("Short", strategy.short)
barcolor(possig == -1 ? red: possig == 1 ? green : blue )
plot(nAMA, color=blue, title="KAMA")