ダブル移動平均クロスオーバートレンドフォロー戦略
作成日:
2024-01-04 15:03:14
最終変更日:
2024-01-04 15:03:14
コピー:
0
クリック数:
649
1
フォロー
1750
フォロワー
概要
この戦略は,シンプルな平均線交差と平均真波幅の指数を用いて買入と売却のシグナルを生成し,トレンド追跡型の戦略である. 主に50日平均線と100日平均線の交差を使用してトレンドを判断し,ATR指数を用いて止損点を設定してリスクを制御する.
戦略原則
- 50日間のSMA1と100日間のSMA2を計算する
- SMA1がSMA2を穿越すると,買い信号が発せられる.SMA1がSMA2を穿越すると,売り信号が発せられる.
- 14日ATRを計算する
- ATRは,設定された倍数で止まります.
- 買取シグナルを発信するときは,閉盘価格減算のストップポイントをストップポイントとして出札する. 閉盘価格加算のストップポイントをストップポイントとして買取する
この戦略は,主に均線のトレンド判断能力とATR指標のリスク制御能力に依存していることがわかります.基本原理はシンプルで明確で,容易に理解し,実行できます.
戦略的優位性
- シンプルで初心者向け
- メイントレンドを平均線で判断し,トレンドを効果的に追跡する.
- ATR停止は,個々の地震による損失を効果的に制御する.
- 異なる市場環境に対応してパラメータを簡単に調整できます.
戦略リスク
- 震動の際,均線は大量に偽信号を発生し,反転点の位置をミスすることが容易である.
- ATR指標は,市場の急速な変化に敏感に反応しないため,予想以上に損失を招く可能性があります.
- 指数パラメータとATR倍数の設定は経験に依存し,不適切な設定は戦略のパフォーマンスに影響を及ぼす
- 双方向線が遅れているため,転換点を見逃す可能性がある.
リスク管理方法:
- 平均周期を適切に短縮して,指標をより敏感にします.
- ATRを動的に調整し,ストップを柔軟に設定します.
- 偽信号をフィルターする他の指標と組み合わせる
- 大規模な構造面の判断に基づいて操作する
戦略最適化の方向性
- 指数移動平均のような他の種類の平均線を試してみてください.
- ATRは,Keltner通路などの動的止損方式の代替を検討する
- 取引量増加などの補助指標のフィルター信号
- 波の理論とサポート抵抗の位置を組み合わせてトレンドのキーポイントを決定する
要約する
この戦略は,典型的なトレンド追跡戦略の1つであり,均線でトレンドの方向を判断し,ATRを設定してリスクを制御し,原理はシンプルで明確で,簡単に把握できます.しかし,一定の遅れや偽信号のリスクがあります.パラメータ調整,指標最適化,より多くの要因を組み合わせる方法などによって改善され,戦略を変化する市場環境に適したものにすることができます.全体的に,この戦略は初心者の実践と最適化に適していますが,実戦では慎重に扱われる必要があります.
ストラテジーソースコード
/*backtest
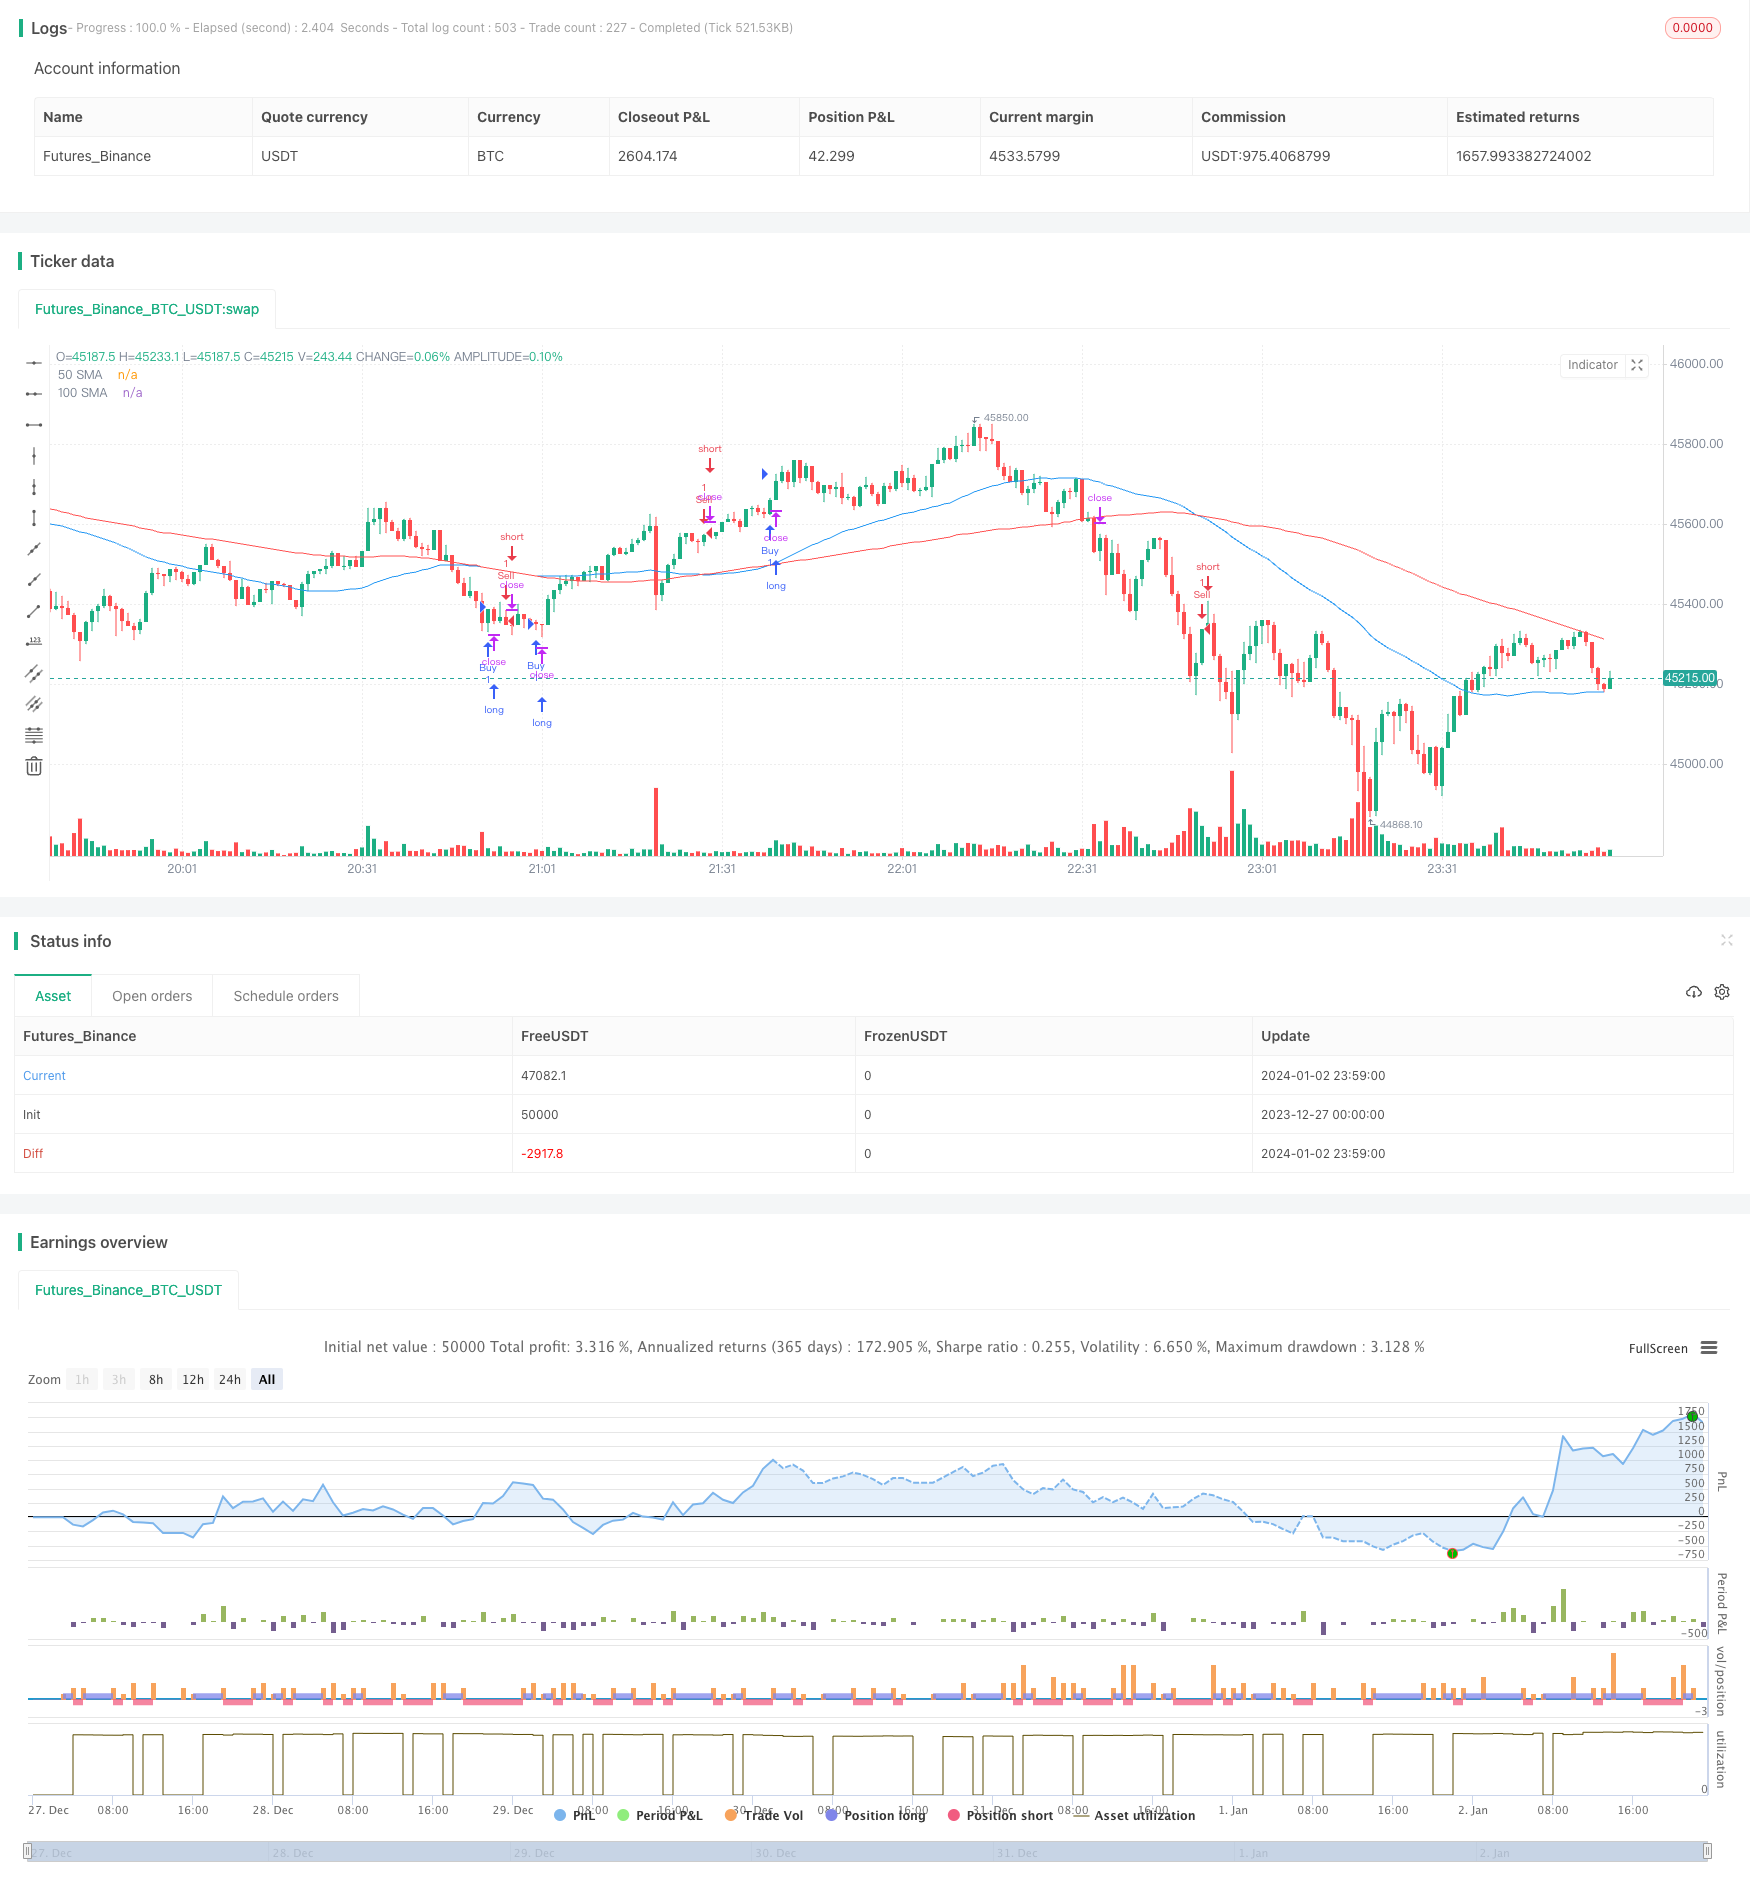
start: 2023-12-27 00:00:00
end: 2024-01-03 00:00:00
period: 1m
basePeriod: 1m
exchanges: [{"eid":"Futures_Binance","currency":"BTC_USDT"}]
*/
//@version=5
strategy("SMA and ATR Strategy", overlay=true)
// Step 1. Define strategy settings
lengthSMA1 = input.int(50, title="50 SMA Length")
lengthSMA2 = input.int(100, title="100 SMA Length")
atrLength = input.int(14, title="ATR Length")
atrMultiplier = input.int(4, title="ATR Multiplier")
// Step 2. Calculate strategy values
sma1 = ta.sma(close, lengthSMA1)
sma2 = ta.sma(close, lengthSMA2)
atr = ta.atr(atrLength)
// Step 3. Output strategy data
plot(sma1, color=color.blue, title="50 SMA")
plot(sma2, color=color.red, title="100 SMA")
// Step 4. Determine trading conditions
longCondition = ta.crossover(sma1, sma2)
shortCondition = ta.crossunder(sma1, sma2)
longStopLoss = close - (atr * atrMultiplier)
shortStopLoss = close + (atr * atrMultiplier)
// Step 5. Execute trades based on conditions
if (longCondition)
strategy.entry("Buy", strategy.long)
strategy.exit("Sell", "Buy", stop=longStopLoss)
if (shortCondition)
strategy.entry("Sell", strategy.short)
strategy.exit("Buy", "Sell", stop=shortStopLoss)