方向指標とハル移動平均の組み合わせ戦略
概要
この戦略は,DMIとHull移動平均の組み合わせを使用して,DMIを使用して市場の方向を判断し,HMAはトレンドの強さを確認し,リスク管理のない取引を実現します.
戦略原則
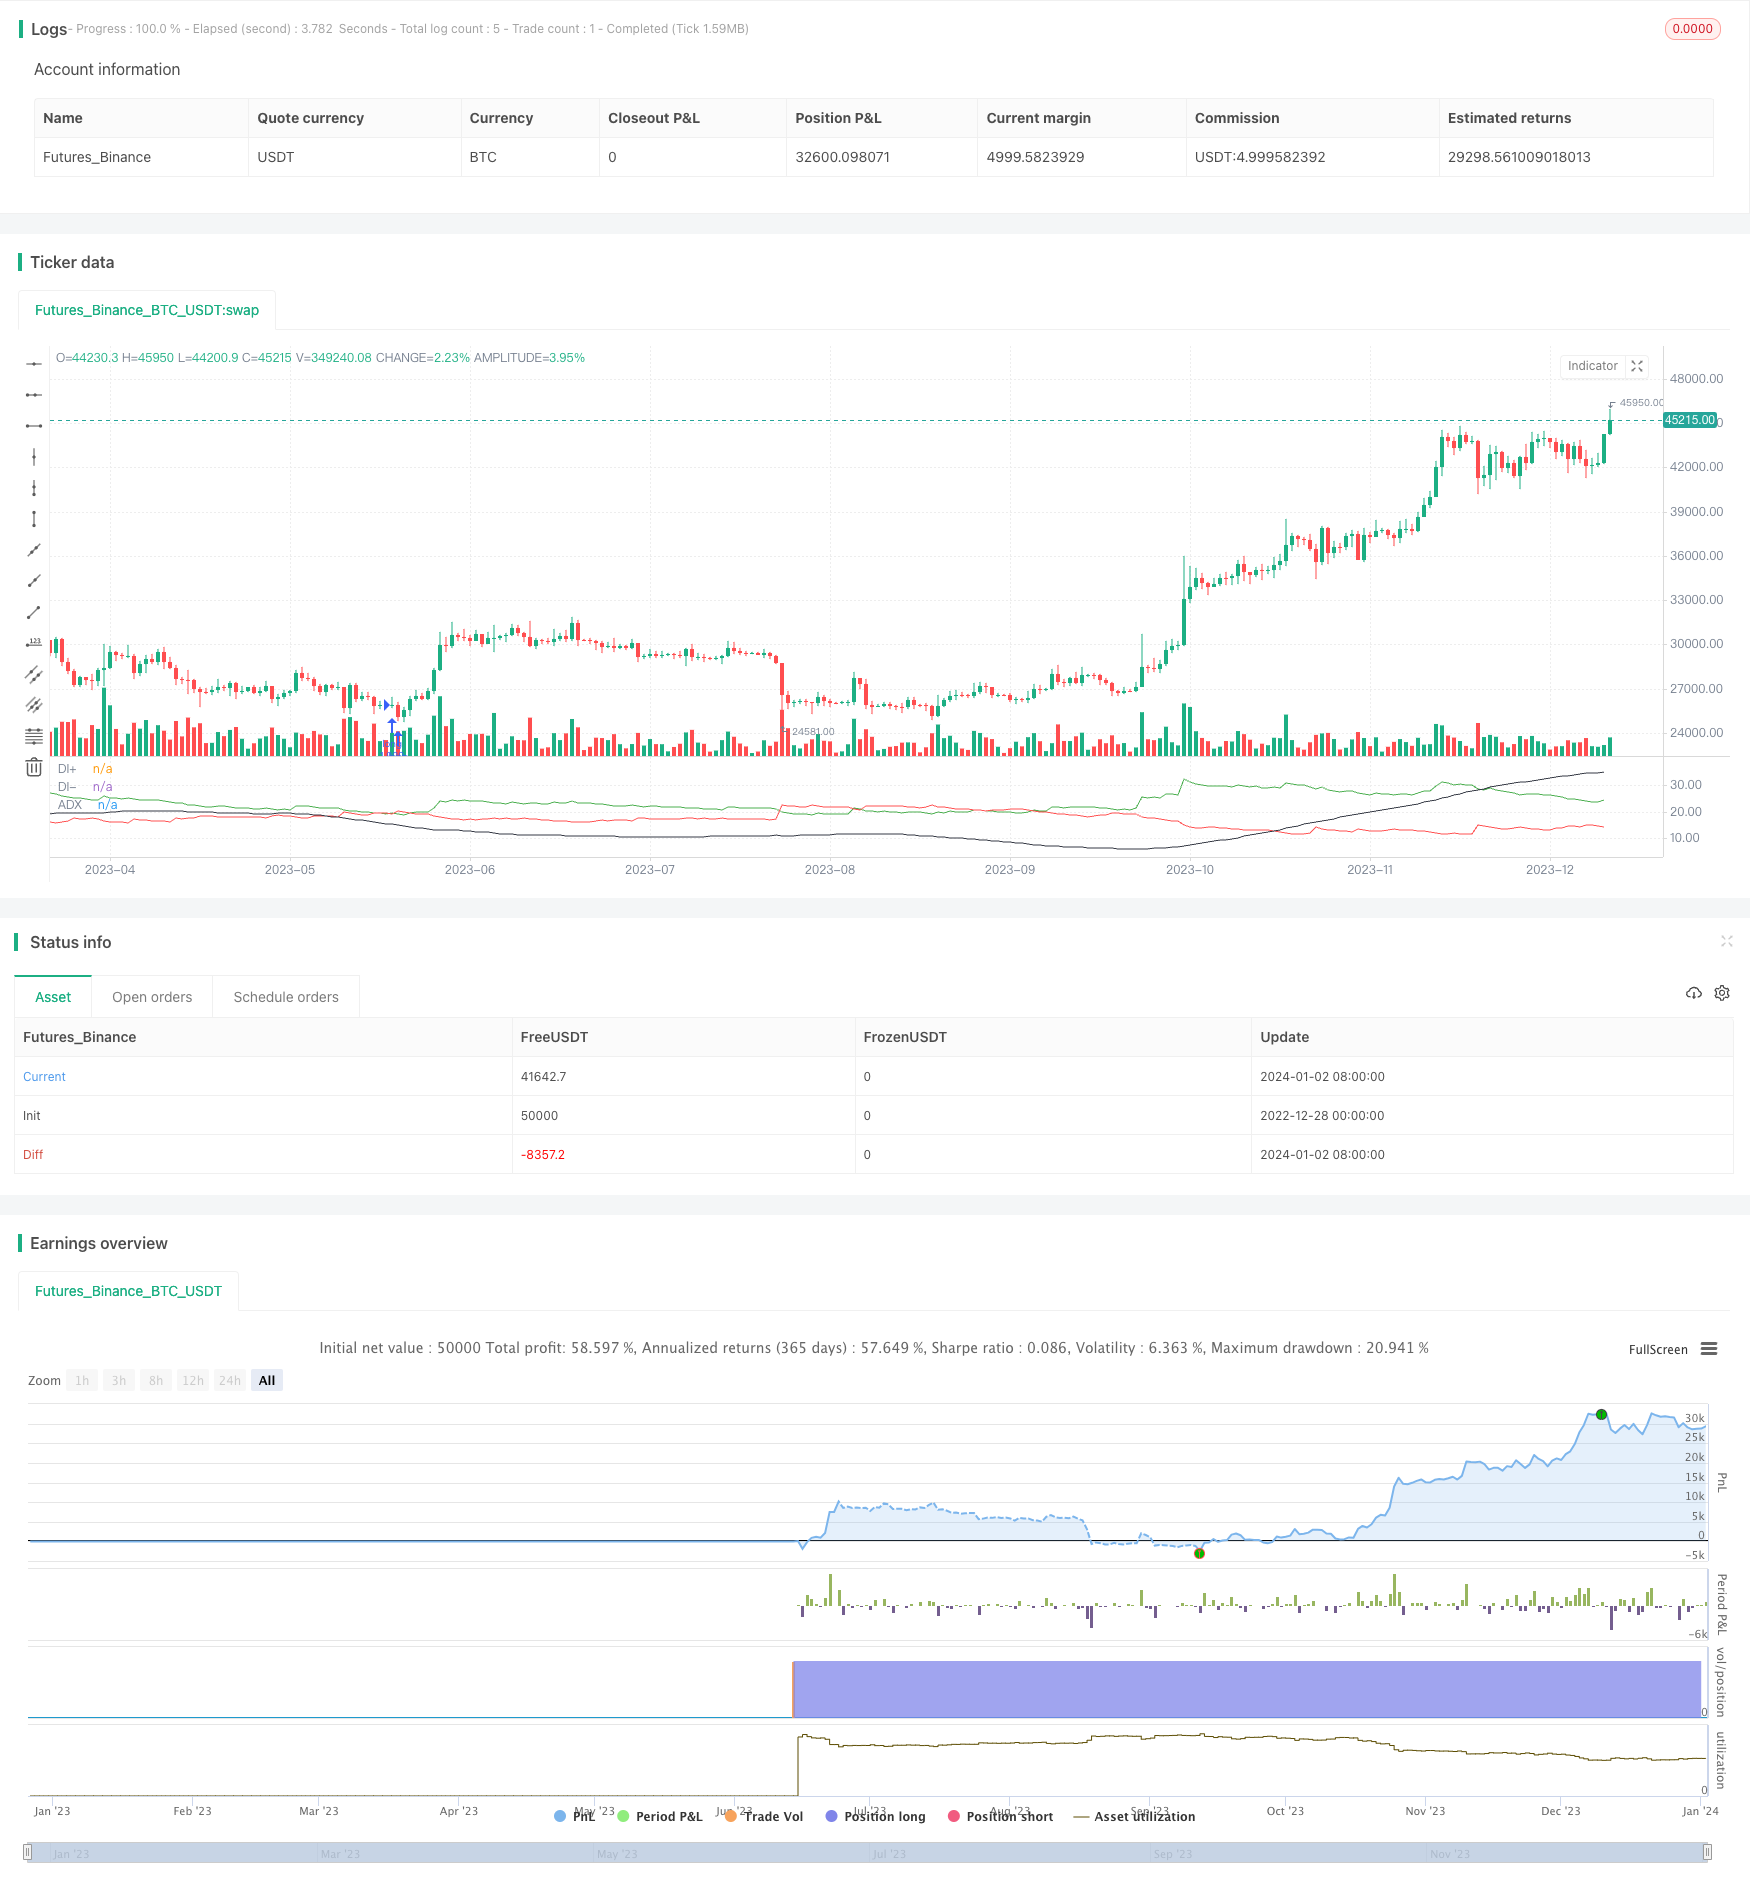
真の波幅 ((True Range),多頭運動指数 ((DIPlus),空頭運動指数 ((DIMinus) と平均方向指数 ((ADX) を計算する.
急速ハル平均 ((fasthull) と遅いハル平均 ((slowhull) を計算する.
DIPlusはDIMinusを着用し,fasthullはslowhullを着用する.
空気空調条件を触発する:DIMinusの下はDIPlusを穿え,fasthullの下はslowhullを穿え。
多空条件を満たした後に多空と空空の信号を発する.
優位分析
この戦略は,トレンド判断指標DMIとHull均線の二重確認と組み合わせて,市場トレンドの方向を効果的に識別し,多頭市場と空頭市場の反復を回避します.無リスクマネジメントにより取引頻度が低下し,長期的には全体的な収益レベルが良好です.
リスク分析
この戦略の最大のリスクは,無止損の設定であり,市場情勢が激しく波動すると,損失を効果的に制御することができないことである.また,パラメータ最適化のスペースが限られ,ターゲット性が強くないことも大きな欠点である.
モバイル・ストップや最適化パラメータの組み合わせなどの手段でリスクを減らすことができます.
最適化の方向
ATRのストップを追加し,リアル波幅のトレーリングストップを使用します.
ハル周期のパラメータを最適化して,最適な組み合わせを見つけます.
動的に調整する多空のパラメータのスレッジ.
消費エネルギー指標などのフィルターを追加し,トレンドが継続することを確認する.
要約する
DMIとHMAの組み合わせ戦略は,判断精度が高く,シンプルで有効で,中長線操作に適している.適切なストップとパラメータの最適化を加えると,非常に優れたトレンド追跡システムになる.
/*backtest
start: 2022-12-28 00:00:00
end: 2024-01-03 00:00:00
period: 1d
basePeriod: 1h
exchanges: [{"eid":"Futures_Binance","currency":"BTC_USDT"}]
*/

// This source code is subject to the terms of the Mozilla Public License 2.0 at https://mozilla.org/MPL/2.0/
// © Tuned_Official
//@version=4
strategy(title="DMI + HMA - No Risk Management", overlay = false, pyramiding=1, default_qty_type=strategy.percent_of_equity, default_qty_value=100, commission_type=strategy.commission.percent, commission_value=0.025)

//Inputs
hullLen1 = input(title="Hull 1 length", type=input.integer, defval=29)
hullLen2 = input(title="Hull 2 length", type=input.integer, defval=2)
len = input(title="Length for DI", type=input.integer, defval=76)

//Calculations
TrueRange = max(max(high-low, abs(high-nz(close[1]))), abs(low-nz(close[1])))
DirectionalMovementPlus = high-nz(high[1]) > nz(low[1])-low ? max(high-nz(high[1]), 0): 0
DirectionalMovementMinus = nz(low[1])-low > high-nz(high[1]) ? max(nz(low[1])-low, 0): 0

SmoothedTrueRange = 0.0
SmoothedTrueRange := nz(SmoothedTrueRange[1]) - (nz(SmoothedTrueRange[1])/len) + TrueRange
SmoothedDirectionalMovementPlus = 0.0
SmoothedDirectionalMovementPlus := nz(SmoothedDirectionalMovementPlus[1]) - (nz(SmoothedDirectionalMovementPlus[1])/len) + DirectionalMovementPlus
SmoothedDirectionalMovementMinus = 0.0
SmoothedDirectionalMovementMinus := nz(SmoothedDirectionalMovementMinus[1]) - (nz(SmoothedDirectionalMovementMinus[1])/len) + DirectionalMovementMinus

//Indicators
fasthull = hma(close, hullLen1)
slowhull = hma(close, hullLen2)
DIPlus = SmoothedDirectionalMovementPlus / SmoothedTrueRange * 100
DIMinus = SmoothedDirectionalMovementMinus / SmoothedTrueRange * 100
DX = abs(DIPlus-DIMinus) / (DIPlus+DIMinus)*100
ADX = sma(DX, len)

//Plots
plot(DIPlus, color=color.green, title="DI+")
plot(DIMinus, color=color.red, title="DI-")
plot(ADX, color=color.black, title="ADX")

//conditions
go_long = crossover(DIPlus, DIMinus) and fasthull > slowhull //crossover(fasthull, slowhull) and DIPlus > DIMinus
go_short = crossover(DIMinus, DIPlus) and fasthull < slowhull //crossunder(fasthull, slowhull) and DIMinus > DIPlus

//Entry
if strategy.position_size < 0 or strategy.position_size == 0
    strategy.order("long", strategy.long, when=go_long)

if strategy.position_size > 0 or strategy.position_size == 0
    strategy.order("Short", strategy.short, when=go_short)