EMAとSMAのクロスオーバーに基づくトレンド反転戦略
作成日:
2024-01-04 17:59:04
最終変更日:
2024-01-04 17:59:04
コピー:
1
クリック数:
1473
1
フォロー
1750
フォロワー
概要
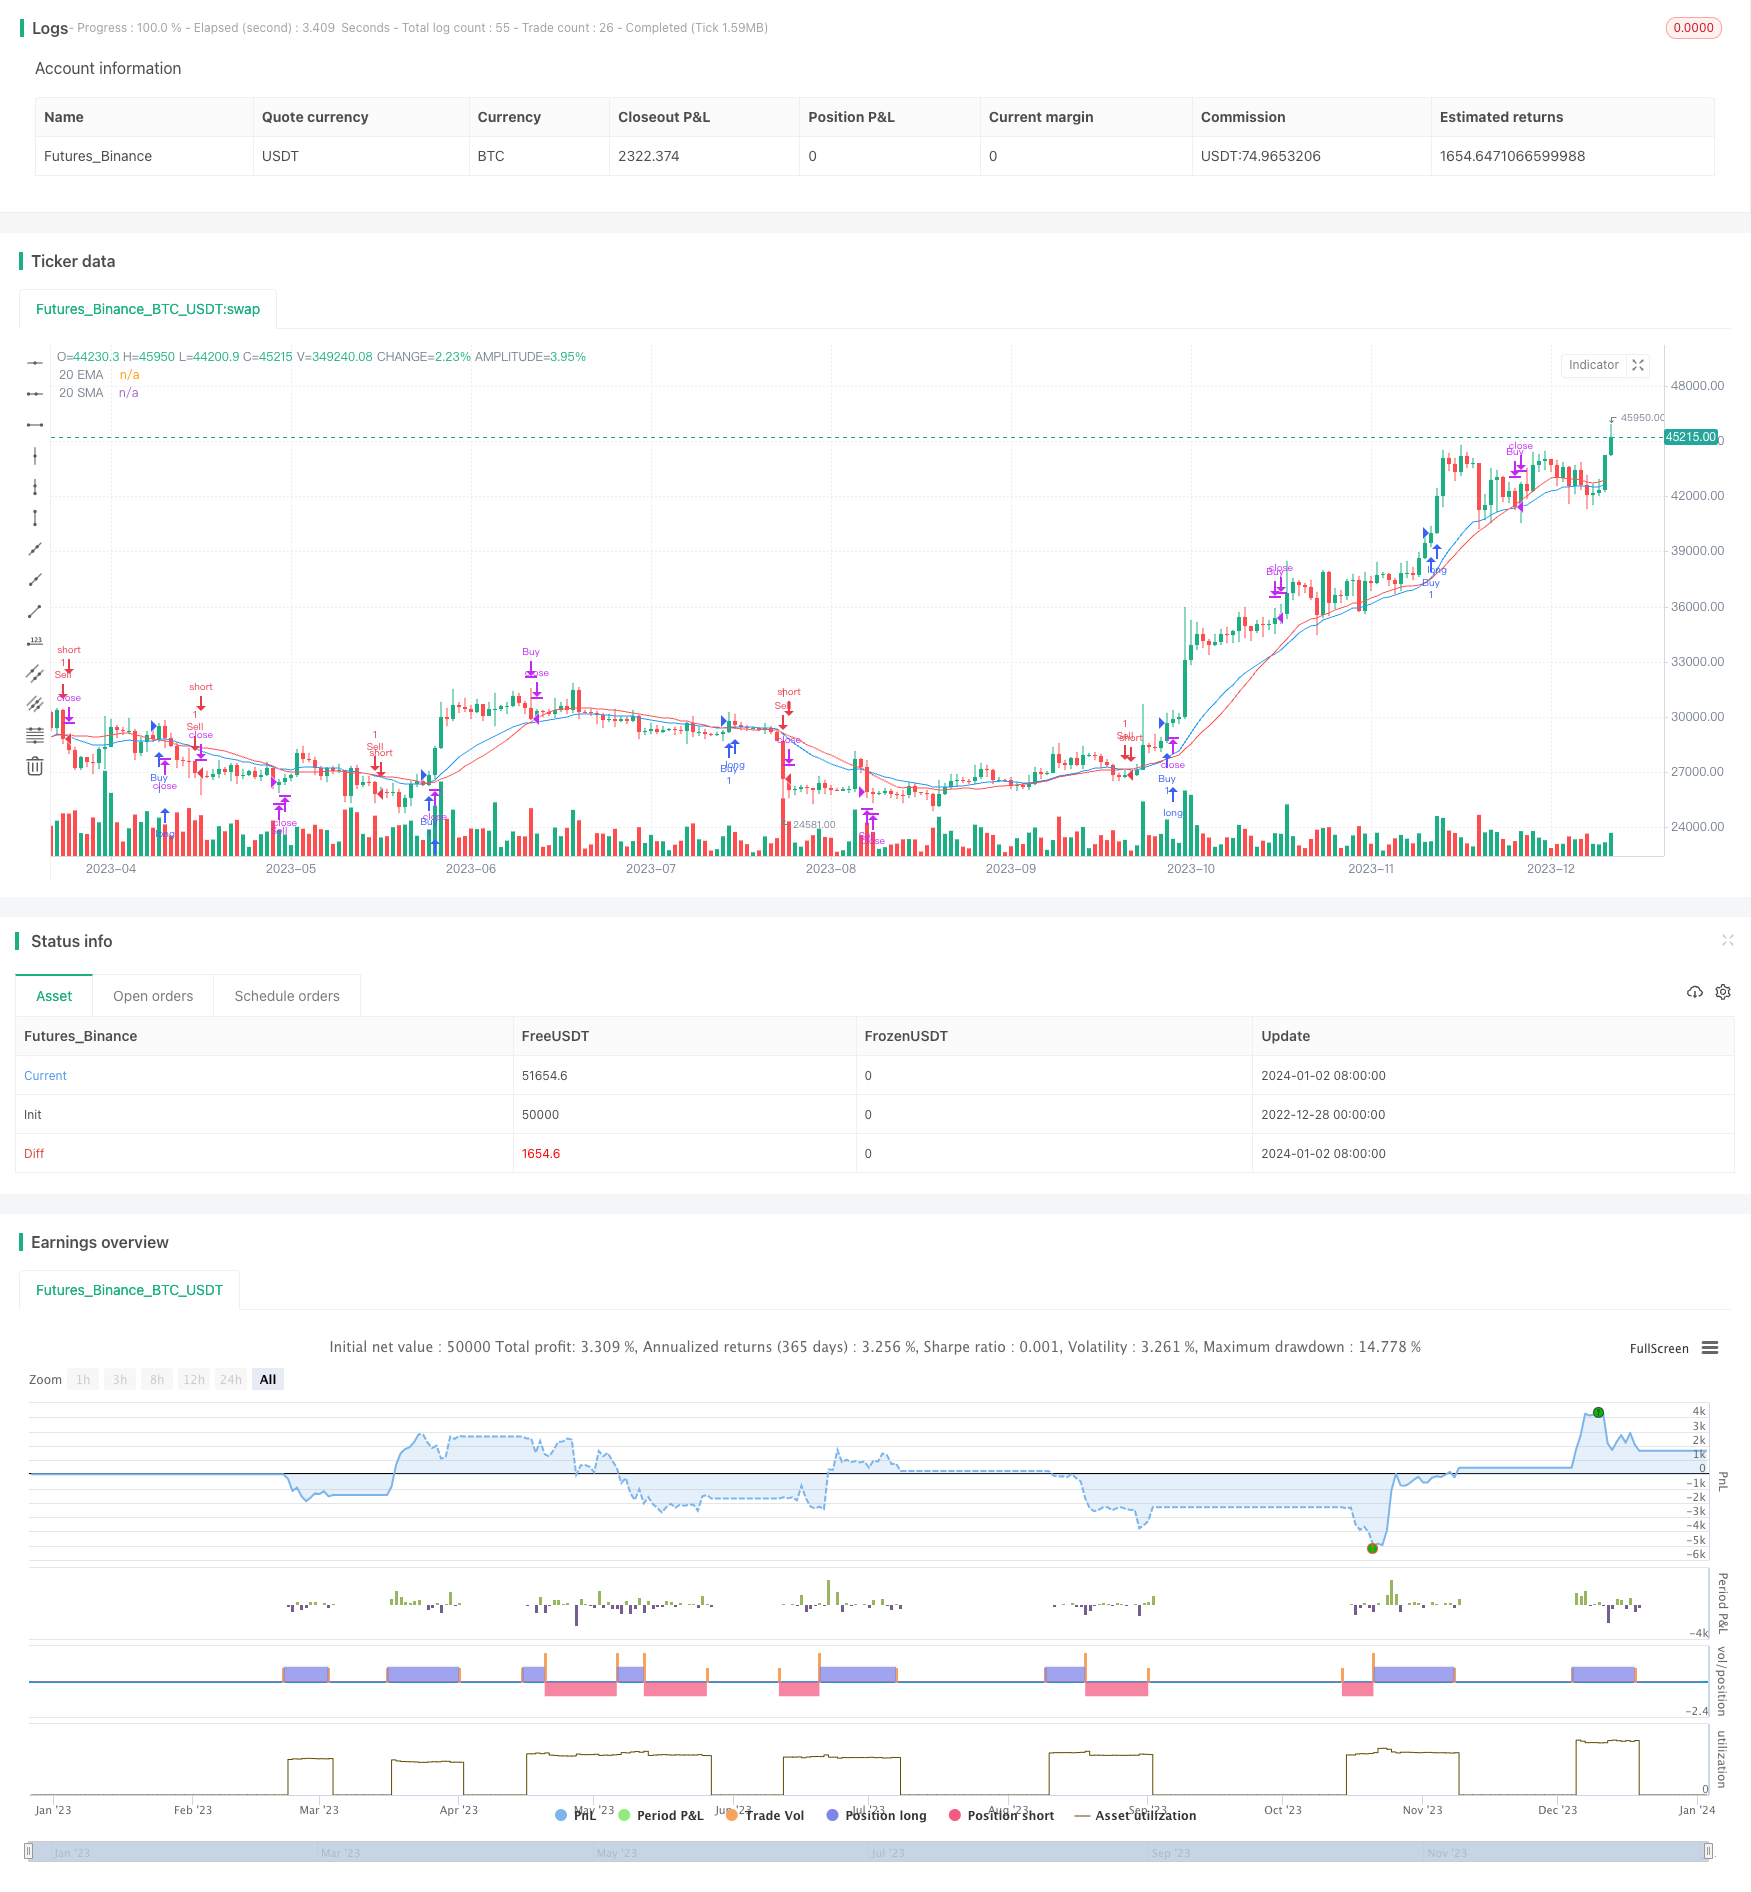
この戦略の目的は,20周期指数移動平均 ((EMA) と20周期単純な移動平均 ((SMA) の交差によって潜在的なトレンド転換点を識別することです.交差の方向に応じて,オーバーまたは空調の機会を決定します.
戦略原則
- 20周期EMAが20周期SMAを上から下を通過し,閉盘価格が20周期EMAより高いとき,多めにします.
- 20周期EMAが上下から20周期SMAを横断し,閉盘価格が20周期EMAより低いとき,空白する.
- オーバーオードの場合は,20周期EMAの下の20周期SMAを突破した時に平仓する.
- フォークの場合は,20周期EMAで20周期SMAを突破した時に平仓する.
この策略は,ta库のcrossoverとcrossunder関数を使用して均線の交差を検出する.
優位分析
この戦略は,移動平均のトレンド追跡機能と均線交差のシグナル生成を組み合わせて,以下の利点があります.
- 移動平均は,市場騒音の一部をフィルタリングし,中長期のトレンドを識別するのに有効です.
- 均線交差は操作が簡単で,市場動向の転換点を明確に判断できます.
- 20周期のパラメータ設定は,ほとんどの株式と時間周期に有効で,頻繁に調整する必要はありません.
- EMAとクローズアップ価格の関係を利用して,部分的な偽信号を回避した.
- 規則は明確でシンプルで,理解しやすく,実行可能で,低水準の投資家に適しています.
リスク分析
この戦略には以下のリスクもあります.
- 移動平均は後退しており,短期的な急激なトレンドの逆転を逃す可能性があります.
- 均線交差は,戦略の安定性を影響するノイズ信号を生じやすい.
- 固定20周期のパラメータ設定は,一部の株式にあまり適用されない可能性があり,調整が必要である.
- ストップダメージメカニズムがないと,単一の損失が大きくなる可能性があります.
対策として
- 平均線周期を適正に短縮して反応速度を加速する.
- フィルタリング条件を追加し,偽信号を回避する.
- パラメータと株のカテゴリーをテストし,最適化します.
- リスク管理のための ストップ・ローズ・メソッドの導入
最適化の方向
この戦略は,以下の点で最適化できます.
- 取引量,RSIなどの指標を追加して,複合戦略を構築する.
- 平均線周期と取引品種のテスト最適化,自己適応パラメータの設定.
- トレンドトラッキングストップ,タイムストップなどのダイナミックな退出メカニズムを構築する.
- アルゴリズムによる取引機能に追加し,自動取引を実現する.
- 機械学習のアルゴリズムを追加し,戦略の自己適応と最適化を可能にします.
要約する
この戦略は,全体的に比較的シンプルで実用的で,均線交差理論を適用して潜在的トレンドの逆転点を識別することは,一般的なかつ有効な戦略考え方である.しかし,他の技術指標,動的パラメータ設定,ストップオフ方法,およびアルゴリズム取引などの方法を追加することで,戦略を非モニタブルで正確で信頼性があり,自動化することができます.全体的に,この戦略は,量化取引の門戸に優れた考え方とテンプレートを提供しています.
ストラテジーソースコード
/*backtest
start: 2022-12-28 00:00:00
end: 2024-01-03 00:00:00
period: 1d
basePeriod: 1h
exchanges: [{"eid":"Futures_Binance","currency":"BTC_USDT"}]
*/

//@version=5
strategy("EMA-SMA Crossover Strategy", overlay=true)

// Define the length of the moving averages
emaLength = 20
smaLength = 20

// Calculate moving averages
emaValue = ta.ema(close, emaLength)
smaValue = ta.sma(close, smaLength)

// Buy condition
buyCondition = ta.crossover(emaValue, smaValue) and close > emaValue

// Short sell condition
sellCondition = ta.crossunder(emaValue, smaValue) and close < emaValue

// Exit conditions for both Buy and Short sell
exitBuyCondition = ta.crossunder(emaValue, smaValue)
exitSellCondition = ta.crossover(emaValue, smaValue)

// Strategy logic
if (buyCondition)
    strategy.entry("Buy", strategy.long)

if (sellCondition)
    strategy.entry("Sell", strategy.short)

if (exitBuyCondition)
    strategy.close("Buy")

if (exitSellCondition)
    strategy.close("Sell")

// Plot the moving averages
plot(emaValue, color=color.blue, title="20 EMA")
plot(smaValue, color=color.red, title="20 SMA")