移動平均マルチタイムスケールクロスオーバー最適化戦略
作成日:
2024-01-05 12:05:42
最終変更日:
2024-01-05 12:05:42
コピー:
2
クリック数:
898
1
フォロー
1750
フォロワー
概要
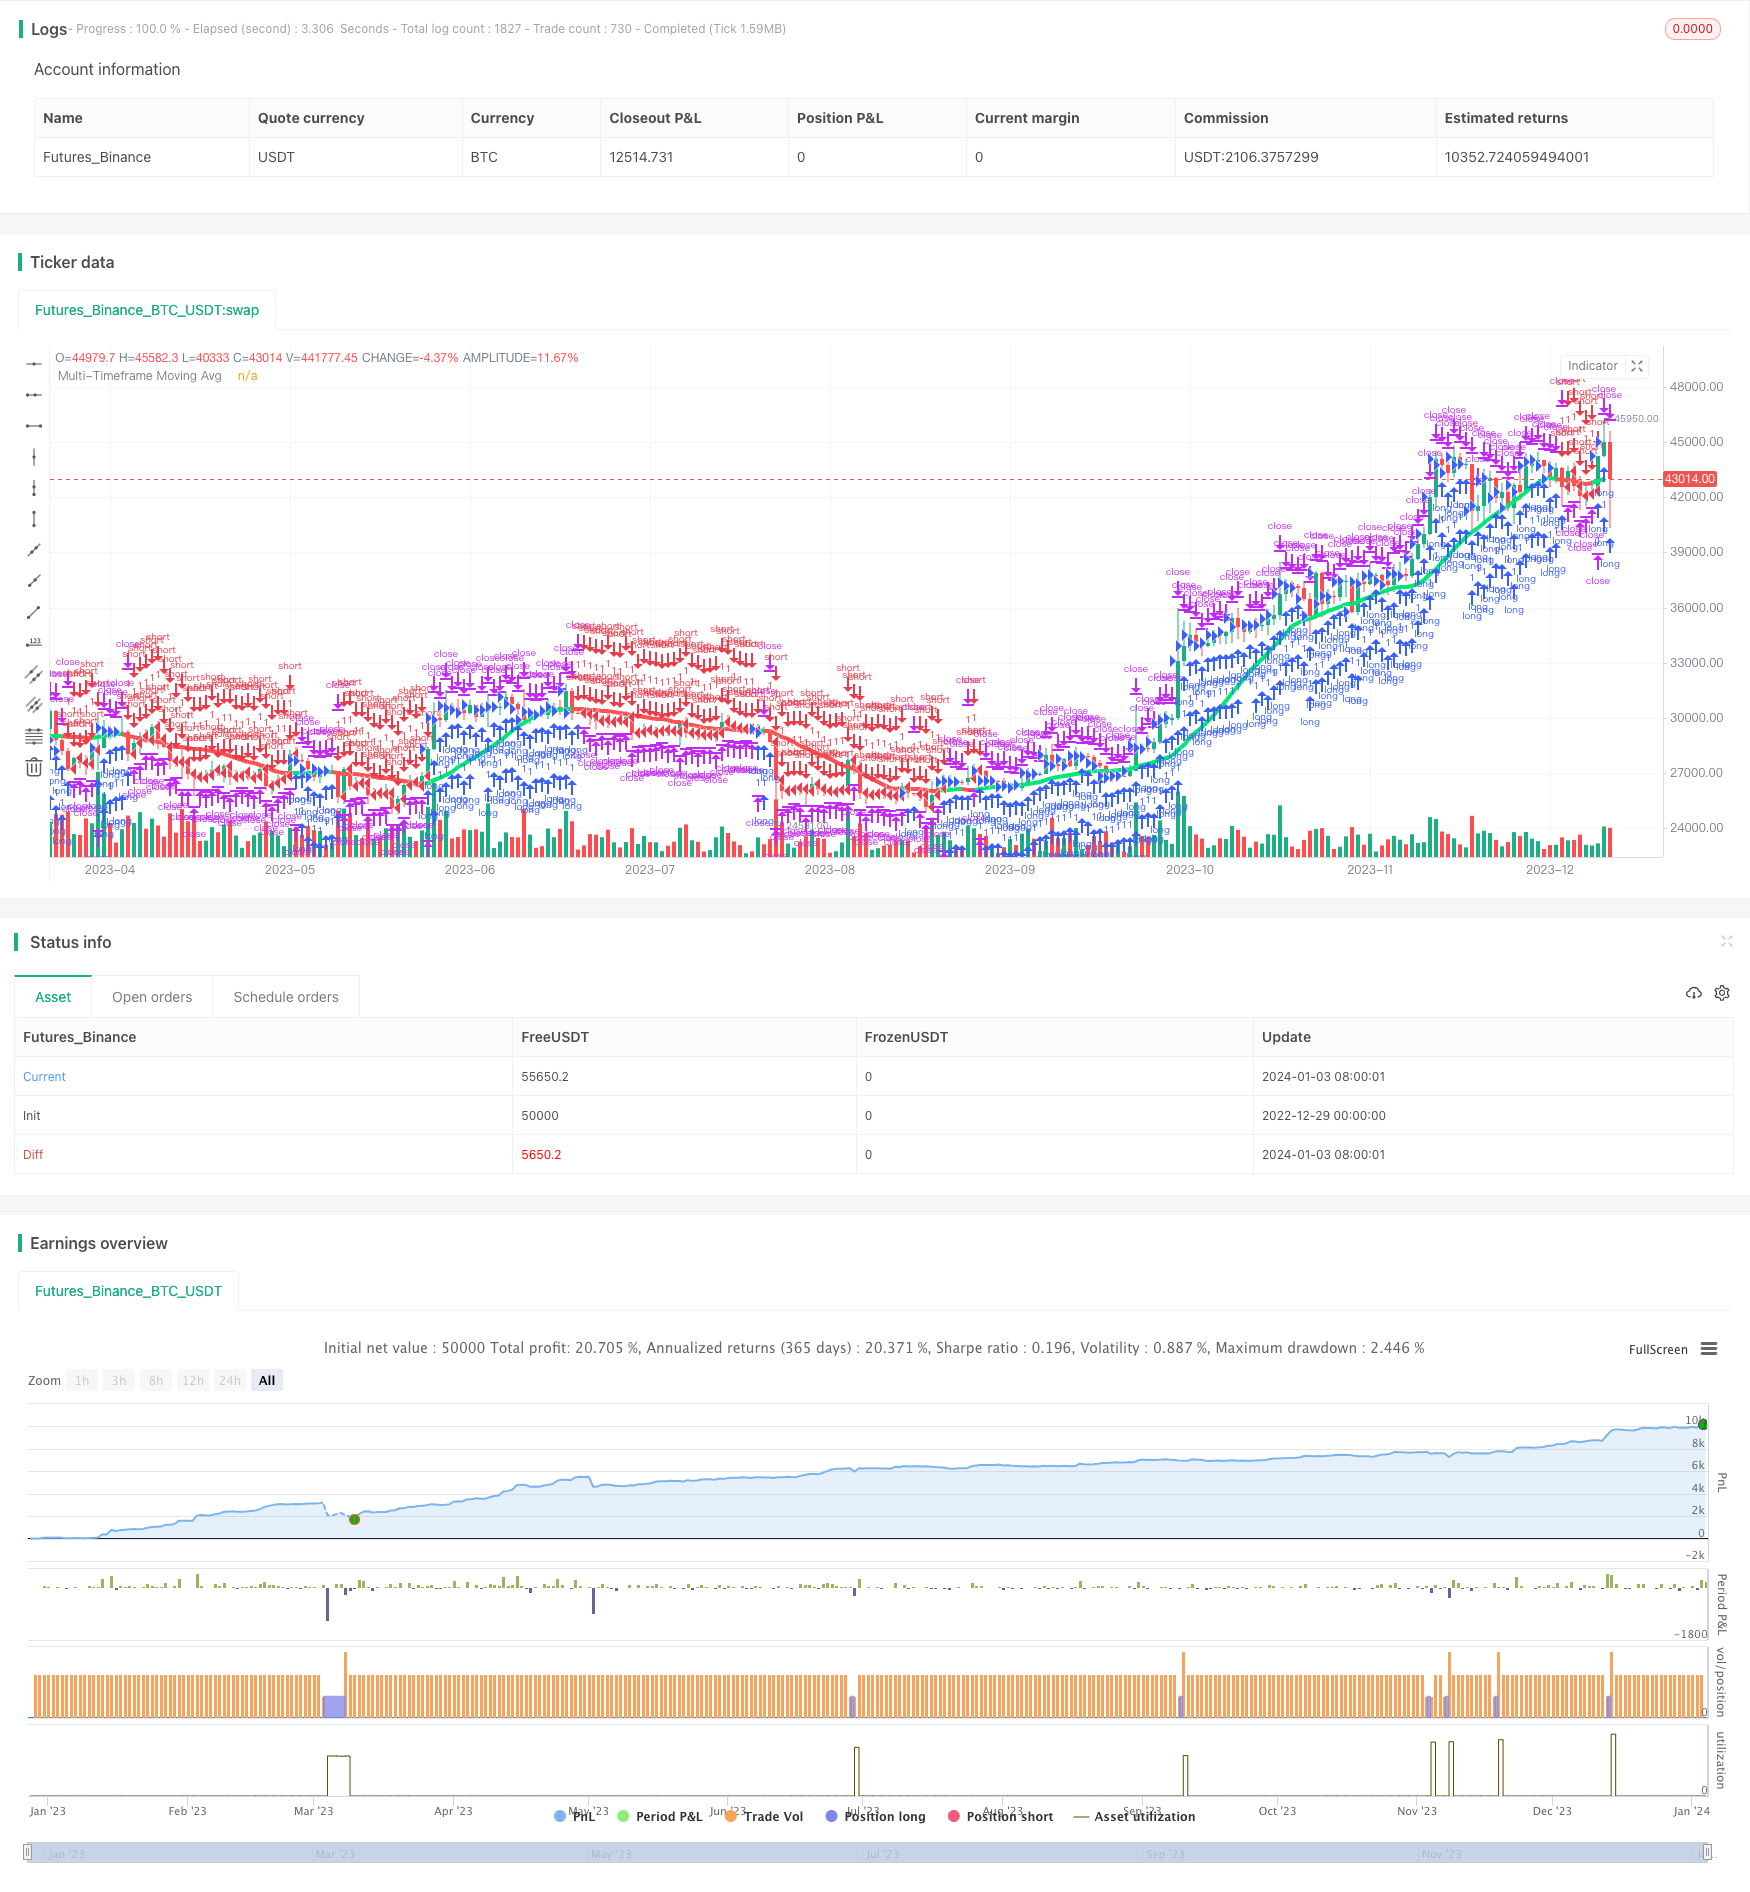
この策略は,有名な指標CM_Ultimate_MA_MTFの改写に基づいています.移動平均を複数の時間尺度で描画し,異なる時間周期MAの交差操作を実現します.策略は,同時にストップ・ロスを追跡する機能を持っています.
戦略原則
- ユーザの選択に応じて,異なるタイプのMA指標によって,主図周期およびより高い周期でMA線をそれぞれ描画する.
- 速周期MA線が遅周期MA線を横切るときは,多行;速周期MA線の下が遅周期MA線を横切るときは空行.
- リスクの管理をさらに進めるため,追跡可能なストップ・メカニズムを追加しました.
優位分析
- 多時間尺度MA交差は,信号品質を向上させ,偽信号を減少させる.
- 異なるタイプのMAの組み合わせは,それぞれの指標の優位性を発揮し,安定性を高めます.
- ストップトラッキングは,早期にストップして,大きな損失の確率を減らすのに役立ちます.
リスク分析
- MA指数は遅れているので,ショートライン操作の機会を逃す可能性があります.
- MA周期パラメータを適切に最適化する必要がある.そうでなければ,過剰な偽信号が生成される可能性がある.
- ストップポイントの不合理な設定は,不必要なストップダメージを引き起こす可能性があります.
最適化の方向
- 異なるパラメータのMA組み合わせをテストし,最適なパラメータを探します.
- 信号の質を向上させるため,他の指標のフィルターを追加できます.
- 市場特性に合わせて,ストップ・ロスの戦略を最適化できます.
要約する
この戦略は,移動平均の多時間枠分析とストップ・ロスを追跡する方法を統合し,信号の質を向上させ,リスクレベルを制御することを目的としています.パラメータの最適化と他の指標の追加により,戦略の効果をさらに高めることができます.
ストラテジーソースコード
/*backtest
start: 2022-12-29 00:00:00
end: 2024-01-04 00:00:00
period: 1d
basePeriod: 1h
exchanges: [{"eid":"Futures_Binance","currency":"BTC_USDT"}]
*/

//@version=2

strategy(title = "Ultimate Moving Average Strategy", shorttitle = "UMA Strategy", overlay = true)

//Created by user ChrisMoody 4-24-2014
//Converted to strategy by Virtual_Machinist 7-11-2018
//Plots The Majority of Moving Averages
//Defaults to Current Chart Time Frame --- But Can Be Changed to Higher Or Lower Time Frames
//2nd MA Capability with Show Crosses Feature

//inputs
src = close
useCurrentRes = input(true, title="Use Current Chart Resolution?")
resCustom = input(title="Use Different Timeframe? Uncheck Box Above",  defval="D")
len = input(20, title="Moving Average Length - LookBack Period")
atype = input(1,minval=1,maxval=7,title="1=SMA, 2=EMA, 3=WMA, 4=HullMA, 5=VWMA, 6=RMA, 7=TEMA")
cc = input(true,title="Change Color Based On Direction?")
smoothe = input(2, minval=1, maxval=10, title="Color Smoothing - 1 = No Smoothing")
doma2 = input(false, title="Optional 2nd Moving Average")
len2 = input(50, title="Moving Average Length - Optional 2nd MA")
atype2 = input(1,minval=1,maxval=7,title="1=SMA, 2=EMA, 3=WMA, 4=HullMA, 5=VWMA, 6=RMA, 7=TEMA")
cc2 = input(true,title="Change Color Based On Direction 2nd MA?")
warn = input(false, title="***You Can Turn On The Show Dots Parameter Below Without Plotting 2nd MA to See Crosses***")
warn2 = input(false, title="***If Using Cross Feature W/O Plotting 2ndMA - Make Sure 2ndMA Parameters are Set Correctly***")
sd = input(false, title="Show Dots on Cross of Both MA's")

useStop     = input(defval = true, title = "Use Trailing Stop?")
slPoints    = input(defval = 200, title = "Stop Loss Trail Points", minval = 1)
slOffset    = input(defval = 400, title = "Stop Loss Trail Offset", minval = 1)

res = useCurrentRes ? timeframe.period : resCustom
//hull ma definition
hullma = wma(2*wma(src, len/2)-wma(src, len), round(sqrt(len)))
//TEMA definition
ema1 = ema(src, len)
ema2 = ema(ema1, len)
ema3 = ema(ema2, len)
tema = 3 * (ema1 - ema2) + ema3

avg = atype == 1 ? sma(src,len) : atype == 2 ? ema(src,len) : atype == 3 ? wma(src,len) : atype == 4 ? hullma : atype == 5 ? vwma(src, len) : atype == 6 ? rma(src,len) : tema
//2nd Ma - hull ma definition
hullma2 = wma(2*wma(src, len2/2)-wma(src, len2), round(sqrt(len2)))
//2nd MA TEMA definition
sema1 = ema(src, len2)
sema2 = ema(sema1, len2)
sema3 = ema(sema2, len2)
stema = 3 * (sema1 - sema2) + sema3

avg2 = atype2 == 1 ? sma(src,len2) : atype2 == 2 ? ema(src,len2) : atype2 == 3 ? wma(src,len2) : atype2 == 4 ? hullma2 : atype2 == 5 ? vwma(src, len2) : atype2 == 6 ? rma(src,len2) : tema

out = avg
out_two = avg2

out1 = request.security(syminfo.tickerid, res, out)
out2 = request.security(syminfo.tickerid, res, out_two)

ma_up = out1 >= out1[smoothe]
ma_down = out1 < out1[smoothe]

col = cc ? ma_up ? lime : ma_down ? red : aqua : aqua
col2 = cc2 ? ma_up ? lime : ma_down ? red : aqua : aqua

circleYPosition = out2

plot(out1, title="Multi-Timeframe Moving Avg", style=line, linewidth=4, color = col)
plot(doma2 and out2 ? out2 : na, title="2nd Multi-TimeFrame Moving Average", style=circles, linewidth=4, color=col2)
plot(sd and cross(out1, out2) ? circleYPosition : na,style=cross, linewidth=5, color=yellow)

// Strategy conditions

longCond    = ma_up
shortCond   = ma_down
// entries and base exit
strategy.entry("long", strategy.long, when = longCond)
strategy.entry("short", strategy.short, when = shortCond)

if (useStop)
    strategy.exit("XL", from_entry = "long", trail_points = slPoints, trail_offset = slOffset)
    strategy.exit("XS", from_entry = "short", trail_points = slPoints, trail_offset = slOffset)
// not sure needed, but just incase..
strategy.exit("XL", from_entry = "long", when = shortCond)
strategy.exit("XS", from_entry = "short", when = longCond)