一目均衡表クラウド定量取引戦略
作成日:
2024-01-05 13:53:11
最終変更日:
2024-01-05 13:53:11
コピー:
0
クリック数:
641
1
フォロー
1750
フォロワー
概要
この戦略は,曲線,日K線,ハル移動平均,MACD指標などの複数の指標を統合して,長短多空の意思決定機構を構築し,自動取引を実現する.
戦略原則
イチモク雲帯の変換線と遅延線に基づいて多空取引信号を構築する.ハル移動平均と組み合わせてトレンドの方向を判断する.また,MACD指標を使用して長短のペースを判断する.日内K線を判断して入場信号として突破する.
変換線は近9日間の中値平均である。延期線は近26日間の中値平均である。変換線上での延期線を通るときは,多めにする。変換線下での延期線を通るときは,空いてする。
ハル移動平均は,二重平均の交差によってトレンドを判断し,速線が遅線を横断すると,上昇傾向として判断する.逆に,ダンは下降傾向として判断する.
MACDは,12と26の指数移動平均差値を取り,ゼロ軸と平均線の金叉死叉によって多空判断する.
日中のK線が遅延線を突破して入場時間となる.
戦略的優位性
- 複数の指標を統合して,トレンドの方向を正確に判断する.
- 選択を慎重にし,無駄な取引を避ける.
- 危険を制御し,停止停止装置を設置する.
戦略リスク
- パラメータを正しく設定しない場合,過激なエントリーが発生する可能性があります.
- 複数の指標の組み合わせにより,戦略的複雑性が増加する.
- ショートライン操作は必ず撤回される.
戦略の最適化
- パラメータの組み合わせを調整して,より多くの品種と周期に対応します.
- 機械学習モジュールが追加され,パラメータ自在化が可能となる.
- 試合開始の動力指標を最適化し,勝率を向上させる.
要約する
この戦略は,イチモク雲帯など複数の指標信号を組み合わせて,完全な量化意思決定システムを構築する. 厳格な止損停止メカニズムが取引リスクを制御する. 参数調整とモデルの最適化により,より多くの取引品種に適応し,広範囲のアプリケーションの見通しがある.
ストラテジーソースコード
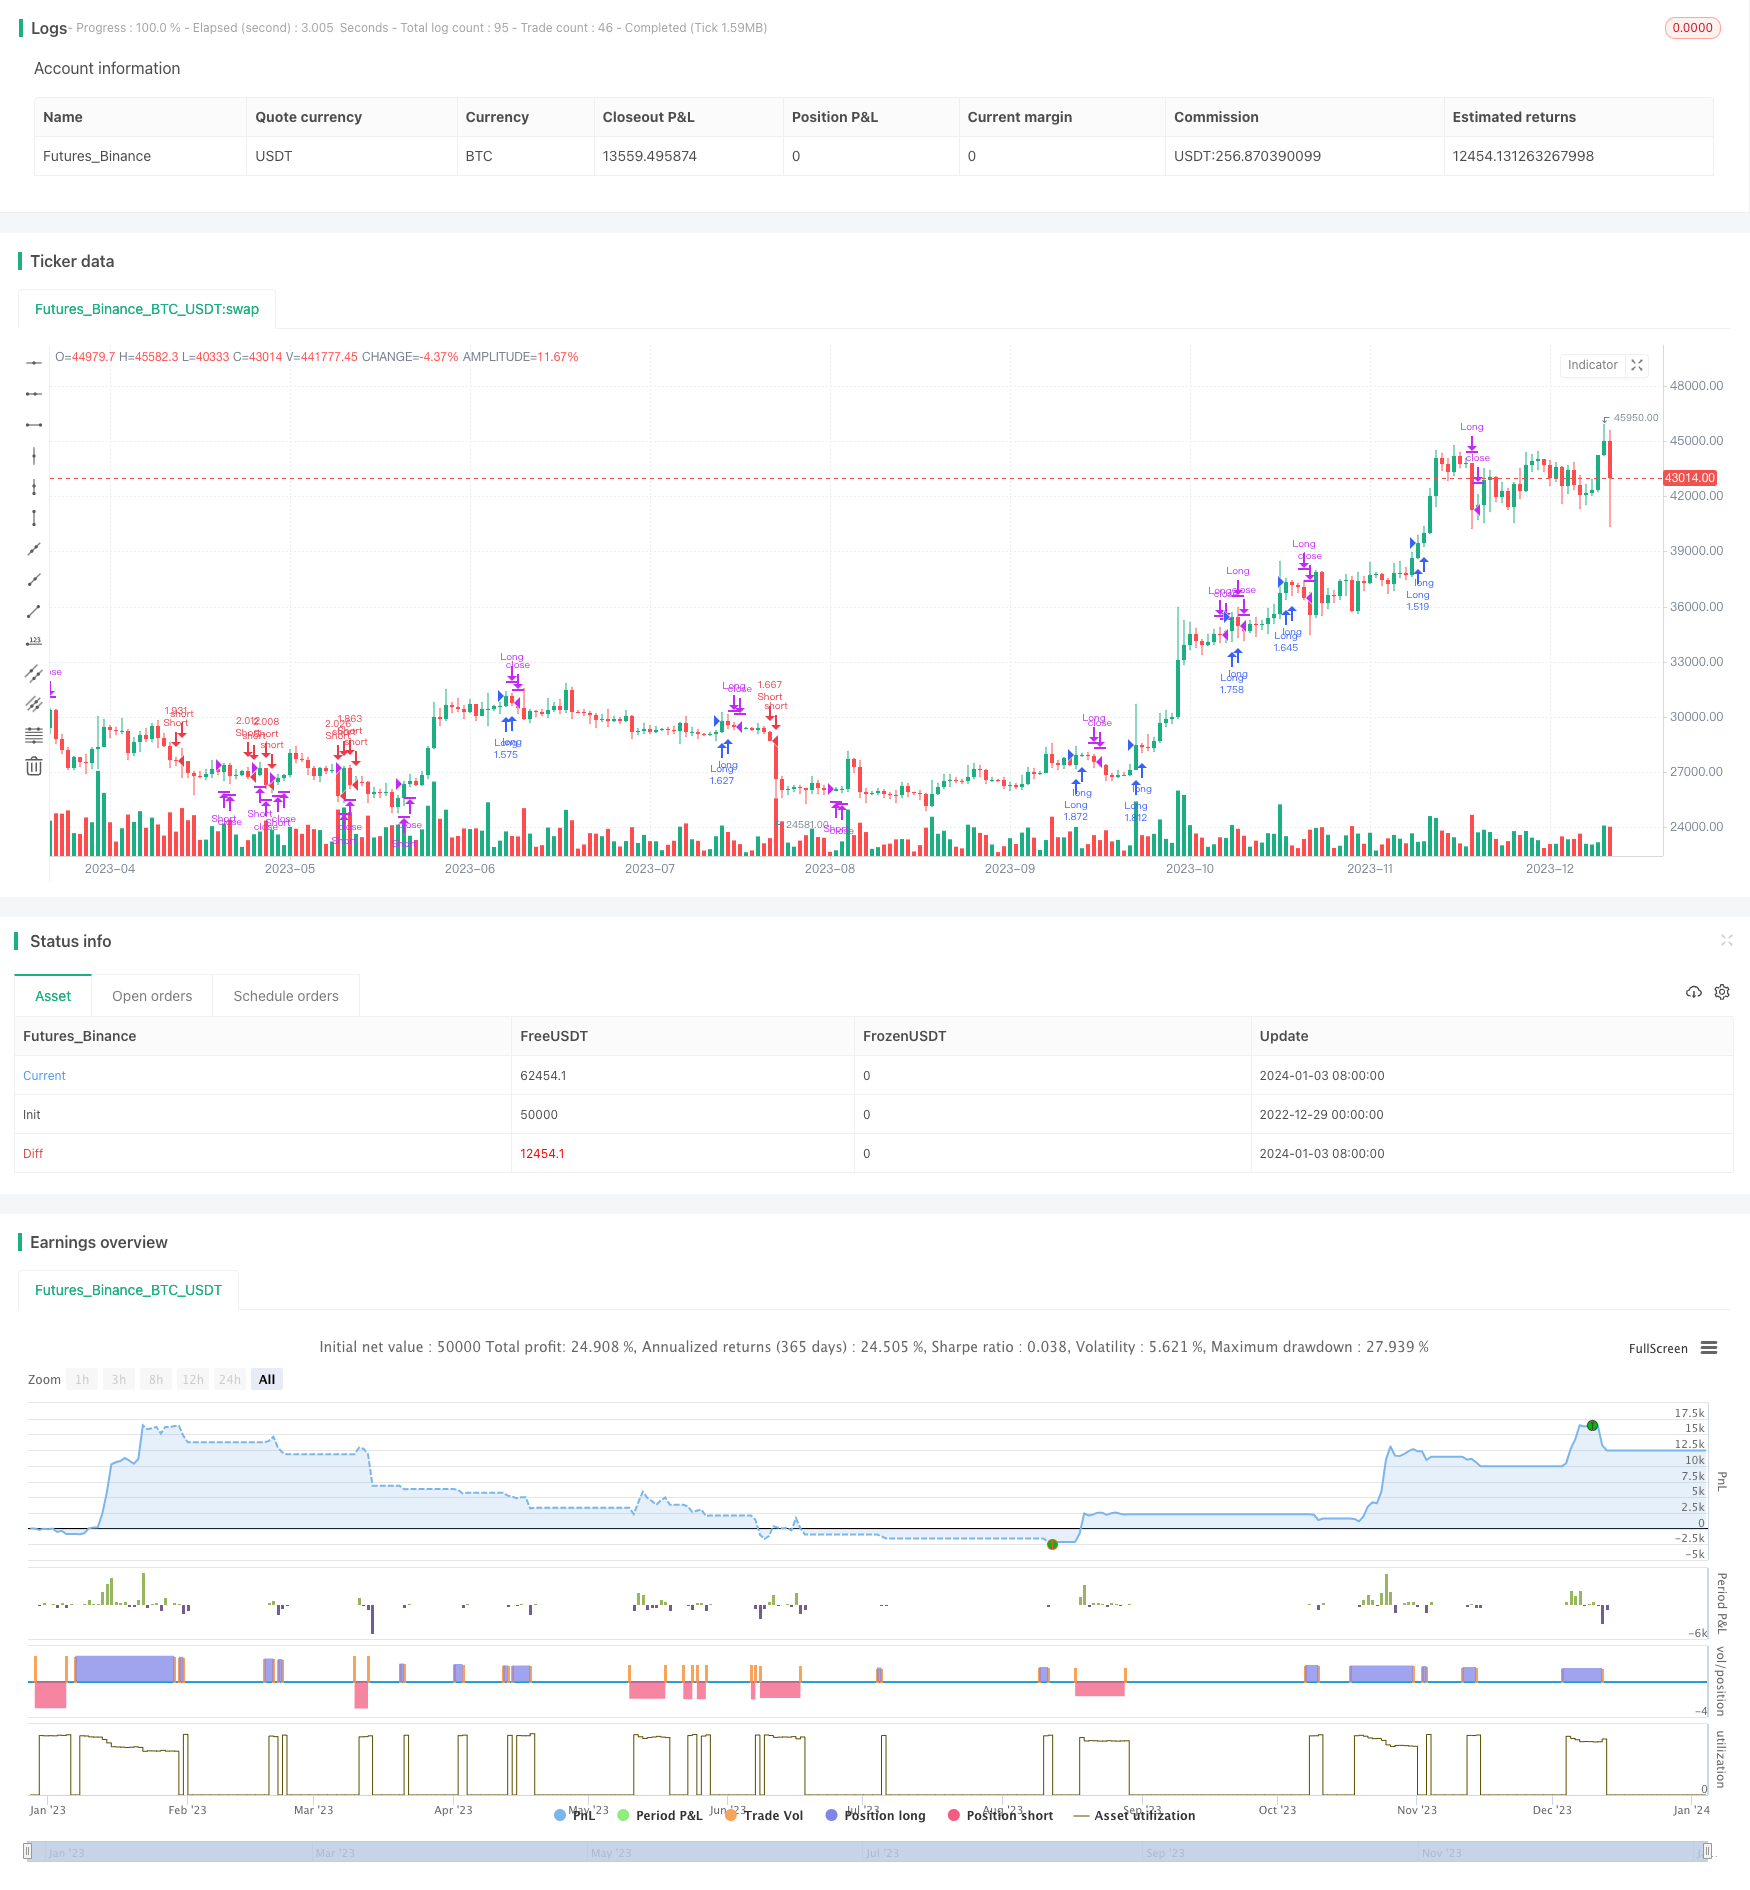
/*backtest
start: 2022-12-29 00:00:00
end: 2024-01-04 00:00:00
period: 1d
basePeriod: 1h
exchanges: [{"eid":"Futures_Binance","currency":"BTC_USDT"}]
*/

//@version=2
// Any timeFrame ok but good on 15 minute & 60 minute , Ichimoku + Daily-Candle_cross(DT) + HULL-MA_cross + MacD combination 420 special blend
strategy("Ichimoku + Daily-Candle_X + HULL-MA_X + MacD", shorttitle="٩(̾●̮̮̃̾•̃̾)۶", overlay=true, default_qty_type=strategy.percent_of_equity, max_bars_back=720, default_qty_value=100, calc_on_order_fills= true, calc_on_every_tick=true, pyramiding=0)
keh=input(title="Double HullMA",defval=14, minval=1)
dt = input(defval=0.0010, title="Decision Threshold (0.001)", type=float, step=0.0001)
SL = input(defval=-500.00, title="Stop Loss in $", type=float, step=1)
TP = input(defval=25000.00, title="Target Point in $", type=float, step=1)
ot=1
n2ma=2*wma(close,round(keh/2))
nma=wma(close,keh)
diff=n2ma-nma
sqn=round(sqrt(keh))
n2ma1=2*wma(close[1],round(keh/2))
nma1=wma(close[1],keh)
diff1=n2ma1-nma1
sqn1=round(sqrt(keh))
n1=wma(diff,sqn)
n2=wma(diff1,sqn)
b=n1>n2?lime:red
c=n1>n2?green:red
d=n1>n2?red:green
confidence=(request.security(syminfo.tickerid, 'D', close)-request.security(syminfo.tickerid, 'D', close[1]))/request.security(syminfo.tickerid, 'D', close[1])
conversionPeriods = input(9, minval=1, title="Conversion Line Periods")
basePeriods = input(26, minval=1, title="Base Line Periods")
laggingSpan2Periods = input(52, minval=1, title="Lagging Span 2 Periods")
displacement = input(26, minval=1, title="Displacement")
donchian(len) => avg(lowest(len), highest(len))
conversionLine = donchian(conversionPeriods)
baseLine = donchian(basePeriods)
leadLine1 = avg(conversionLine, baseLine)
leadLine2 = donchian(laggingSpan2Periods)
LS=close, offset = -displacement
MACD_Length = input(9)
MACD_fastLength = input(12)
MACD_slowLength = input(26)
MACD = ema(close, MACD_fastLength) - ema(close, MACD_slowLength)
aMACD = ema(MACD, MACD_Length)
closelong = n1<n2 and close<n2 and confidence<dt or strategy.openprofit<SL or strategy.openprofit>TP
if (closelong)
    strategy.close("Long")
closeshort = n1>n2 and close>n2 and confidence>dt or strategy.openprofit<SL or strategy.openprofit>TP
if (closeshort)
    strategy.close("Short")
longCondition = n1>n2 and strategy.opentrades<ot and confidence>dt and close>n2 and leadLine1>leadLine2 and open<LS and MACD>aMACD
if (longCondition)
    strategy.entry("Long",strategy.long)
shortCondition = n1<n2 and strategy.opentrades<ot and confidence<dt and close<n2 and leadLine1<leadLine2 and open>LS and MACD<aMACD
if (shortCondition)
    strategy.entry("Short",strategy.short)//                         /L'-,
//                               ,'-.           /MM . .             /  L '-,
//     .                    _,--dMMMM\         /MMM  `..           /       '-,
//     :             _,--,  )MMMMMMMMM),.      `QMM   ,<>         /_      '-,'
//     ;     ___,--. \MM(    `-'   )M//MM\       `  ,',.;      .-'* ;     .'
//     |     \MMMMMM) \MM\       ,dM//MMM/     ___ < ,; `.      )`--'    /
//     |      \MM()M   MMM)__   /MM(/MP'  ___, \  \ `  `. `.   /__,    ,'
//     |       MMMM/   MMMMMM( /MMMMP'__, \     | /      `. `-,_\     /
//     |       MM     /MMM---' `--'_ \     |-'  |/         `./ .\----.___
//     |      /MM'   `--' __,-  \""   |-'  |_,               `.__) . .F. )-.
//     |     `--'       \   \    |-'  |_,     _,-/            J . . . J-'-. `-.,
//     |         __  \`. |   |   |         \    / _           |. . . . \   `-.  F
//     |   ___  /  \  | `|   '      __  \   |  /-'            F . . . . \     '`
//     |   \  \ \  /  |        __  /  \  |  |,-'        __,- J . . . . . \
//     |    | /  |/     __,-  \  ) \  /  |_,-     __,--'     |. .__.----,'
//     |    |/    ___     \    |'.  |/      __,--'           `.-;;;;;;;;;\
//     |     ___  \  \     |   |  `   __,--'                  /;;;;;;;;;;;;.
//     |     \  \  |-'\    '    __,--'                       /;;;;;;;;;;;;;;\
// \   |      | /  |      __,--'                             `--;;/     \;-'\
//  \  |      |/    __,--'                                   /  /         \  \
//   \ |      __,--'                                        /  /           \  \
//    \|__,--'                                          _,-;M-K,           ,;-;\
//                                                     <;;;;;;;;           '-;;;;
//a1=plot(n1,color=c)
//a2=plot(n2,color=c)
//plot(cross(n1, n2) ? n1 : na, style = circles, color=b, linewidth = 4)
//plot(cross(n1, n2) ? n1 : na, style = line, color=d, linewidth = 4)
//plot(conversionLine, color=#0496ff, title="Conversion Line")
//plot(baseLine, color=#991515, title="Base Line")
//plot(close, offset = -displacement, color=#459915, title="Lagging Span")
//p1=plot (leadLine1, offset = displacement, color=green,  title="Lead 1")
//p2=plot (leadLine2, offset = displacement, color=red,  title="Lead 2")
//fill(p1, p2, color = leadLine1 > leadLine2 ? green : red)
// remove the "//" from before the plot script if want to see the indicators on chart