平均真の範囲に基づくトレンドフォロー戦略
作成日:
2024-01-05 16:28:48
最終変更日:
2024-01-05 16:28:48
コピー:
1
クリック数:
724
1
フォロー
1750
フォロワー
概要
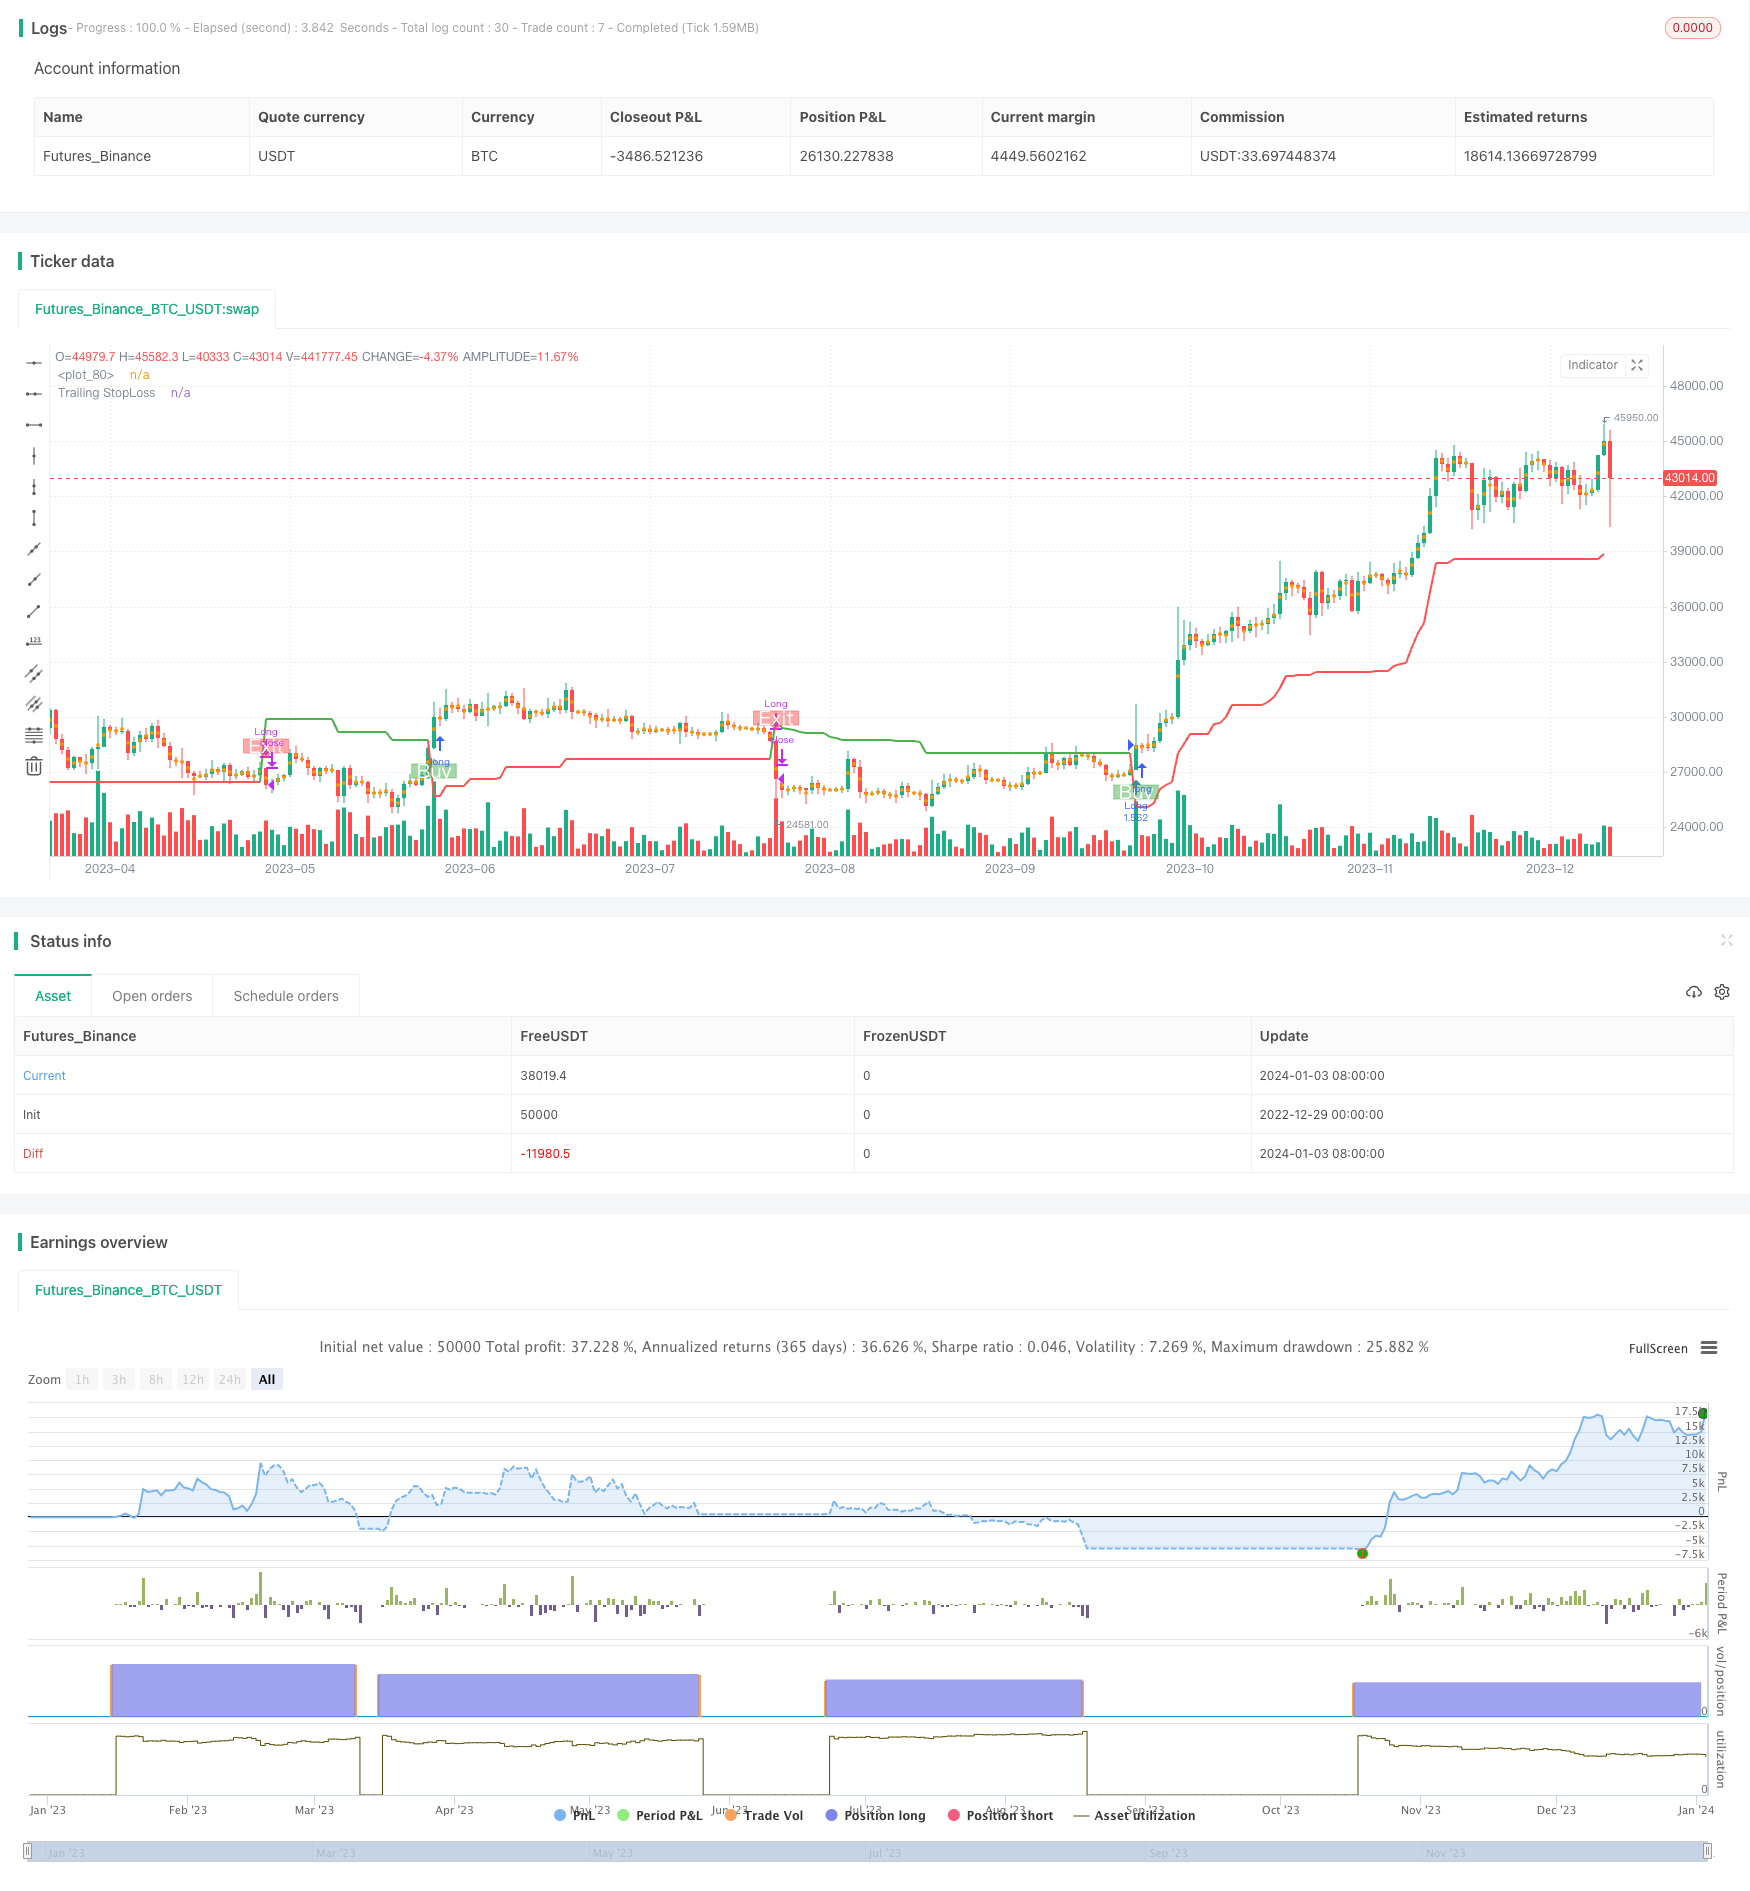
この戦略は,平均真波幅 ((ATR) に基づくトレンド追跡戦略である.これは,指数値を計算するためにATRを使用し,価格のトレンド方向を判断する.この戦略は,リスク管理のためのストップダストメカニズムを提供する.
戦略原則
この戦略は,周期Period,倍数Multiplier,出入り点Entry/Exit Pointの3つの主要なパラメータを使用しています. 既定のパラメータは14サイクルATRと4倍倍数です.
この戦略は,まず多頭平均価格 (buyavg) と空頭平均価格 (sellavg) を計算し,次に価格とこれらの2つの均等価格の関係を比較して,現在のトレンド方向を判断する.価格が空頭平均価格より高い場合は多頭として判断し,価格が多頭平均価格より低い場合は空頭として判断する.
さらに,この戦略はATRと組み合わせて,追跡ストップを設定する.具体的には,ATRの14サイクル重力移動平均を,ストップ距離として1倍に掛けることである.これは,市場の変動程度に応じてストップ距離を調整することができる.
ストップ・ロスが発動すると,この戦略は利潤を平準化します.
戦略的優位性
- トレンドを判断し,順調に,継続的に利益を得ることができる
- ATRの動的な止損距離調整により,リスクを効果的に制御できます.
- ポイントの計算はシンプルで直接的で,分かりやすい.
リスクと対策
- 傾向が変化すれば,大きな損失が起こり得る
- ATR周期と倍数を適切に調整し,停止距離を最適化する
- WILLは地震で数回小規模な損失を被った.
- フィルタリング条件を増やして 市場を揺るがさないこと
- パラメータを正しく設定しない場合, 策略がうまく機能しない可能性があります.
- 多組み合わせパラメータ最適化テスト,最適パラメータを見つける
戦略最適化の方向性
- 他の指標を足してフィルター信号を判断し,震動の状況で出場を避ける
- ATR周期と倍数パラメータを最適化して,止損距離を合理化する
- 市場状況に応じてポジションの大きさを調整する,開設ポジションのコントロールを追加
要約する
この戦略は,全体として,シンプルで実用的なトレンド追跡戦略である.これは,ごく少数のパラメータだけで実現可能であり,ATRによって動的に止損を調整し,リスクを効果的に制御することができる.他の補助判断指標と組み合わせれば,さらに最適化され,いくつかのノイズ信号をフィルターすることができます.全体として,この戦略は,トレンド追跡戦略を学びたい人のために適しています.
ストラテジーソースコード
/*backtest
start: 2022-12-29 00:00:00
end: 2024-01-04 00:00:00
period: 1d
basePeriod: 1h
exchanges: [{"eid":"Futures_Binance","currency":"BTC_USDT"}]
*/

//@version=5
strategy('Trend Strategy by zdmre', shorttitle='Trend Strategy', overlay=true, pyramiding=0, currency=currency.USD, default_qty_type=strategy.percent_of_equity, initial_capital=10000, default_qty_value=100, commission_type=strategy.commission.percent, commission_value=0.005)
show_STOPLOSSprice = input(true, title='Show TrailingSTOP Prices')
src = input(close, title='Source')
out2 = ta.ema(src, 20)

buyavg = (close + high) / 2.02 - high * (1 - open / close) * (1 - low * open / (high * close))
sellavg = ((low + close) / 1.99 + low * (1 - low / open) * (1 - low * open / (close * high)) / 1.1 + out2 )/ 2

// === INPUT BACKTEST RANGE ===
fromMonth = input.int(defval=1, title='From Month', minval=1, maxval=12)
fromDay = input.int(defval=1, title='From Day', minval=1, maxval=31)
fromYear = input.int(defval=2021, title='From Year', minval=1970)
thruMonth = input.int(defval=1, title='Thru Month', minval=1, maxval=12)
thruDay = input.int(defval=1, title='Thru Day', minval=1, maxval=31)
thruYear = input.int(defval=2100, title='Thru Year', minval=1970)

// === INPUT SHOW PLOT ===
showDate = input(defval=true, title='Show Date Range')

// === FUNCTION EXAMPLE ===
start = timestamp(fromYear, fromMonth, fromDay, 00, 00)  // backtest start window
finish = timestamp(thruYear, thruMonth, thruDay, 23, 59)  // backtest finish window
window() => true


// === TRAILING STOP LOSS === //

ATR_Period = input(14)
ATR_Mult = input(4.0)
var float ATR_TrailSL = na
var int pos = na
atr = ta.rma (ta.tr(true), 14)
xATR = ta.atr(ATR_Period)
nLoss = ATR_Mult * xATR

iff_1 = close > nz(ATR_TrailSL[1], 0) ? close - nLoss : close + nLoss
iff_2 = close < nz(ATR_TrailSL[1], 0) and close[1] < nz(ATR_TrailSL[1], 0) ? math.min(nz(ATR_TrailSL[1]), close + nLoss) : iff_1
ATR_TrailSL := close > nz(ATR_TrailSL[1], 0) and close[1] > nz(ATR_TrailSL[1], 0) ? math.max(nz(ATR_TrailSL[1]), close - nLoss) : iff_2

iff_3 = close[1] > nz(ATR_TrailSL[1], 0) and close < nz(ATR_TrailSL[1], 0) ? -1 : nz(pos[1], 0)
pos := close[1] < nz(ATR_TrailSL[1], 0) and close > nz(ATR_TrailSL[1], 0) ? 1 : iff_3

atr_color = pos == -1 ? color.green : pos == 1 ? color.red : color.aqua
atrtrend = plot(ATR_TrailSL, 'Trailing StopLoss', atr_color, linewidth=2)

// ===  Stop Loss === //
slGroup = 'Stop Loss'
useSL = input.bool(false, title='╔══════   Enable   ══════╗', group=slGroup, tooltip='If you are using this strategy for Scalping or Futures market, we do not recommend using Stop Loss.')
SLbased = input.string(title='Based on', defval='Percent', options=['ATR', 'Percent'], group=slGroup, tooltip='ATR: Average True Range\nPercent: eg. 5%.')
multiATR = input.float(10.0, title='ATR   Mult', group=slGroup, inline='atr')
lengthATR = input.int(14, title='Length', group=slGroup, inline='atr')
SLPercent = input.float(5, title='Percent', group=slGroup) * 0.01
Shortposenter = input.bool(false, title='ShortPosition')

longStop = 0.0
shortStop = 0.0

if SLbased == 'ATR'
    longStop := ta.valuewhen(pos == 1, low, 0) - ta.valuewhen(pos == 1, ta.rma(ta.tr(true), lengthATR), 0) * multiATR
    longStopPrev = nz(longStop[1], longStop)
    longStop := close[1] > longStopPrev ? math.max(longStop, longStopPrev) : longStop

    shortStop := ta.valuewhen(pos == -1, ta.rma(ta.tr(true), lengthATR), 0) * multiATR + ta.valuewhen(pos == -1, high, 0)
    shortStopPrev = nz(shortStop[1], shortStop)
    shortStop := close[1] > shortStopPrev ? math.max(shortStop, shortStopPrev) : shortStop
    shortStop
if SLbased == 'Percent'
    longStop := strategy.position_avg_price * (1 - SLPercent)
    shortStop := strategy.position_avg_price * (1 + SLPercent)
    shortStop
exitLong  = pos == -1

// === PlotColor === //
buySignal = pos == 1 and pos[1] == -1
plotshape(buySignal, title="Long", location=location.belowbar, style=shape.labelup, size=size.normal, color=color.new(color.green,50), text='Buy', textcolor=color.white)
exitSignal = pos == -1 and pos[1] == 1
plotshape(exitSignal, title="Exit", location=location.abovebar, style=shape.labeldown, size=size.normal, color=color.new(color.red,50), text='Exit', textcolor=color.white)

hPlot = plot(ohlc4, title="", style=plot.style_circles, linewidth=0, editable = false)
longFill = (pos == 1 ? color.new(color.green,80) : na)
shortFill = (pos == -1 ? color.new(color.red,80) : na)
fill(hPlot, atrtrend,color=longFill)
fill(hPlot,atrtrend, color=shortFill)

// === Strategy === //
strategy.entry('Long', strategy.long,limit = buyavg, when=window() and pos == 1,comment="Entry: "+str.tostring(buyavg))
strategy.close('Long', when=window() and exitLong , comment='Exit: '+str.tostring(sellavg) )

if Shortposenter
    strategy.entry('Short', strategy.short, when=window() and pos== -1,comment="Entry: "+str.tostring(close))
    strategy.close('Short', when=window() and pos == 1 , comment='Exit: ')

if useSL
    strategy.exit('Stop Loss', 'Long', stop=longStop)

// === Show StopLoss Price === //
if show_STOPLOSSprice
    if pos == -1
        label ShortStop = label.new(bar_index, na, 'SL: ' + str.tostring(ATR_TrailSL), color=color.green, textcolor=color.white, style=label.style_none, yloc=yloc.abovebar, size=size.small)
        label.delete(ShortStop[1])

    if pos == 1
        label LongStop = label.new(bar_index, na, 'SL: ' + str.tostring(ATR_TrailSL), color=color.red, textcolor=color.white, style=label.style_none, yloc=yloc.belowbar, size=size.small)
        label.delete(LongStop[1])