真夜中のキャンドルカラー戦略
作成日:
2024-01-05 16:37:35
最終変更日:
2024-01-05 16:37:35
コピー:
0
クリック数:
909
1
フォロー
1750
フォロワー
概要
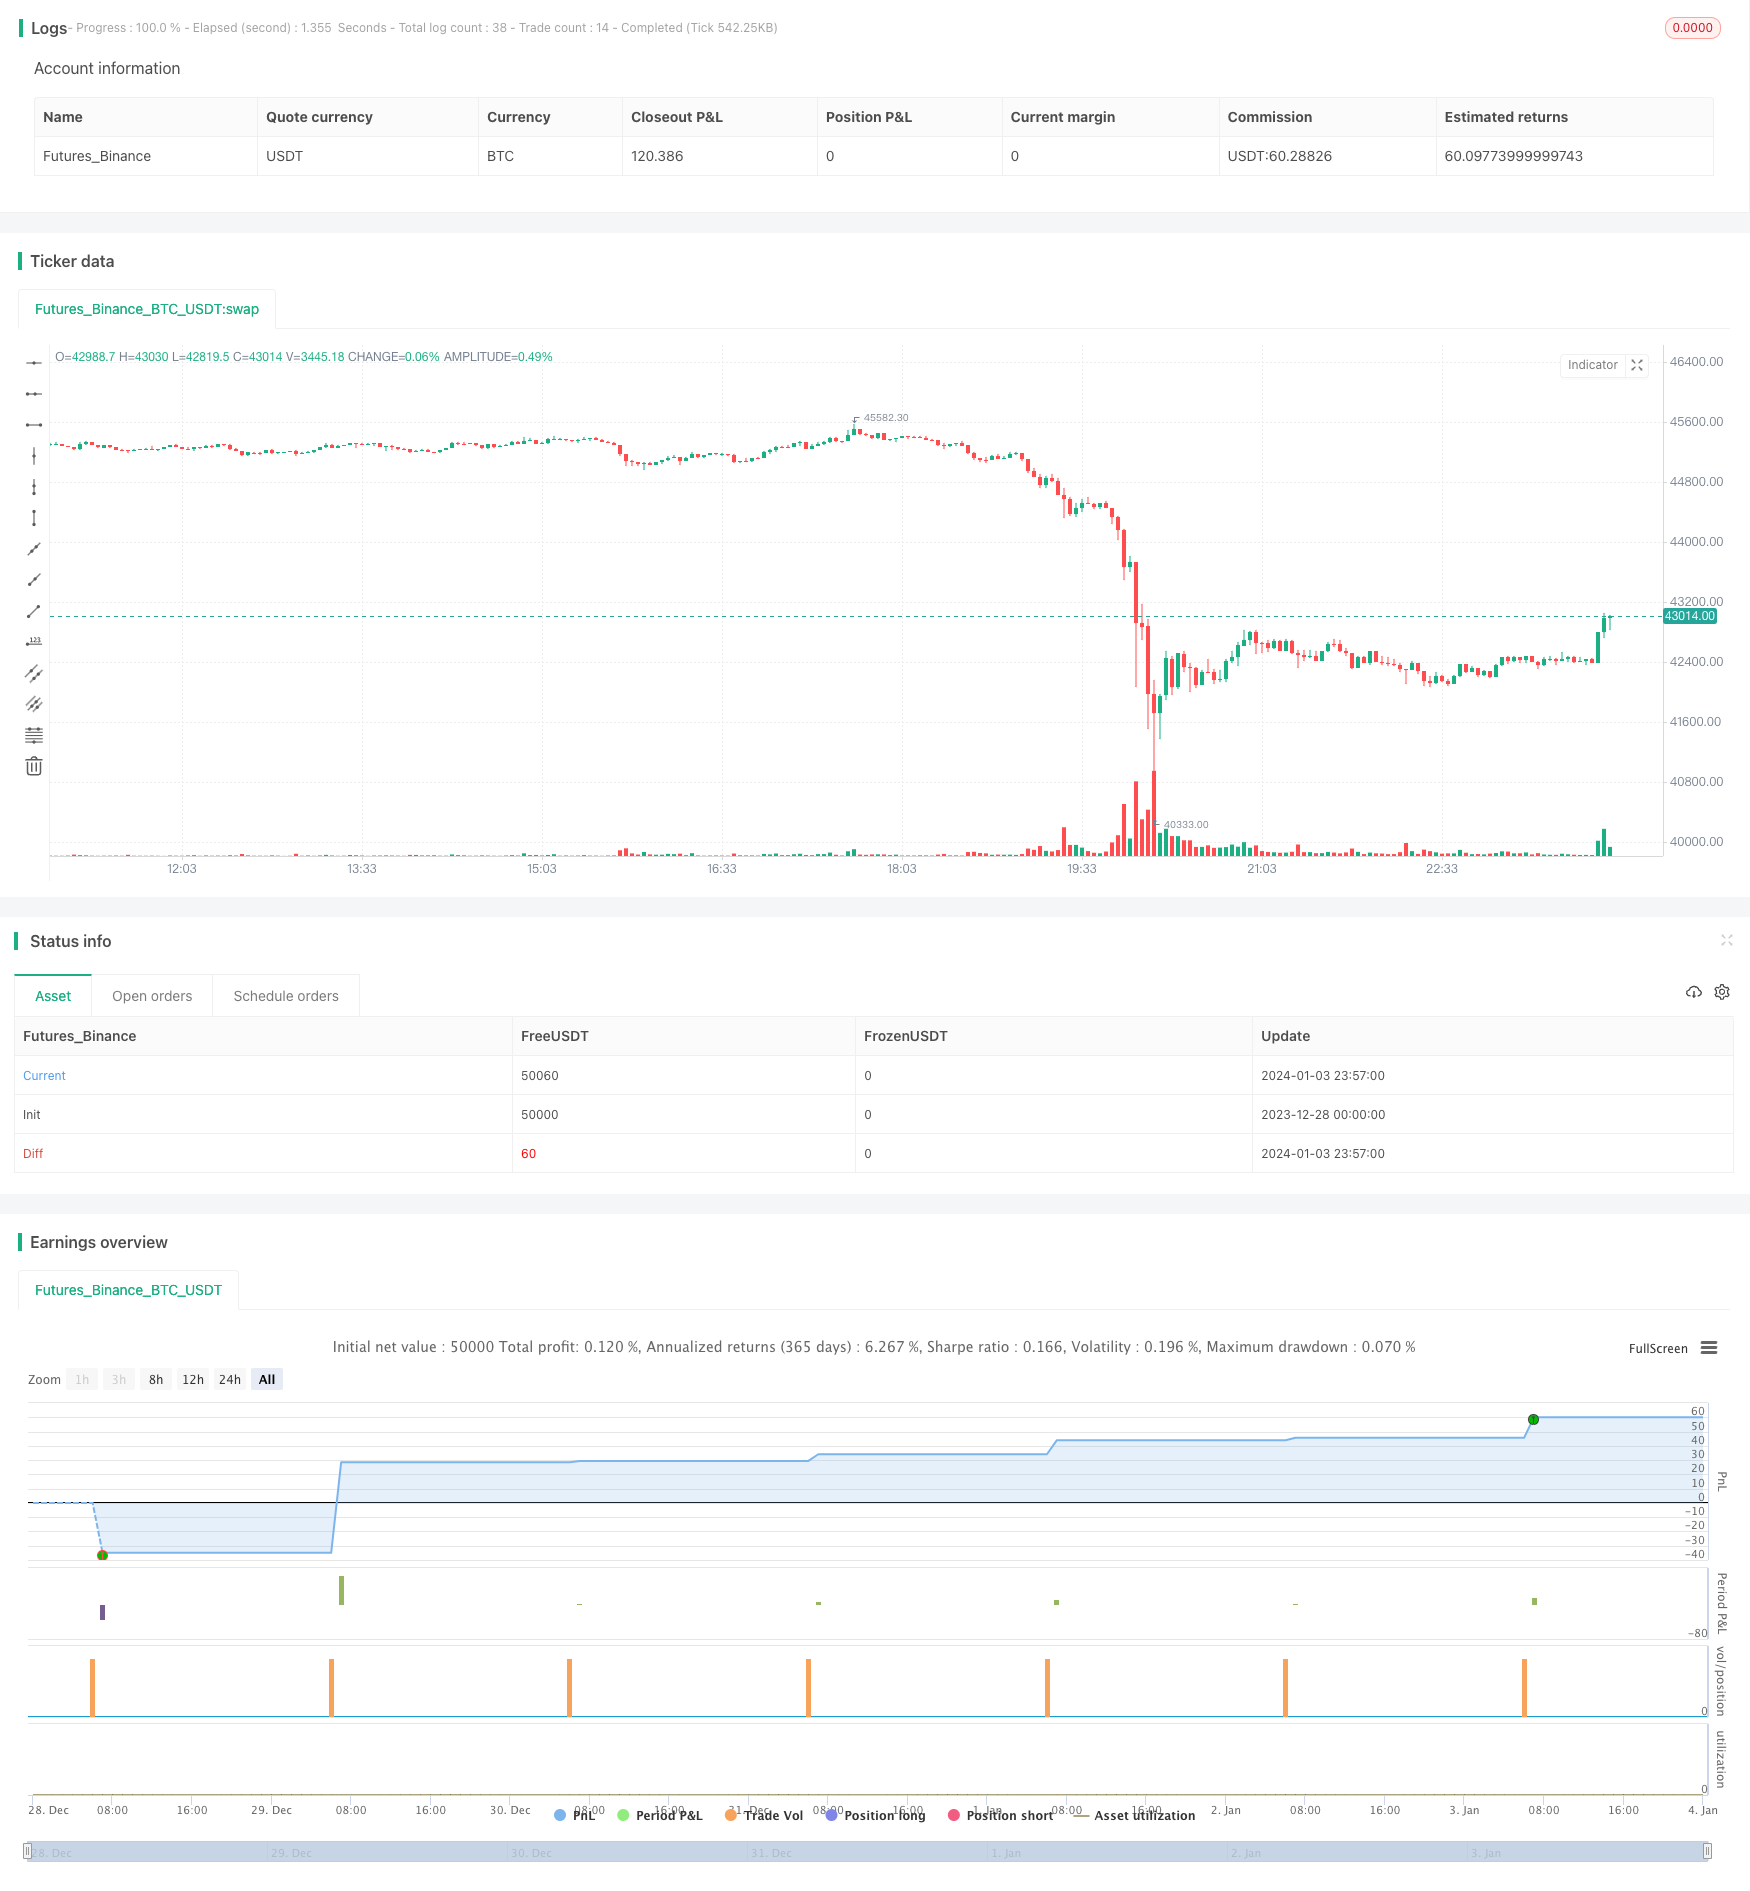
この戦略は,1時間遅れた真夜中のの色に基づいて取引し,前日の真夜中の0点の色を分析して,翌日の1時の取引方向を判断する.0点が緑であるとき多し,赤であるとき空し.同時に,ストップとストップポジションを設定する.
戦略原則
この戦略の核心的な論理は,前日の真夜中の真夜中の魅力の効果に基づいている.すなわち,前日の真夜中の0点の色の色は,その日の全体的な市場雰囲気を代表し,次の日の開盤後の市場方向を判断するために使用することができる.
具体的には,戦略は,まず,現在のK線が0点であるかどうかを判断し,もしそうなら,その閉盘価格が開盘価格より高いことを緑で,そうでない場合は赤で記録する.次のバー,すなわち1点K線で,前日の0点の色に基づいて,相応の方向の多空を行うこと,およびストップ・ロスの位置を設定する.
この方法により,0点時の激しい波動が入場に影響を及ぼすのを防ぐことができます.
戦略的優位性
- 0点の色を使って市場の方向を判断する戦略は,シンプルで分かりやすく,論理が明確です.
- 取引開始を1時間遅らせれば,価格の急激な変動を回避できます.
- ストップ・ストップを設定して,損失を制限し,利益を保証します.
戦略リスク
- 0点の色は,次の日の市場動きを完全に表しているとは限りません.一定の不確実性があります.
- 大規模な経済イベントなどの状況で突然の大きな変動のリスクを考慮していない
- 止損ストップの設定は,継続的に最適化およびテストする必要があります.そうでなければ,セットまたは利益が制限される可能性があります.
戦略最適化の方向性
- 0点の指示効用は,交差量変化,震度などの他の要因と組み合わせて判断できます.
- 2時間,3時間などでテストできます.
- 市場波動に適応するために,ストップ・ストップを動的に調整する
要約する
この戦略の全体的な考え方は明確でシンプルで,0点色によって次の日の方向を判断し,ストップ・ストップ・ストップ・コントロールのリスクを設定する.これは初心者にとって適した入門ショートライン戦略である.しかし,一定の不確実性も存在し,その後,現実戦を行うためには,継続的に最適化と検証が必要である.
ストラテジーソースコード
/*backtest
start: 2023-12-28 00:00:00
end: 2024-01-04 00:00:00
period: 3m
basePeriod: 1m
exchanges: [{"eid":"Futures_Binance","currency":"BTC_USDT"}]
*/

//@version=4
strategy("Midnight Candle Color Strategy with 1-Hour Delay and SL/TP", shorttitle="12AM +1H SL/TP Strat", overlay=true)

// Adjust for New York time (UTC-5 or UTC-4 for Daylight Saving Time)
// Assuming UTC-5 for now; adjust as necessary for Daylight Saving Time
nyHour(hour) => (hour - 5) % 24

// Function to check if the current bar is the 12:00 AM New York time bar
isMidnightBar() =>
    nyHour(hour) == 0 and minute == 0

// Function to check if the current bar is the 1:00 AM New York time bar (1 hour after midnight)
is1AMBar() =>
    nyHour(hour) == 1 and minute == 0

// Variable to store the color of the previous day's midnight candle
var color midnightCandleColorPrevDay = na

// Determine the color of the previous day's midnight candle
if isMidnightBar()
    midnightCandleColorPrevDay := close[1] > open[1] ? color.green : color.red

// Strategy execution at 1:00 AM based on the color of the previous day's midnight candle
if is1AMBar()
    if midnightCandleColorPrevDay == color.green
        strategy.entry("Long", strategy.long)
        strategy.exit("Take Profit", "Long", limit=close + 57 * syminfo.mintick, stop=close - 200 * syminfo.mintick)
    if midnightCandleColorPrevDay == color.red
        strategy.entry("Short", strategy.short)
        strategy.exit("Take Profit", "Short", limit=close - 50 * syminfo.mintick, stop=close + 200 * syminfo.mintick)

// Optional: Plot a marker for visualization
plotshape(series=isMidnightBar(), style=shape.triangleup, location=location.belowbar, color=color.new(midnightCandleColorPrevDay, 90), size=size.small)
plotshape(series=is1AMBar(), style=shape.triangledown, location=location.abovebar, color=color.blue, size=size.small)