平均範囲トレンドフィルターバックテスト戦略
作成日:
2024-01-08 10:20:25
最終変更日:
2024-01-08 10:20:25
コピー:
1
クリック数:
766
1
フォロー
1750
フォロワー
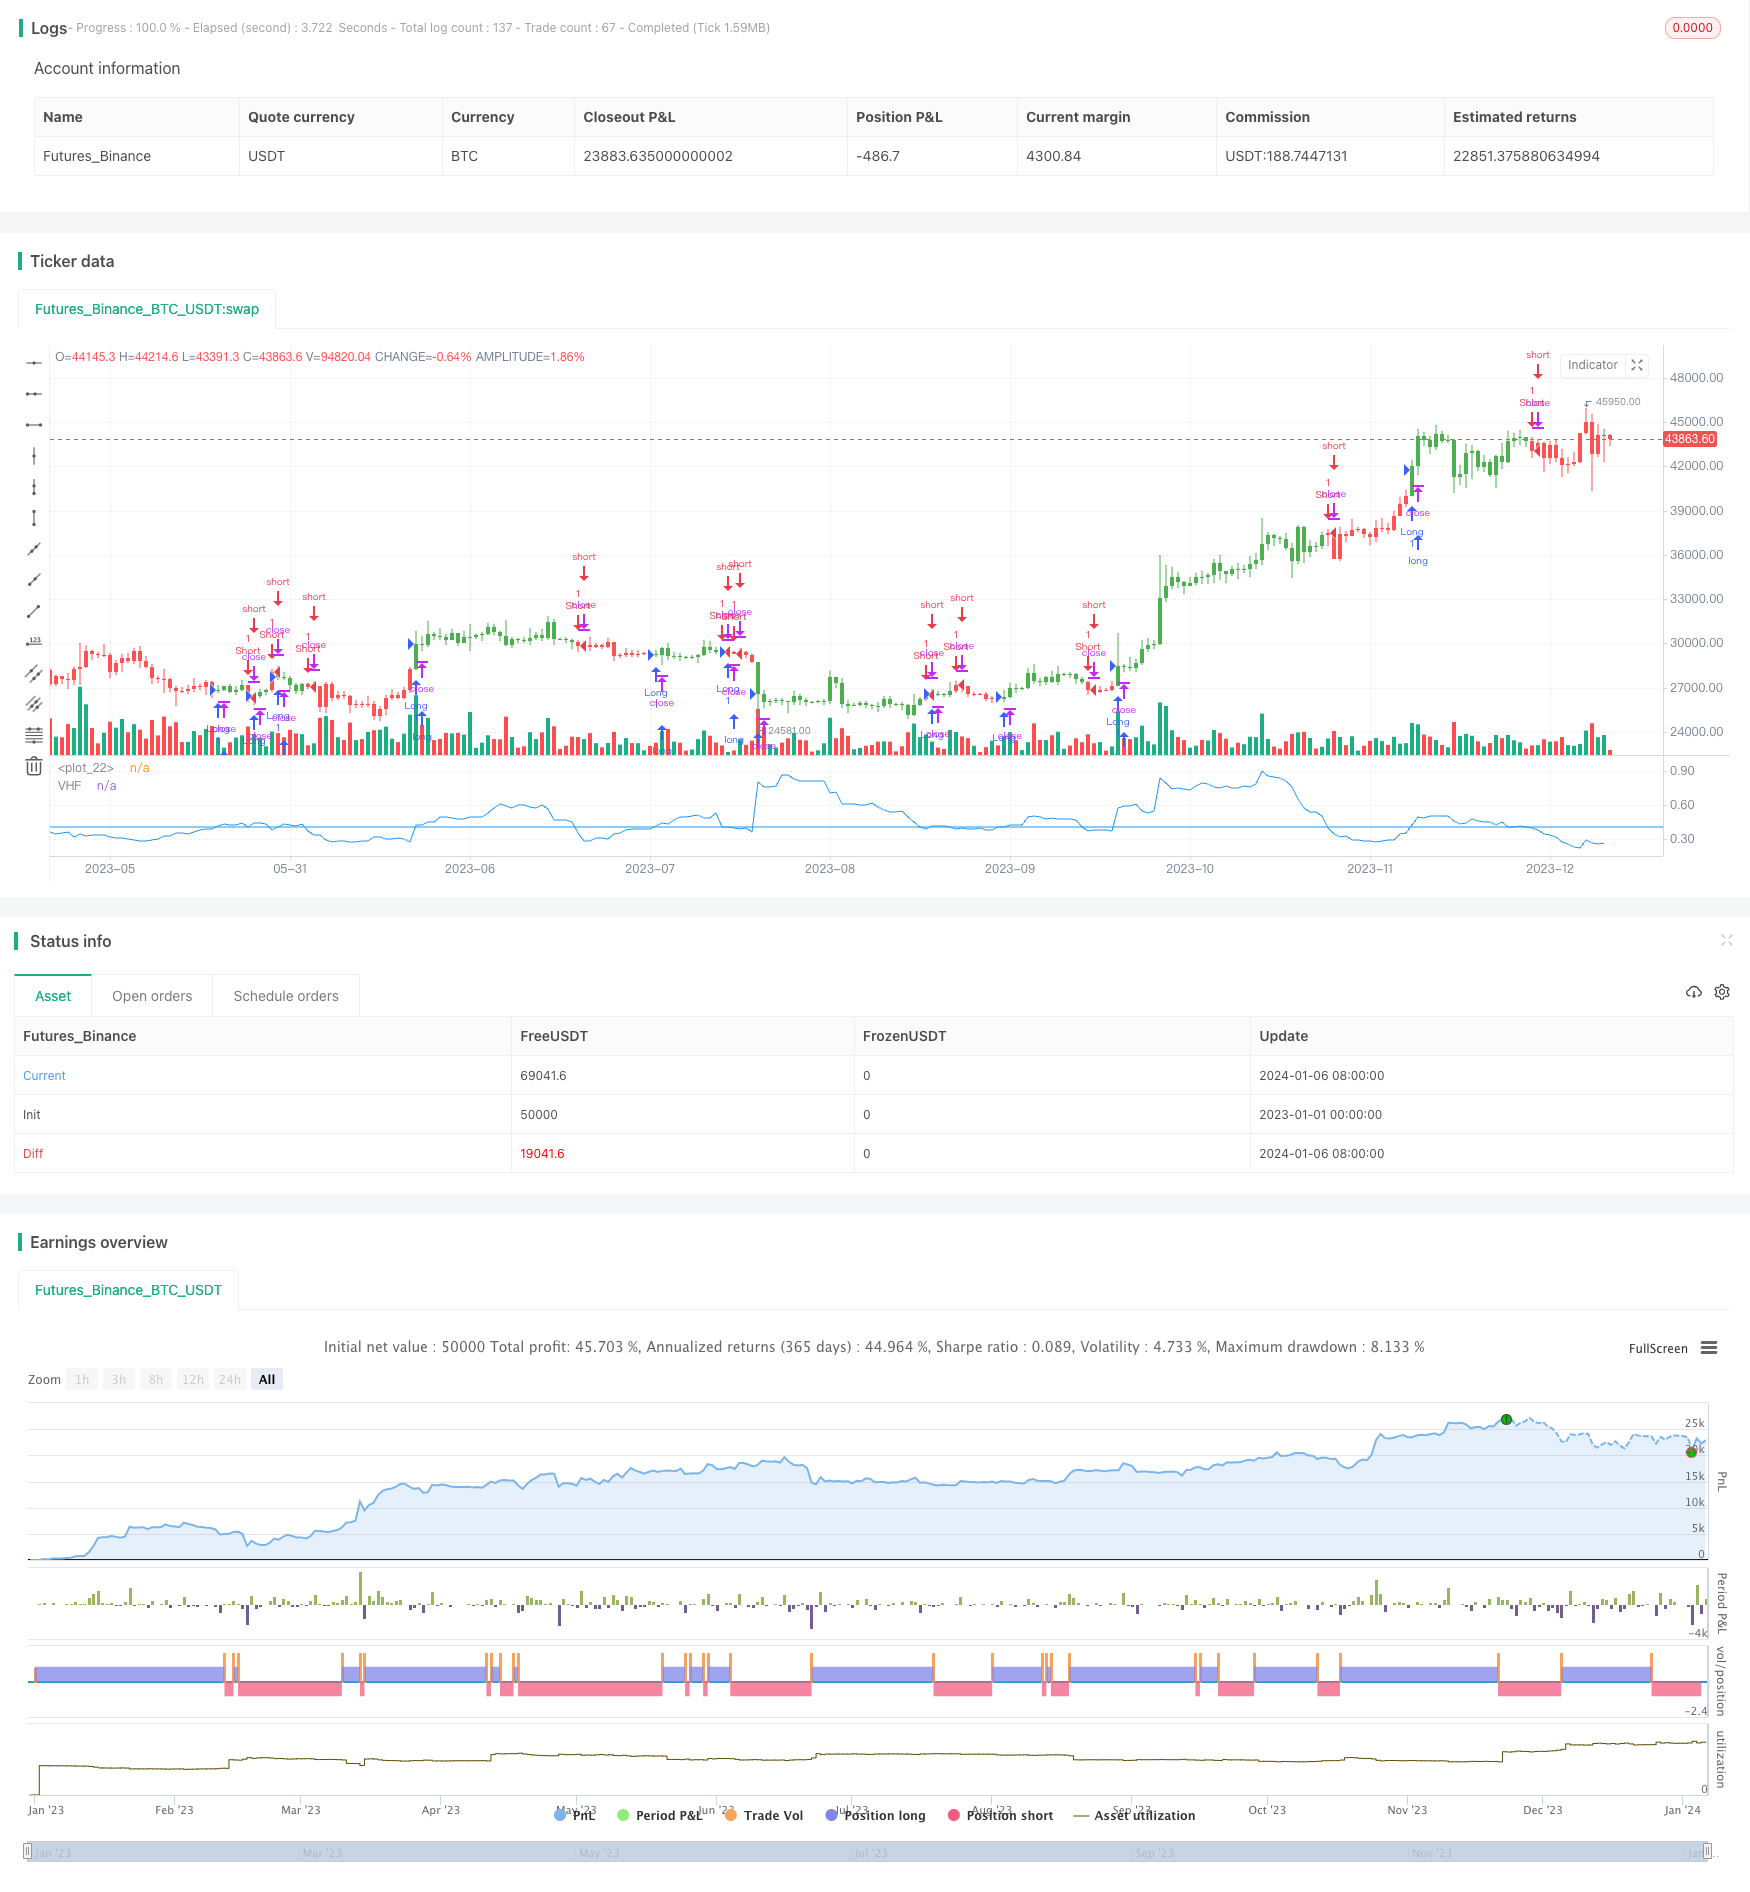
概要:この戦略は,特定の周期における最高価格と最低価格の差値と終盤価格の振幅の比率を計算して,価格が傾向状態にあるかどうかを判断し,取引信号指標として使用する.
策略原理:策略の核心指標は,垂直水平フィルター ((VHF) である.これは以下の公式で計算される.
VHF = (Highest(Length) - Lowest(Length)) / SUM(ABS(Close - Close[1]), Length)
この数値の比率は,価格の動きの傾向性を判断する.VHFが与えられた信号の値より高いときは,価格がトレンド状態にあると考えられる.そして,与えられた信号の値より低いときは,価格が整盘状態にあると考えられる.この取引シグナルが生成される.
この戦略はシンプルで直感的で,価格の波動範囲と実際の波幅を比較してトレンド性を判断し,SMA,EMAなどの指標を単独で頼り,価格そのものの特性を無視する問題を回避する.しかし,この戦略はパラメータ最適化に敏感であり,異なる周期と市場環境に合わせてLengthとSignalのパラメータを調整する必要があります.
優位分析:
- シンプルで効果的.
- 価格の特性を考慮し,曲線適合には依存しない.
- 設定可能なパラメータの判断調整の感度。
- 取引戦略に簡単に組み込める
リスク分析:
- パラメータに敏感で,不適切な設定により,誤った取引が多く発生する.
- 価格が転換点にあるときの偽トレンドを区別できない.
- 大周期設定では,短周期の価格変動に無感である.
- 単一損失をコントロールするために,ストップ・ローズと組み合わせる必要があります.
改善する方向:
- 長さのパラメータを最適化してトレンド判断の感性をバランスする.
- 他の指標と組み合わせてVHF信号をフィルタリングする.例えばMACDはターニングポイントを判断する.
- VHF曲線にマッチする機械学習の方法を試す.
- 異なる周期が並行して,多層の戦略信号を生成する.
結論:この戦略は,価格自体の特性の直感的な判断傾向に基づいて,単純で有効で,さらなる探索,最適化および検証に値し,基本的傾向判断ツールになり,量化取引戦略に広く適用されます.
ストラテジーソースコード
/*backtest
start: 2023-01-01 00:00:00
end: 2024-01-07 00:00:00
period: 1d
basePeriod: 1h
exchanges: [{"eid":"Futures_Binance","currency":"BTC_USDT"}]
*/

//@version=2
////////////////////////////////////////////////////////////
//  Copyright by HPotter v1.0 27/04/2018
// Vertical Horizontal Filter was initiated by Adam White. It was first published
// in a magazine called “Issues of Futures” in August, 1991. The Vertical Horizontal
// Filter (VHF) is a very common Indicator used by traders to find out the Phase of
// a Price Trend. Normally, a price trend can be in a Trending Phase or a Congestion
// Phase/Choppy Movement Phase. Adam White created this particular Technical Indicator
// to determine whether prices are trending in a particular direction or are they going
// through a transitional period. He used it to measure the range of Futures available
// in the market.
//
// You can change long to short in the Input Settings
// WARNING:
//  - For purpose educate only
//  - This script to change bars colors.
////////////////////////////////////////////////////////////
strategy(title="Vertical Horizontal Filter Backtest")
Length = input(28, minval=1)
Signal = input(0.4, step=0.01)
reverse = input(false, title="Trade reverse")
hline(Signal, color=blue, linestyle=line)
xHH = highest(high, Length)
xLL = lowest(low, Length)
xNumerator = abs(xHH - xLL)
xDenominator = sum(abs(close - close[1]), Length)
xVHF = xNumerator / xDenominator
pos = iff(xVHF > Signal, 1,
       iff(xVHF < Signal, -1, nz(pos[1], 0)))
possig = iff(reverse and pos == 1, -1,
          iff(reverse and pos == -1, 1, pos))
if (possig == 1)
    strategy.entry("Long", strategy.long)
if (possig == -1)
    strategy.entry("Short", strategy.short)
barcolor(possig == -1 ? red: possig == 1 ? green : blue )
plot(xVHF, color=blue, title="VHF")