RSI指標に基づくデュアルトラックブレークスルー戦略
概要
この戦略は,RSI指数に基づく二軌道の突破戦略と呼ばれています. この戦略は,RSI指数の二軌道の配合を利用して判断し,低買い高売りを達成する目的があります. RSI指数が設定された低軌道を下回ると,購入信号とみなされ,RSI10がRSI14より低い場合,購入をさらに確認します. RSI指数が設定された高軌道を上回ると,売却信号とみなされ,RSI10がRSI14より高い場合,売却をさらに確認します.
戦略原則
この戦略の核心的な論理は,RSI指標の双軌を活用して判断することである. RSI指標は,一般的に14サイクルで設定され,近14日の株の強弱状況を代表する.この戦略は,RSI10を補助判断指標として追加している.
RSI14が40の軌道を破ると,株価が弱点から落ちると,サポート反発の機会が形成される可能性があると考えます.この時点でRSI10がRSI14より小さい場合,短期的な傾向が依然として下方であることを示すため,下降シグナルをさらに確認できます.したがって,RSI14 <= 40とRSI10 < RSI14のを満たす場合,買入シグナルが生じます.
RSI14が70の軌道を突破すると,株価が短期的な強み領域に入ると考えられ,後退調整の機会が生じる可能性がある.この時点で,RSI10がRSI14より大きい場合,短期的な傾向が上昇し続けることを示すため,看板の信号をさらに確認することができます.したがって,RSI14 >= 70とRSI10 > RSI14が満たされると,売り込みの信号が生じます.
このように,RSI14とRSI10の配合判断は,双線戦略の核心的な論理を構成する.
戦略的優位性
- 双RSIの組み合わせにより,より正確に買いと売却のポイントを把握できます.
- モバイル・ストップ・メカニズムにより,最大損失を制御する
- 目標利益を達成した後に退出する,利益の返還を避けるための停止退出メカニズムを設定する
戦略リスク
- RSIは誤信号を誘発しやすいため,損失を完全に回避することはできません.
- ストップポイントがあまりにも近く設定されている場合,秒出され,リスクが大きく設定され,制御が困難です.
- 事故の原因は,高速跳びなどの異常な動きでも発生します.
この戦略を最大限に活用するには,RSIのパラメータを適切に調整し,ストップ・ローズを厳格に制御し,過度に密集した操作を避け,安定した持続的な収益性を追求することができます.
戦略最適化の方向性
- KDJ,MACDなどの他の指標と組み合わせることで,多指標検証を実現することも考えられます.
- RSI パラメータは,品種ごとに設定され,その品種特性に近いように設定できます.
- 動的ストップを設定し,ATRなどの指標に基づいてストップをリアルタイムで調整できます.
- RSIパラメータは,機械学習技術によって自動的に最適化できます.
要約する
本策は,RSIの二線思考に基づいて判断し,ある程度は部分的なノイズ信号をフィルターする.しかし,いかなる単一の指標策も完璧にはならない.RSI指標は誤導されやすいので,慎重に見るべきである.本策には,リスクを制御するための移動停止および停止メカニズムが組み込まれている.これは非常に必要である.将来,戦略パラメータと停止方法をより賢く,動的にするために,最適化が続けられる.
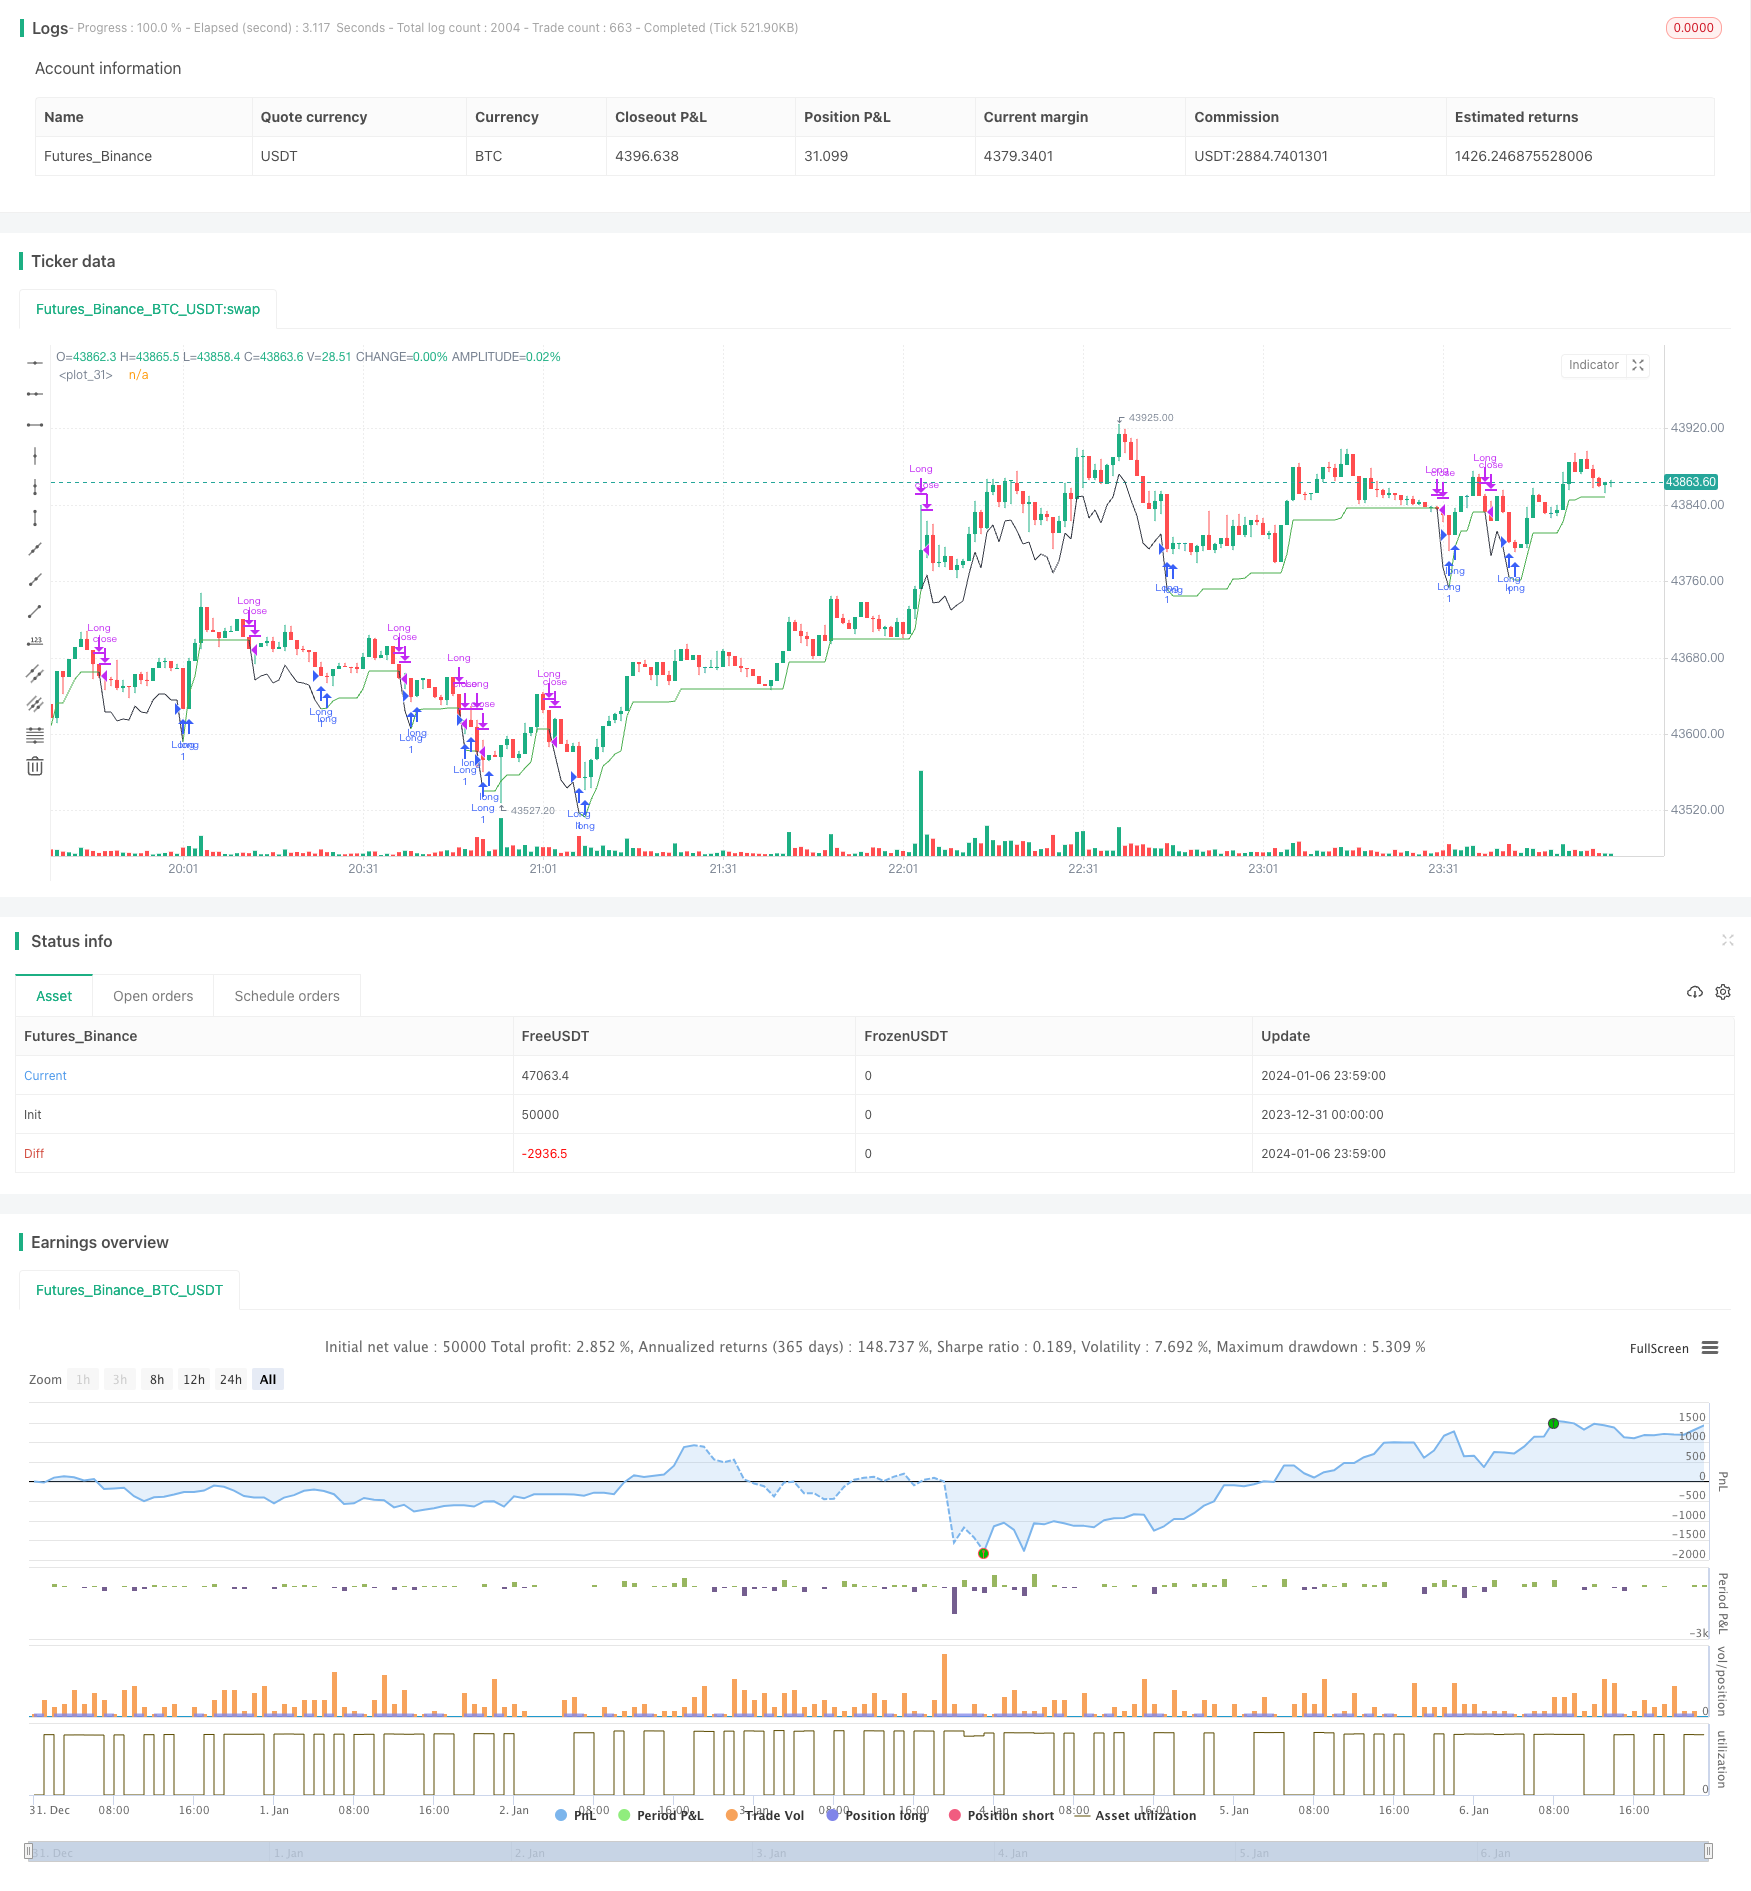
/*backtest
start: 2023-12-31 00:00:00
end: 2024-01-07 00:00:00
period: 1m
basePeriod: 1m
exchanges: [{"eid":"Futures_Binance","currency":"BTC_USDT"}]
*/

// This source code is subject to the terms of the Mozilla Public License 2.0 at https://mozilla.org/MPL/2.0/
// © DojiEmoji

//@version=4
strategy("[KL] RSI 14 + 10 Strategy",overlay=true)

backtest_timeframe_start = input(defval = timestamp("01 Jan 2015 13:30 +0000"), title = "Backtest Start Time", type = input.time)
//backtest_timeframe_end = input(defval = timestamp("19 Mar 2021 19:30 +0000"), title = "Backtest End Time", type = input.time)
TARGET_PROFIT_MODE = input(false,title="Exit when Risk:Reward met")
REWARD_RATIO = input(3,title="Risk:[Reward] (i.e. 3) for exit")
// Trailing stop loss {
TSL_ON = input(true,title="Use trailing stop loss")
var entry_price = float(0)
ATR_multi_len = 26
ATR_multi = input(2, "ATR multiplier for stop loss")
ATR_buffer = atr(ATR_multi_len) * ATR_multi
plotchar(ATR_buffer, "ATR Buffer", "", location = location.top)
risk_reward_buffer = (atr(ATR_multi_len) * ATR_multi) * REWARD_RATIO
take_profit_long = low > entry_price + risk_reward_buffer
take_profit_short = low < entry_price - risk_reward_buffer
var bar_count = 0 //number of bars since entry
var trailing_SL_buffer = float(0)
var stop_loss_price = float(0)
stop_loss_price := max(stop_loss_price, close - trailing_SL_buffer)
// plot TSL line
trail_profit_line_color = color.green
showLine = strategy.position_size == 0
if showLine
    trail_profit_line_color := color.black
    stop_loss_price := close - trailing_SL_buffer
plot(stop_loss_price,color=trail_profit_line_color)
// }
// RSI
RSI_LOW = input(40,title="RSI entry")
RSI_HIGH = input(70,title="RSI exit")
rsi14 = rsi(close, 14)
rsi10 = rsi(close, 10)

if true// and time <= backtest_timeframe_end
    buy_condition = rsi14 <= RSI_LOW and rsi10 < rsi14
    exit_condition = rsi14 >= RSI_HIGH and rsi10 > rsi14
    //ENTRY:
    if strategy.position_size == 0 and buy_condition
        entry_price := close
        trailing_SL_buffer := ATR_buffer
        stop_loss_price := close - ATR_buffer
        strategy.entry("Long",strategy.long, comment="buy")
        bar_count := 0
    else if strategy.position_size > 0
        bar_count := bar_count + 1

    //EXIT:
    // Case (A) hits trailing stop
    if TSL_ON and strategy.position_size > 0 and close <= stop_loss_price
        if close > entry_price
            strategy.close("Long", comment="take profit [trailing]")
            stop_loss_price := 0
        else if close <= entry_price and bar_count
            strategy.close("Long", comment="stop loss")
            stop_loss_price := 0
        bar_count := 0
    // Case (B) take targeted profit relative to risk
    if strategy.position_size > 0 and TARGET_PROFIT_MODE
        if take_profit_long
            strategy.close("Long", comment="take profits [risk:reward]")
            stop_loss_price := 0
        bar_count := 0
    // Case (C)
    if strategy.position_size > 0 and exit_condition
        if take_profit_long
            strategy.close("Long", comment="exit[rsi]")
            stop_loss_price := 0
        bar_count := 0