ダブル移動平均価格の突破とロングショートパワーバランスの組み合わせ戦略
作成日:
2024-01-08 17:09:48
最終変更日:
2024-01-08 17:09:48
コピー:
5
クリック数:
758
1
フォロー
1751
フォロワー
概要
この戦略は,まず,2期と20期の指数移動平均を用いて双均線指数を構築し,価格が均線を破ったかどうかを判断し,入場場場内の基本判断となります.同時に,補助判断指数多空力バランス指数多頭と空頭の相対力をさらに識別し,誤操作をフィルターします.二つの指数の総合判断が最終取引の信号を形成します.
戦略原則
2⁄20 平均線指標
- 2期と20期の指数移動平均 ((EMA) を計算する
- 取引のシグナルが送信されるのは,閉店価格が平均線の片側から反対側に突破したときです.
- 平均線20を突破するとトレンドが確認される.
- 突破2平均線は特定の入場点の位置を決定する信号である.
多空力のバランス指標
- 多頭力の値と空頭力の値をそれぞれ計算する
- 大きさを比較すると,多空力は比較的弱い.
- 進出の補助的な判断として,強さの方向
2つの指標を組み合わせた判断
- 双均線指数は,大きなトレンドの方向を判断します.
- 多空力のバランス指標による局所的地域判断
- 取引の信号は,両者が一致したときに発信されます.
優位分析
この組み合わせ戦略の最大の利点は,異なる品種の指標を組み合わせて,より信頼できる取引判断を実現することです.具体的には以下のいくつかの利点があります.
- 横軸を2つの均等線で判断し,局所的な浮動から逃れる
- 多空力平衡指標による局所的な地域判断,特定の入場地点の精密な把握
- この2つの指標は相互に検証され,誤った操作をフィルターし,取引リスクを軽減します.
- パラメータの設定は柔軟で,異なる市場品種に最適化できます.
- 戦略はシンプルでわかりやすく,後期に最適化できる
リスク分析
この戦略にはいくつかのリスクがあります.
- 指示器の信号の遅延は,ストップポイントが深すぎることにつながります.
- 双均線指標はパラメータ設定に敏感である
- 多空平衡指標は短期的な状況の判断に少々不正確である.
- 特殊な状況下では (通常突破偽信号) 2つの指標で判断偏差が生じることがあります
対策として
- 適正にポジション保持期間を短縮するか,適切な移動ストップを設定する
- 異なるパラメータの組み合わせをテストし,最適なパラメータを見つけます.
- 他の指標を補足して確認
- 品種特性の最適化パラメータ
最適化の方向
この戦略は,次の点から改善できます.
- 平均線指数パラメータの組み合わせをテストする
- ストップ・ストップ戦略を高め,単発ストップをコントロールする
- 波動率指標と組み合わせ,パラメータの自律性を向上させる
- 機械学習モデルを追加し,動態パラメータの最適化を実現する
- 多空平衡指数に別の順位指数を入れ替える
- ユーザが異なるパラメータをテストできるように,ビジュアルなインターフェースを開発
要約する
この戦略は,双均線指標によって大トレンドを判断し,多空力均衡指標によって入場時期を判断する.この2つの指標は相互検証し,誤操作の確率を効果的に低減することができる.戦略パラメータの選択は柔軟であり,異なる品種に対して最適化調整を行うことができる.全体的に見ると,戦略は比較的シンプルで実用的で,幅広い投資家が学び,使用する価値がある.その後のさらなる最適化により,戦略の効果をさらに向上させることができる.
ストラテジーソースコード
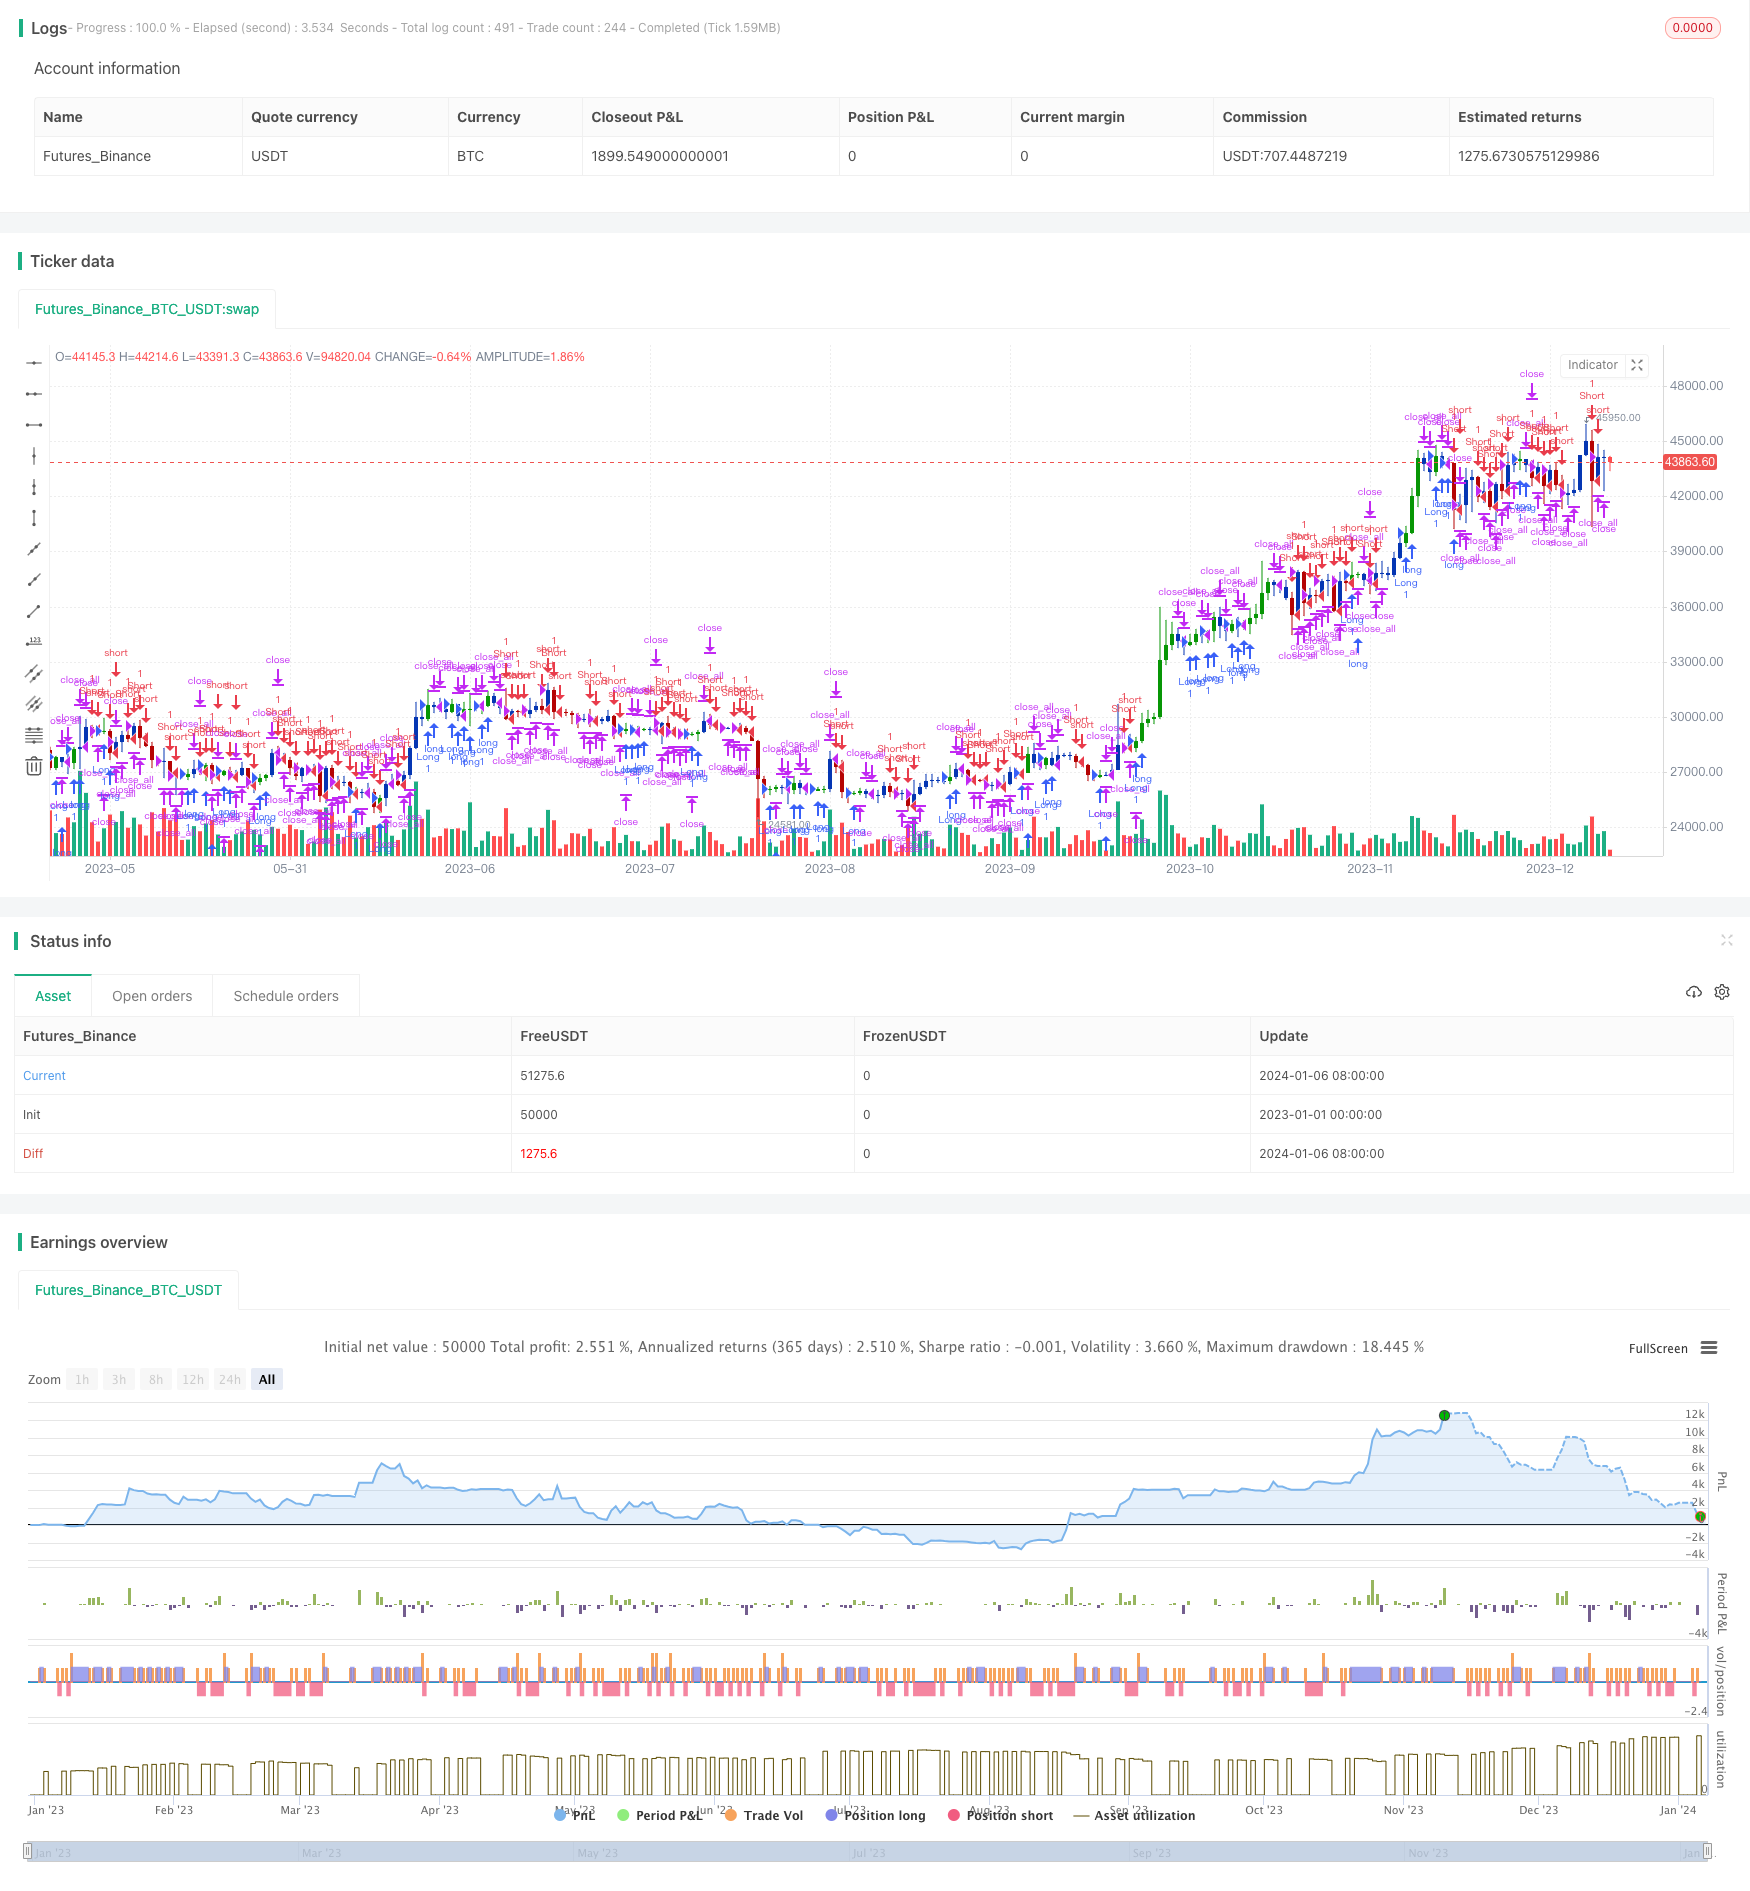
/*backtest
start: 2023-01-01 00:00:00
end: 2024-01-07 00:00:00
period: 1d
basePeriod: 1h
exchanges: [{"eid":"Futures_Binance","currency":"BTC_USDT"}]
*/

//@version=5
////////////////////////////////////////////////////////////
//  Copyright by HPotter v1.0 23/05/2022
// This is combo strategies for get a cumulative signal.
//
// First strategy
// This indicator plots 2/20 exponential moving average. For the Mov
// Avg X 2/20 Indicator, the EMA bar will be painted when the Alert criteria is met.
//
// Second strategy
//    This new indicator analyzes the balance between bullish and
//    bearish sentiment.
//    One can cay that it is an improved analogue of Elder Ray indicator.
//    To get more information please see "Bull And Bear Balance Indicator"
//    by Vadim Gimelfarb.
//
// WARNING:
// - For purpose educate only
// - This script to change bars colors.
////////////////////////////////////////////////////////////
EMA20(Length) =>
    pos = 0.0
    xPrice = close
    xXA = ta.ema(xPrice, Length)
    nHH = math.max(high, high[1])
    nLL = math.min(low, low[1])
    nXS = nLL > xXA or nHH < xXA ? nLL : nHH
    iff_1 = nXS < close[1] ? 1 : nz(pos[1], 0)
    pos := nXS > close[1] ? -1 : iff_1
    pos


BBB(SellLevel,BuyLevel) =>
    pos = 0.0
    value = close < open ?
              close[1] > open ?  math.max(close - open, high - low) : high - low :
                 close > open ?
                  close[1] > open ? math.max(close[1] - low, high - close) : math.max(open - low, high - close) :
                   high - close > close - low ?
                     close[1] > open ? math.max(close[1] - open, high - low) :high - low :
                      high - close < close - low ?
                         close > open ? math.max(close - low, high - close) : open - low :
                           close > open ? math.max(close[1] - open , high - close) :
                             close[1] < open ? math.max(open - low, high - close) : high - low

    value2 =close < open ?
              close[1] < open ?  math.max(high - close[1], close - low) : math.max(high - open, close - low) :
               close > open ?
                 close[1] > open ?  high - low : math.max(open - close[1], high - low) :
                  high - close > close - low ?
                   close[1] < open ? math.max(high - close[1], close - low) : high - open :
                     high - close < close - low ?
                      close[1] > open ?  high - low : math.max(open - close, high - low) :
                       close[1] > open ? math.max(high - open, close - low) :
                         close[1] < open? math.max(open - close, high - low): high - low
    nBBB = value2 - value
    pos :=  nBBB < SellLevel ? -1 :
    	     nBBB >= BuyLevel ? 1 : nz(pos[1], 0)
    pos

strategy(title='Combo 2/20 EMA & Bull And Bear Balance', shorttitle='Combo', overlay=true)
var I1 = '●═════ 2/20 EMA ═════●'
Length = input.int(14, minval=1, group=I1)
var I2 = '●═════  Bull And Bear Balance ═════●'
SellLevel = input.float(-15, step=0.01, group=I2)
BuyLevel = input.float(15, step=0.01, group=I2)
var misc = '●═════ MISC ═════●'
reverse = input.bool(false, title='Trade reverse', group=misc)
var timePeriodHeader = '●═════ Time Start ═════●'
d = input.int(1, title='From Day', minval=1, maxval=31, group=timePeriodHeader)
m = input.int(1, title='From Month', minval=1, maxval=12, group=timePeriodHeader)
y = input.int(2005, title='From Year', minval=0, group=timePeriodHeader)
StartTrade = time > timestamp(y, m, d, 00, 00) ? true : false
posEMA20 = EMA20(Length)
prePosBBB = BBB(SellLevel,BuyLevel)
iff_1 = posEMA20 == -1 and prePosBBB == -1 and StartTrade ? -1 : 0
pos = posEMA20 == 1 and prePosBBB == 1 and StartTrade ? 1 : iff_1
iff_2 = reverse and pos == -1 ? 1 : pos
possig = reverse and pos == 1 ? -1 : iff_2
if possig == 1
    strategy.entry('Long', strategy.long)
if possig == -1
    strategy.entry('Short', strategy.short)
if possig == 0
    strategy.close_all()
barcolor(possig == -1 ? #b50404 : possig == 1 ? #079605 : #0536b3)