移動平均クロスオーバー戦略
作成日:
2024-01-12 14:04:37
最終変更日:
2024-01-12 14:04:37
コピー:
1
クリック数:
763
1
フォロー
1750
フォロワー
移動平均線交差は,一般的な取引信号である.この戦略は,高速移動平均線と遅い移動平均線の交差を取引信号として利用する.具体的には,高速移動平均線が,下から遅い移動平均線を横切るときは,多行し,高速移動平均線が,上から下から遅い移動平均線を横切るときは,空行する.
この戦略は,20日指数関数移動平均 (EMA) を快速移動平均として,50日EMAを中速線として,200日EMAを同時に穿越する際に多行し,20日EMAと50日EMAを同時に穿越する際に空行する.このようにして,部分的な偽信号をフィルターすることができる.
戦略的優位性
- 移動平均策はシンプルで使いやすく,理解しやすく,実行できます.
- 複数の移動平均の組み合わせを使用して偽信号をフィルターできます.
- 飛行条件が明確で,出入りタイミングが判別できる
戦略リスク
- 状況の整理で誤ったシグナルが生じやすい
- 移動平均は遅滞しており,価格の転換を時間内に捉えることはできません.
- 突破的な行動から得られた利益を有効に活用できない
思考を最適化する
- 移動平均の周期パラメータを最適化して,異なる品種と周期に対応
- 取引量,ブリン帯などの他の指標のフィルター信号を追加する
- トレンドと逆転戦略を組み合わせて,トレンドの動きを追跡し,収束の機会を待っています.
要約する
移動平均線交差戦略の概念はシンプルで,容易に掌握できるもので,量化取引の基本戦略の1つである.この戦略は入門学習として優れた参照価値を有する.しかし,実戦では,品種と周期に対してパラメータを最適化し,他のより複雑な技術指標で補足して信号をフィルターして,戦略の実戦効果を高める必要がある.
ストラテジーソースコード
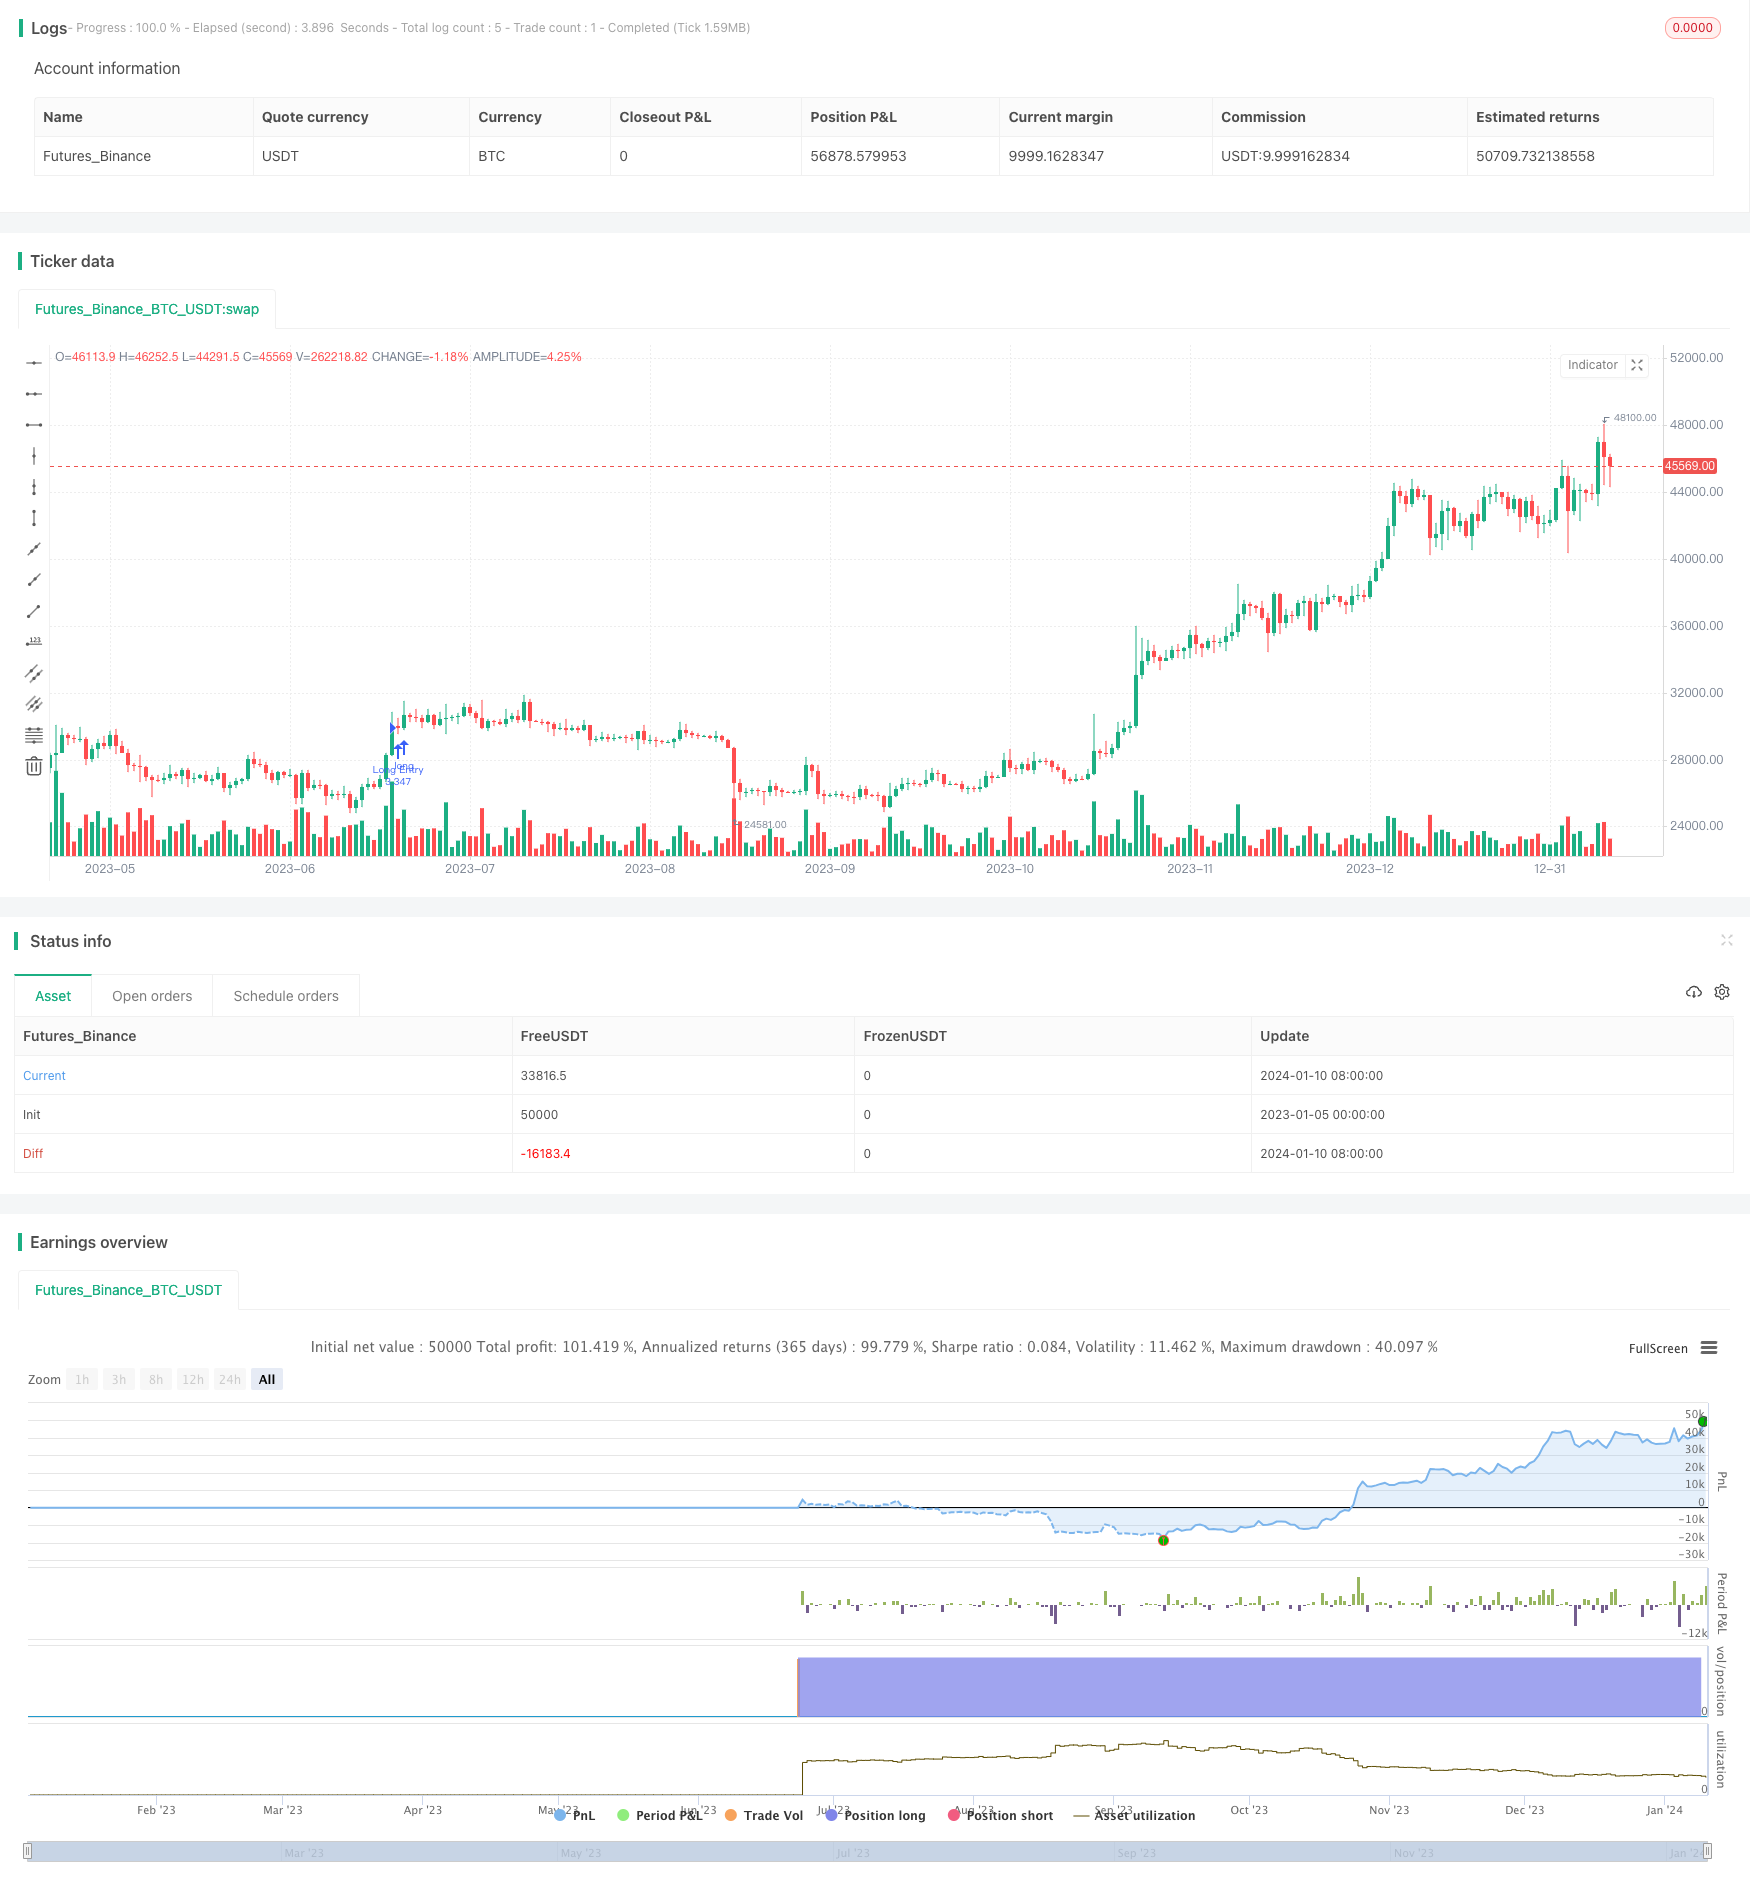
/*backtest
start: 2023-01-05 00:00:00
end: 2024-01-11 00:00:00
period: 1d
basePeriod: 1h
exchanges: [{"eid":"Futures_Binance","currency":"BTC_USDT"}]
*/

// This source code is subject to the terms of the Mozilla Public License 2.0 at https://mozilla.org/MPL/2.0/
// © rt-maax

//@version=5

strategy(title = "rt maax EMA cross strategy", shorttitle = "rt maax ema ", overlay = true, precision = 8, max_bars_back = 200, pyramiding = 0, initial_capital = 100000,
     currency = currency.USD, default_qty_type = strategy.cash, default_qty_value = 100000, commission_type = "percent", commission_value = 0.27)
fastema = ta.ema (close , 50)
fema=ta.ema(close,20)
slowema= ta.ema(close,200)
price = close

// === INPUT BACKTEST RANGE ===
fromMonth = input.int(defval = 1,    title = "From Month",  minval = 1, maxval = 12)
fromDay   = input.int(defval = 1,    title = "From Day",    minval = 1, maxval = 31)
fromYear  = input.int(defval = 2021, title = "From Year",   minval = 1970)
thruMonth = input.int(defval = 10,    title = "Thru Month",  minval = 1, maxval = 12)
thruDay   = input.int(defval = 25,    title = "Thru Day",    minval = 1, maxval = 31)
thruYear  = input.int(defval = 2112, title = "Thru Year",   minval = 1970)

// === INPUT SHOW PLOT ===
showDate  = input(defval = true, title = "Show Date Range")

// === FUNCTION EXAMPLE ===


longCondition1= ta.crossover (fema , fastema)
longcondition2= fema> slowema
longcondition3=fastema>slowema


if (longCondition1 and longcondition2 and longcondition3 )
    stoploss=low*0.97
    takeprofit=high*1.12
    strategy.entry("Long Entry", strategy.long)
    strategy.exit ("exit","long",stop=stoploss,limit=takeprofit)


shortCondition1 = ta.crossunder (fema , fastema )
shortcondition2= fastema< slowema
shortcondition3= fema< slowema

if (shortCondition1 and shortcondition2 and shortcondition3 )
    stoploss=low*0.97
    takeprofit=high*1.5
    strategy.entry("Short Entry", strategy.short)
    strategy.exit("exit","short",stop=stoploss,limit=takeprofit)