堅実なトレンドフォロー戦略
概要
この戦略の主な考えは,123の反転形状とスマートキャピタルフロー指数 (SMI) を組み合わせて,安定したトレンド追跡取引を実現することである.この戦略は,2つのシグナルが同時に買いまたは売りシグナルを発信するときに,対応する多頭または空頭ポジションを確立するだけである.
戦略原則
この戦略は2つの部分から構成されています.
123逆転戦略:この戦略は,株式の閉盘価格と9日目ストーフ指数に基づいて逆転取引を行う.具体的には,閉盘価格関係が2日連続で逆転する際 ((すなわち,前日の閉盘価格が前2日目より高く,後日の閉盘価格が前日目より低い),そしてストーフの快線が遅い線より高く,空きをする.
SMI戦略:この戦略は,スマートキャピタルフロー指数に基づくトレンド追跡を実現する. SMI指標は,機関資金と小売資金のゲームを反映することができる.SMIの上昇は,機関資金が吸収されていることを示す,逆に,機関資金が売り出されていることを示す.SMI指標が上昇すると多めに,下降すると空白にする.
123の反転形状とSMI指数が同時に買入シグナルを発信するときに,この戦略は多頭ポジションを取ります.両者が同時に売出シグナルを発信するときに,この戦略は空頭ポジションを取ります.
戦略的優位性
この戦略は,逆転形状とトレンド追跡指標を組み合わせて,市場の逆転点を効果的に識別し,トレンドを追跡し,安定した収益を実現します.具体的メリットとしては以下の通りです.
123の反転形は高い勝率と利益率を持ち,短期的な反転の機会を効果的に識別することができる.
SMI指標は,機関資金の流れを反映し,機関資金がより安定した利益を得ることを追跡します.
逆転形状とトレンド追跡指標を使用すると,信号の質を向上させ,不必要な取引を削減し,リスクを効果的に制御できます.
戦略リスク
この戦略にはいくつかのリスクがあり,以下のような部分に重点を置いています.
123反転形には一定の偽信号リスクがあり,完全には損失を回避できない取引である。パラメータを適切に最適化して信号品質を向上させることができる。
SMI指標には一定の遅れがあるため,資金の流れを完全にリアルタイムで反映することはできません.他の指標と組み合わせて検証することができ,精度が向上します.
二重信号は,過度に保守的な問題をもたらし,より強い一方的なトレンドの状況を逃す可能性があります. 信号条件を適切に緩和し,フィルタリング基準を低下させることができます.
最適化の方向
この戦略は,次のいくつかの点でさらに最適化できます.
パラメータを最適化し,最適なパラメータの組み合わせを探し,戦略の収益性を向上させる.
単一損失を効率的に制御するための損失防止メカニズムの追加.
他の指標や形状と組み合わせて,信号の質をさらに検証し,信号の精度を向上させる.
異なる品種に合わせてパラメータを最適化し,戦略の適応性を向上させる.
要約する
戦略の全体的な考え方は明確で,反転形状とトレンド追跡指標を効果的に組み合わせることで,短期的な反転機会を安定的に識別し,中長期のトレンドを追跡できます.パラメータの最適化とメカニズム設計の改善により,戦略の収益性とリスク管理能力をさらに強化できます.
Overview
The main idea of this strategy is to combine the 123 reversal pattern and the Smart Money Index (SMI) indicator to achieve stable trend tracking trading. The strategy will only establish corresponding long or short positions when both signals issue buy or sell signals at the same time.
Strategy Principle
The strategy consists of two parts:
123 reversal strategy: This strategy implements reversal trading based on the closing price of the stock and the 9-day Stoch indicator. Specifically, go short when the closing price relationship reverses for two consecutive days (i.e. the previous closing price is higher than the one before the previous day, and the next closing price is lower than the previous day), and Stoch fast line is above slow line; go long when the closing price relationship reverses for two consecutive days (i.e. the previous closing price is lower than the one before the previous day, and the next closing price is higher than the previous day), and Stoch fast line is below slow line.
SMI strategy: This strategy implements trend tracking based on the Smart Money Index. The SMI indicator can reflect the game between institutional funds and retail funds. The rise of SMI indicates that institutional funds are absorbing funds, while the fall indicates that institutional funds are selling out. Go long when SMI rises and go short when SMI falls.
The strategy will only take a long position when both the 123 reversal pattern and the SMI indicator issue a buy signal at the same time. It will only take a short position when both issue a sell signal at the same time.
Strategy Advantages
The strategy combines reversal patterns and trend tracking indicators to effectively identify market reversal points and track trends for steady profits. The specific advantages are as follows:
The 123 reversal pattern has a relatively high win rate and profit rate, which can effectively identify short-term reversal opportunities.
The SMI indicator can reflect the direction of institutional funds. Tracking institutional funds can obtain more steady profits.
The combined use of reversal patterns and trend tracking indicators can improve the quality of signals, reduce unnecessary trading, and effectively control risks.
Strategy Risks
The strategy also has some risks, mainly concentrated in the following areas:
The 123 reversal pattern has a certain risk of false signals and cannot completely avoid losing trades. Parameters can be optimized appropriately to improve signal quality.
The SMI indicator has a certain lag and cannot completely reflect the direction of funds in real time. Other indicators can be combined for verification to improve accuracy.
Double signals can lead to over-conservative problems, possibly missing stronger one-sided trending opportunities. Signal conditions can be appropriately relaxed to reduce filtering criteria.
Optimization Directions
The strategy can also be further optimized in the following aspects:
Optimize parameters to find the optimal parameter combination and improve the profitability of the strategy.
Add stop loss mechanisms to effectively control single loss.
Combine other indicators or patterns to further verify signal quality and improve signal accuracy.
Optimize parameters separately for different varieties to improve the adaptability of the strategy.
Summary
The overall idea of the strategy is clear, effectively combining reversal patterns and trend tracking indicators to steadily identify short-term reversal opportunities and track medium-to-long term trends. By improving parameters optimization and mechanism design, the profitability and risk control capabilities of the strategy can be further enhanced.
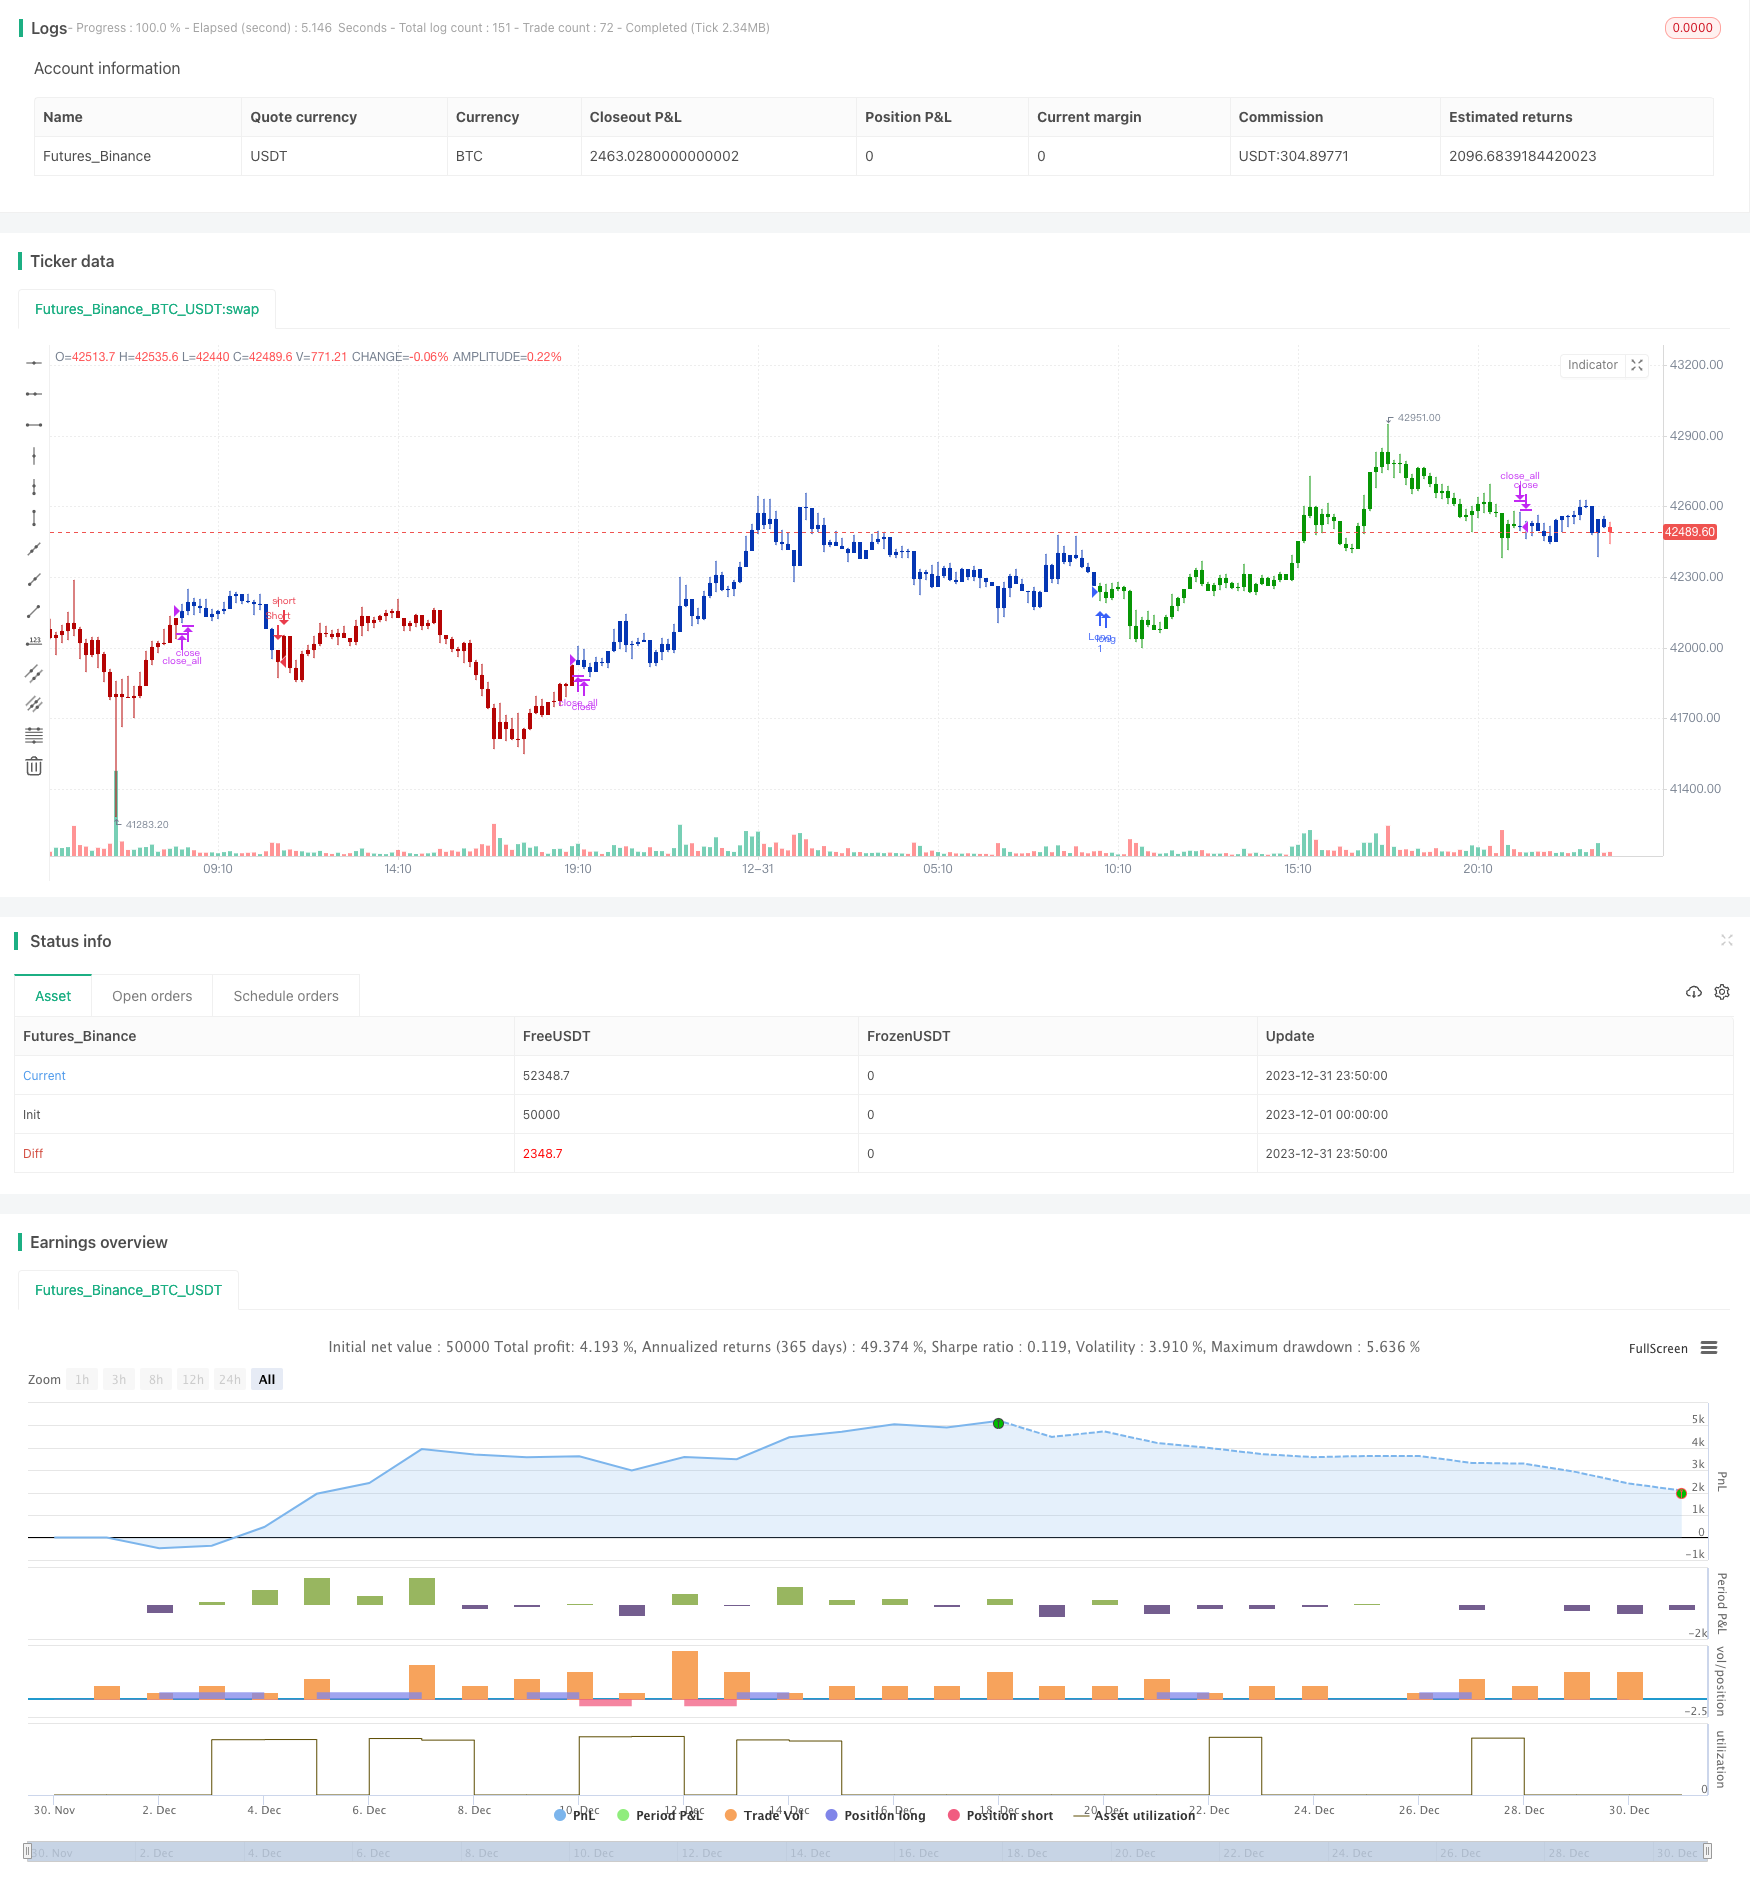
/*backtest
start: 2023-12-01 00:00:00
end: 2023-12-31 23:59:59
period: 10m
basePeriod: 1m
exchanges: [{"eid":"Futures_Binance","currency":"BTC_USDT"}]
*/

//@version=4
////////////////////////////////////////////////////////////
//  Copyright by HPotter v1.0 10/07/2021
// This is combo strategies for get a cumulative signal.
//
// First strategy
// This System was created from the Book "How I Tripled My Money In The
// Futures Market" by Ulf Jensen, Page 183. This is reverse type of strategies.
// The strategy buys at market, if close price is higher than the previous close
// during 2 days and the meaning of 9-days Stochastic Slow Oscillator is lower than 50.
// The strategy sells at market, if close price is lower than the previous close price
// during 2 days and the meaning of 9-days Stochastic Fast Oscillator is higher than 50.
//
// Second strategy
// Smart money index (SMI) or smart money flow index is a technical analysis indicator demonstrating investors sentiment.
// The index was invented and popularized by money manager Don Hays.[1] The indicator is based on intra-day price patterns.
// The main idea is that the majority of traders (emotional, news-driven) overreact at the beginning of the trading day
// because of the overnight news and economic data. There is also a lot of buying on market orders and short covering at the opening.
// Smart, experienced investors start trading closer to the end of the day having the opportunity to evaluate market performance.
// Therefore, the basic strategy is to bet against the morning price trend and bet with the evening price trend. The SMI may be calculated
// for many markets and market indices (S&P 500, DJIA, etc.)
//
// The SMI sends no clear signal whether the market is bullish or bearish. There are also no fixed absolute or relative readings signaling
// about the trend. Traders need to look at the SMI dynamics relative to that of the market. If, for example, SMI rises sharply when the
// market falls, this fact would mean that smart money is buying, and the market is to revert to an uptrend soon. The opposite situation
// is also true. A rapidly falling SMI during a bullish market means that smart money is selling and that market is to revert to a downtrend
// soon. The SMI is, therefore, a trend-based indicator.
// Some analysts use the smart money index to claim that precious metals such as gold will continually maintain value in the future.
//
// WARNING:
// - For purpose educate only
// - This script to change bars colors.
////////////////////////////////////////////////////////////
Reversal123(Length, KSmoothing, DLength, Level) =>
    vFast = sma(stoch(close, high, low, Length), KSmoothing)
    vSlow = sma(vFast, DLength)
    pos = 0.0
    pos := iff(close[2] < close[1] and close > close[1] and vFast < vSlow and vFast > Level, 1,
	         iff(close[2] > close[1] and close < close[1] and vFast > vSlow and vFast < Level, -1, nz(pos[1], 0)))
	pos


SMI(Length, tf) =>
    pos = 0.0
    nRes = 0.0
    xcloseH1 = security(syminfo.tickerid, tf, close[1])
    xopenH1 =  security(syminfo.tickerid, tf, open[1])
    nRes := nz(nRes[1], 1) - (open - close) + (xopenH1 - xcloseH1)
    xSmaRes = sma(nRes, Length)
    pos:= iff(xSmaRes > nRes, 1,
           iff(xSmaRes < nRes, -1, nz(pos[1], 0)))
    pos

strategy(title="Combo Backtest 123 Reversal & Smart Money Index (SMI)", shorttitle="Combo", overlay = true)
line1 = input(true, "---- 123 Reversal ----")
Length = input(14, minval=1)
KSmoothing = input(1, minval=1)
DLength = input(3, minval=1)
Level = input(50, minval=1)
//-------------------------
line2 = input(true, "---- Smart Money Index (SMI) ----")
LengthSMI = input(18, minval=1)
res = input(title="Resolution", type=input.resolution, defval="D")
reverse = input(false, title="Trade reverse")
posReversal123 = Reversal123(Length, KSmoothing, DLength, Level)
posSMI = SMI(LengthSMI, res)
pos = iff(posReversal123 == 1 and posSMI == 1 , 1,
	   iff(posReversal123 == -1 and posSMI == -1, -1, 0))
possig = iff(reverse and pos == 1, -1,
          iff(reverse and pos == -1 , 1, pos))
if (possig == 1 )
    strategy.entry("Long", strategy.long)
if (possig == -1 )
    strategy.entry("Short", strategy.short)
if (possig == 0)
    strategy.close_all()
barcolor(possig == -1 ? #b50404: possig == 1 ? #079605 : #0536b3 )