RSIロングショートダイバージェンスインジケーター取引戦略
概要
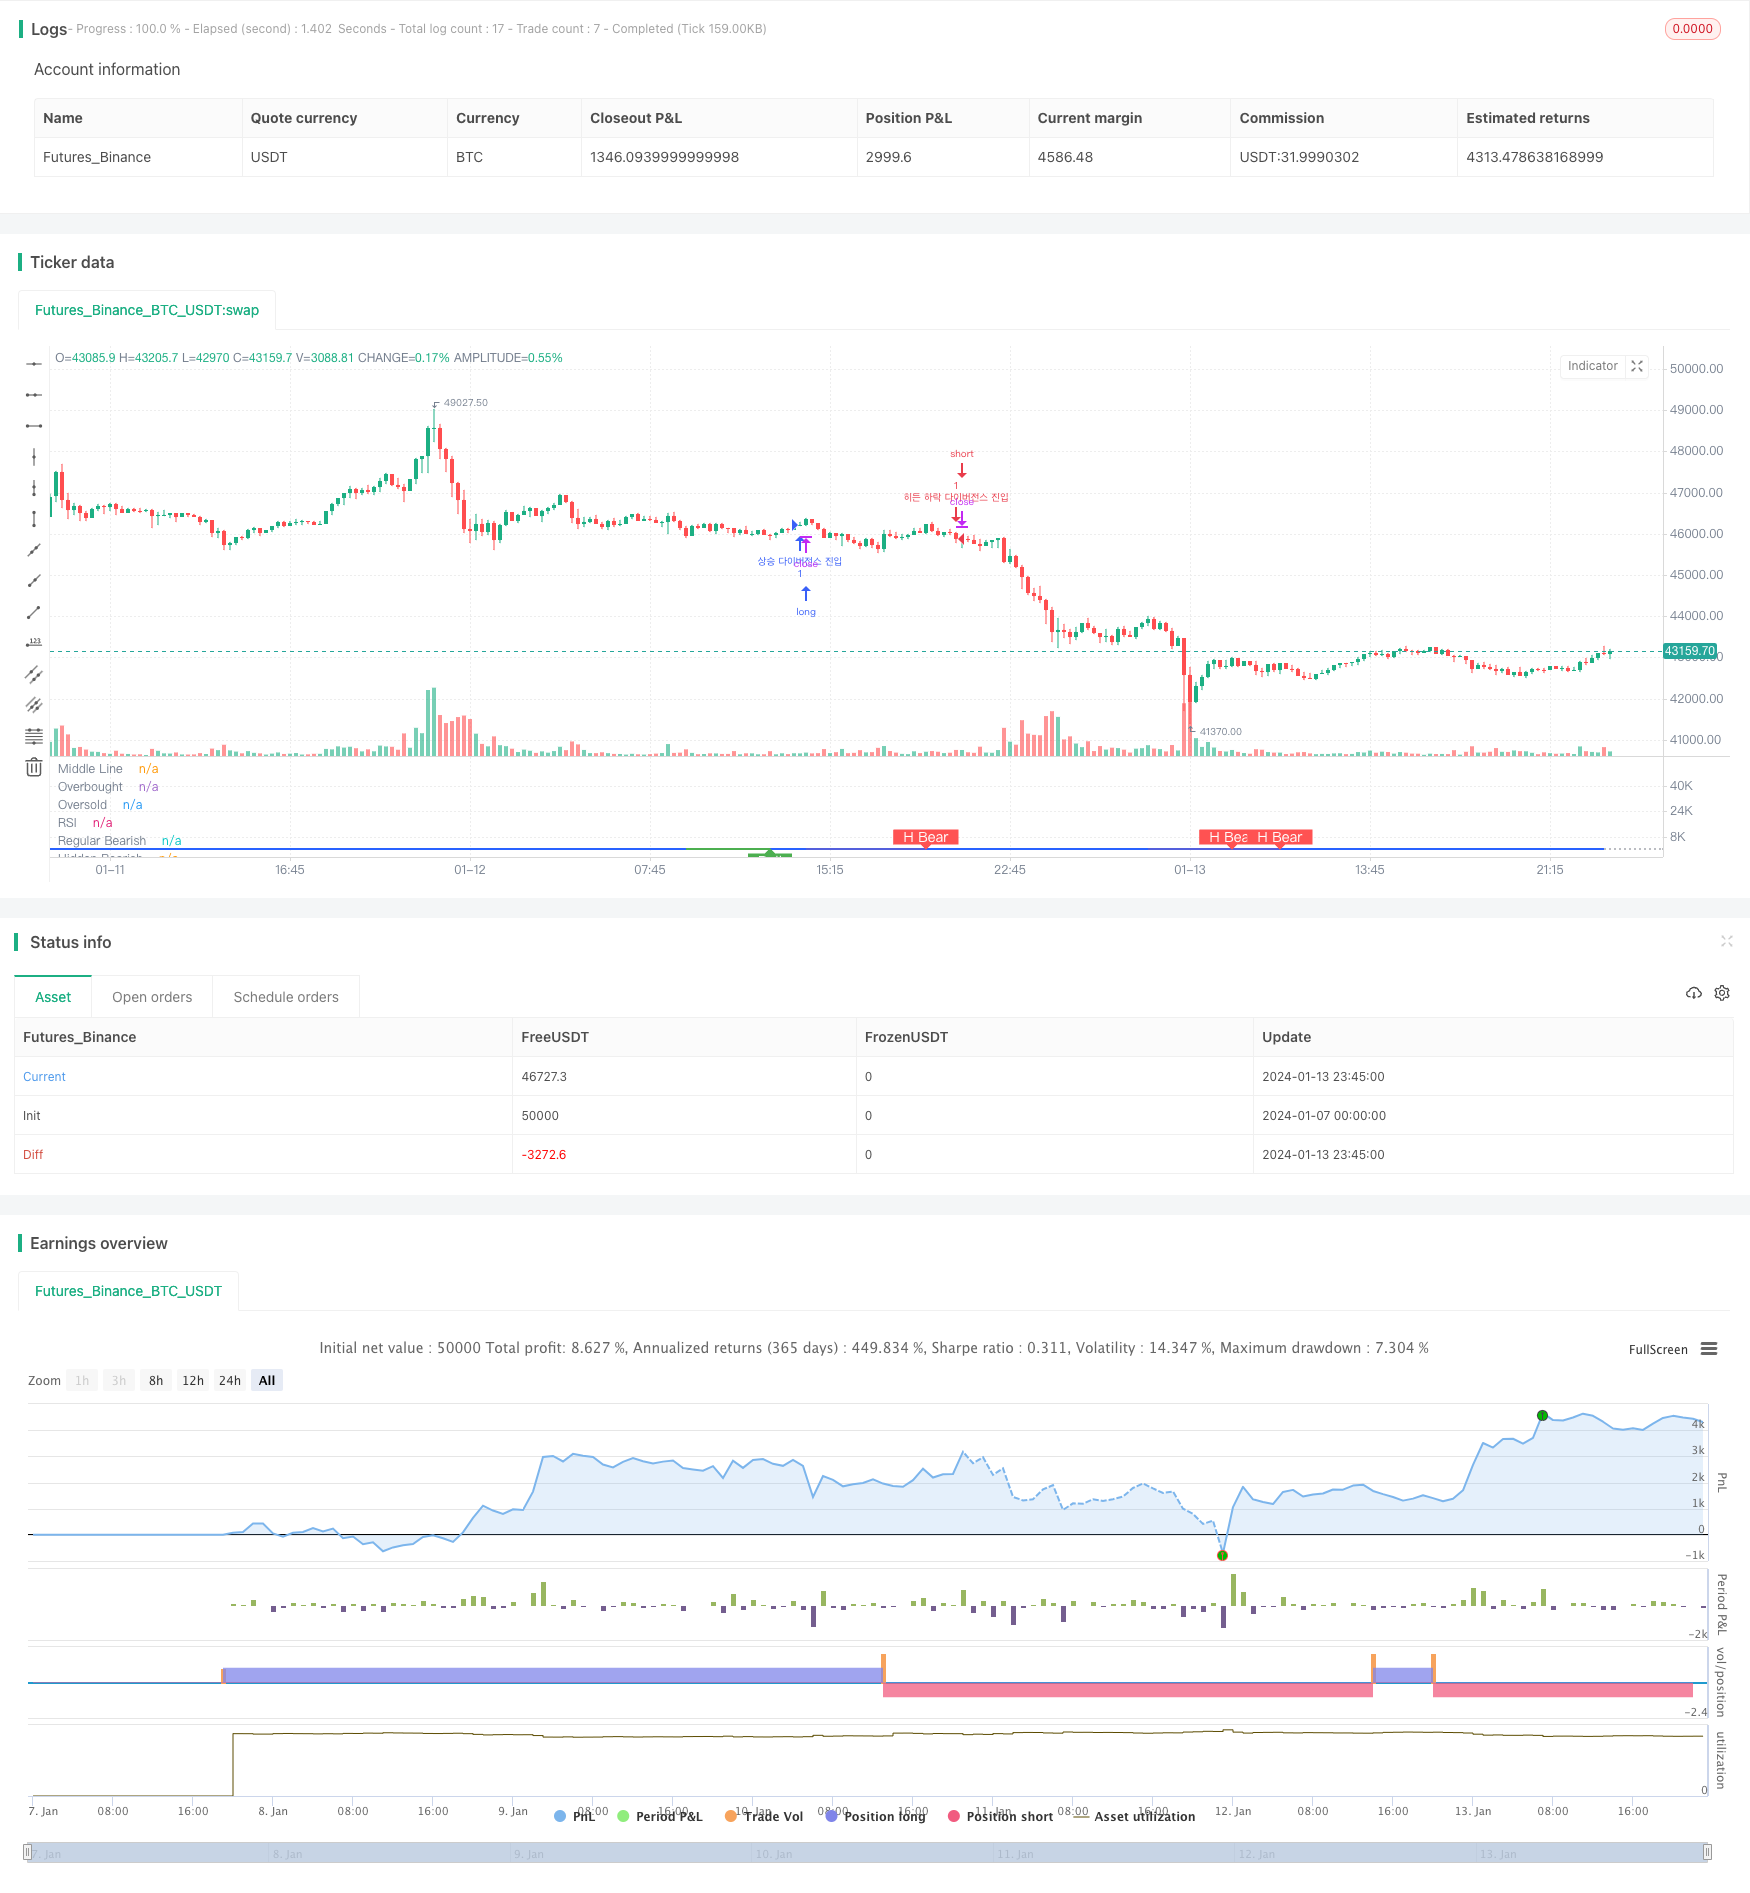
この戦略は,RSI指標の多空差を計算して市場の多空傾向を判断し,取引決定を行う.具体的には,RSIが低点を形成し,価格がより高い低点を形成するときに隠された多頭信号として判断し,RSIが高点を形成し,価格がより低い高点を形成するときに隠された空頭信号として判断する.これらの信号に基づいて,市場の潜在的な多空傾向を判断し,取引を行う.
戦略原則
この戦略は,主にRSI指標の多空分岐理論に基づいています. RSIと価格が逆転分岐を形成すると,市場が潜在的に逆転することを予告します.具体的には以下の4つの状況に分かれています.
正常な多頭シグナル:RSIがより高い低点を形成し,価格はより低い低点を形成する.これは,買い手がRSIを上昇させたが,価格に完全に反映されていないことを示し,多頭力の強化を予兆する.
隠された多頭シグナル:RSIがより低い低点を形成し,価格はより高い低点を形成する.これは,売り上げがRSIを下げているが,価格に完全に反映されていないことを示し,多頭力が増加することを予兆する.
正常空頭シグナル:RSIがより低い高点を形成し,価格がより高い高点を形成する.これは,売り上げが価格を上昇させたが,完全にはRSIに反映されていないことを示し,空頭力が強化されたことを示している.
隠された空頭シグナル:RSIがより高い高点を形成し,価格がより低い高点を形成する.これは,買い手がRSIを推し上げているが,価格に完全に反映されていないことを示し,空頭力の強化を予兆する.
市場における潜在的空白の傾向と,買い売り力の強化を判断して,取引戦略を策定する.
戦略的優位性
- RSIの多空分岐理論を用いて,市場の潜在的傾向を判断する.
- 価格の動きを確認して,騒音信号を回避する.
- 市場が急激に逆転する前には重要なシグナルを捉え,予測を先行して判断する.
- 視覚化された多空信号提示を実現し,操作が簡単で直感的です.
- 異なる市場環境に対応するカスタマイズ可能なパラメータ
戦略リスク
- RSI指数と価格の相違は必ずしも逆転を予兆するものではなく,正常な整合状態である可能性があります.
- 隠された信号は比較的大きなノイズで,誤判を起こす可能性があります.
- 信号の確認には,より多くの指標や技術分析の方法が必要です.
- 信号のパラメータを正しく設定しないことも判断に影響を与える.
最適化の方向
- MACD,KDJなどの指標をRSI指標と組み合わせて,エントリーシグナル信号を決定する.
- 損失を抑える戦略を導入し,単一損失を削減する.
- 適したRSI周期パラメータの検索など,パラメータの設定を最適化します.
- エントリー信号の正確性を判断する機械学習アルゴリズムを追加する.
- 信号確認の遅延を減らすために,websocketのリアルタイム動作を追加します.
要約する
この戦略は,主にRSIの多空差を頼りに市場の潜在的多空傾向を判断し,価格運動における買取取引の相対力の変化を捕捉し,予測を反転取引する. 特定の先駆的予測機能がある. しかし,一定のノイズシグナルリスクもある. パラメータ最適化,指標組合せ,機械学習などの方法によって戦略の安定性と収益性をさらに強化することができる.
/*backtest
start: 2024-01-07 00:00:00
end: 2024-01-14 00:00:00
period: 15m
basePeriod: 5m
exchanges: [{"eid":"Futures_Binance","currency":"BTC_USDT"}]
*/

//@version=5
strategy(title="Divergence Indicator")
len = input.int(title="RSI Period", minval=1, defval=20)
src = input(title="RSI Source", defval=close)
lbR = input(title="Pivot Lookback Right", defval=5)
lbL = input(title="Pivot Lookback Left", defval=5)
rangeUpper = input(title="Max of Lookback Range", defval=60)
rangeLower = input(title="Min of Lookback Range", defval=5)
plotBull = input(title="Plot Bullish", defval=true)
plotHiddenBull = input(title="Plot Hidden Bullish", defval=true)
plotBear = input(title="Plot Bearish", defval=true)
plotHiddenBear = input(title="Plot Hidden Bearish", defval=true)
bearColor = color.red
bullColor = color.green
hiddenBullColor = color.new(color.green, 80)
hiddenBearColor = color.new(color.red, 80)
textColor = color.white
noneColor = color.new(color.white, 100)
osc = ta.rsi(src, len)

plot(osc, title="RSI", linewidth=2, color=#2962FF)
hline(50, title="Middle Line", color=#787B86, linestyle=hline.style_dotted)
obLevel = hline(70, title="Overbought", color=#787B86, linestyle=hline.style_dotted)
osLevel = hline(30, title="Oversold", color=#787B86, linestyle=hline.style_dotted)
fill(obLevel, osLevel, title="Background", color=color.rgb(33, 150, 243, 90))

plFound = na(ta.pivotlow(osc, lbL, lbR)) ? false : true
phFound = na(ta.pivothigh(osc, lbL, lbR)) ? false : true
_inRange(cond) =>
	bars = ta.barssince(cond == true)
	rangeLower <= bars and bars <= rangeUpper

//------------------------------------------------------------------------------
// Regular Bullish
// Osc: Higher Low

oscHL = osc[lbR] > ta.valuewhen(plFound, osc[lbR], 1) and _inRange(plFound[1])

// Price: Lower Low

priceLL = low[lbR] < ta.valuewhen(plFound, low[lbR], 1)
// bull : 상승 Condition : 조건
bullCond = plotBull and priceLL and oscHL and plFound // 상승다이버전스?
strategy.entry("상승 다이버전스 진입", strategy.long, when = bullCond)
// strategy.close("상승 다이버전스 진입", when = ta.crossover(osc, 70))
plot(
     plFound ? osc[lbR] : na,
     offset=-lbR,
     title="Regular Bullish",
     linewidth=2,
     color=(bullCond ? bullColor : noneColor)
     )

plotshape(
	 bullCond ? osc[lbR] : na,
	 offset=-lbR,
	 title="Regular Bullish Label",
	 text=" Bull ",
	 style=shape.labelup,
	 location=location.absolute,
	 color=bullColor,
	 textcolor=textColor
	 )

//------------------------------------------------------------------------------
// Hidden Bullish
// Osc: Lower Low

oscLL = osc[lbR] < ta.valuewhen(plFound, osc[lbR], 1) and _inRange(plFound[1])

// Price: Higher Low

priceHL = low[lbR] > ta.valuewhen(plFound, low[lbR], 1)
hiddenBullCond = plotHiddenBull and priceHL and oscLL and plFound
strategy.entry("히든 상승 다이버전스 진입", strategy.long, when = hiddenBullCond)
// strategy.close("히든 상승 다이버전스 진입", when = ta.crossover(osc, 70))
plot(
	 plFound ? osc[lbR] : na,
	 offset=-lbR,
	 title="Hidden Bullish",
	 linewidth=2,
	 color=(hiddenBullCond ? hiddenBullColor : noneColor)
	 )

plotshape(
	 hiddenBullCond ? osc[lbR] : na,
	 offset=-lbR,
	 title="Hidden Bullish Label",
	 text=" H Bull ",
	 style=shape.labelup,
	 location=location.absolute,
	 color=bullColor,
	 textcolor=textColor
	 )

//------------------------------------------------------------------------------
// Regular Bearish
// Osc: Lower High

oscLH = osc[lbR] < ta.valuewhen(phFound, osc[lbR], 1) and _inRange(phFound[1])

// Price: Higher High

priceHH = high[lbR] > ta.valuewhen(phFound, high[lbR], 1)
// bear : 하락
bearCond = plotBear and priceHH and oscLH and phFound
strategy.entry("하락 다이버전스 진입", strategy.short, when = bearCond)
// strategy.close("하락 다이버전스 진입", when = ta.crossunder(osc, 50))
plot(
	 phFound ? osc[lbR] : na,
	 offset=-lbR,
	 title="Regular Bearish",
	 linewidth=2,
	 color=(bearCond ? bearColor : noneColor)
	 )

plotshape(
	 bearCond ? osc[lbR] : na,
	 offset=-lbR,
	 title="Regular Bearish Label",
	 text=" Bear ",
	 style=shape.labeldown,
	 location=location.absolute,
	 color=bearColor,
	 textcolor=textColor
	 )

//------------------------------------------------------------------------------
// Hidden Bearish
// Osc: Higher High

oscHH = osc[lbR] > ta.valuewhen(phFound, osc[lbR], 1) and _inRange(phFound[1])

// Price: Lower High

priceLH = high[lbR] < ta.valuewhen(phFound, high[lbR], 1)

hiddenBearCond = plotHiddenBear and priceLH and oscHH and phFound
strategy.entry("히든 하락 다이버전스 진입", strategy.short, when = hiddenBearCond)
// strategy.close("히든 하락 다이버전스 진입", when = ta.crossunder(osc, 50))
plot(
	 phFound ? osc[lbR] : na,
	 offset=-lbR,
	 title="Hidden Bearish",
	 linewidth=2,
	 color=(hiddenBearCond ? hiddenBearColor : noneColor)
	 )

plotshape(
	 hiddenBearCond ? osc[lbR] : na,
	 offset=-lbR,
	 title="Hidden Bearish Label",
	 text=" H Bear ",
	 style=shape.labeldown,
	 location=location.absolute,
	 color=bearColor,
	 textcolor=textColor
	 )