MACDインジケーターを使用したRSI反転戦略
作成日:
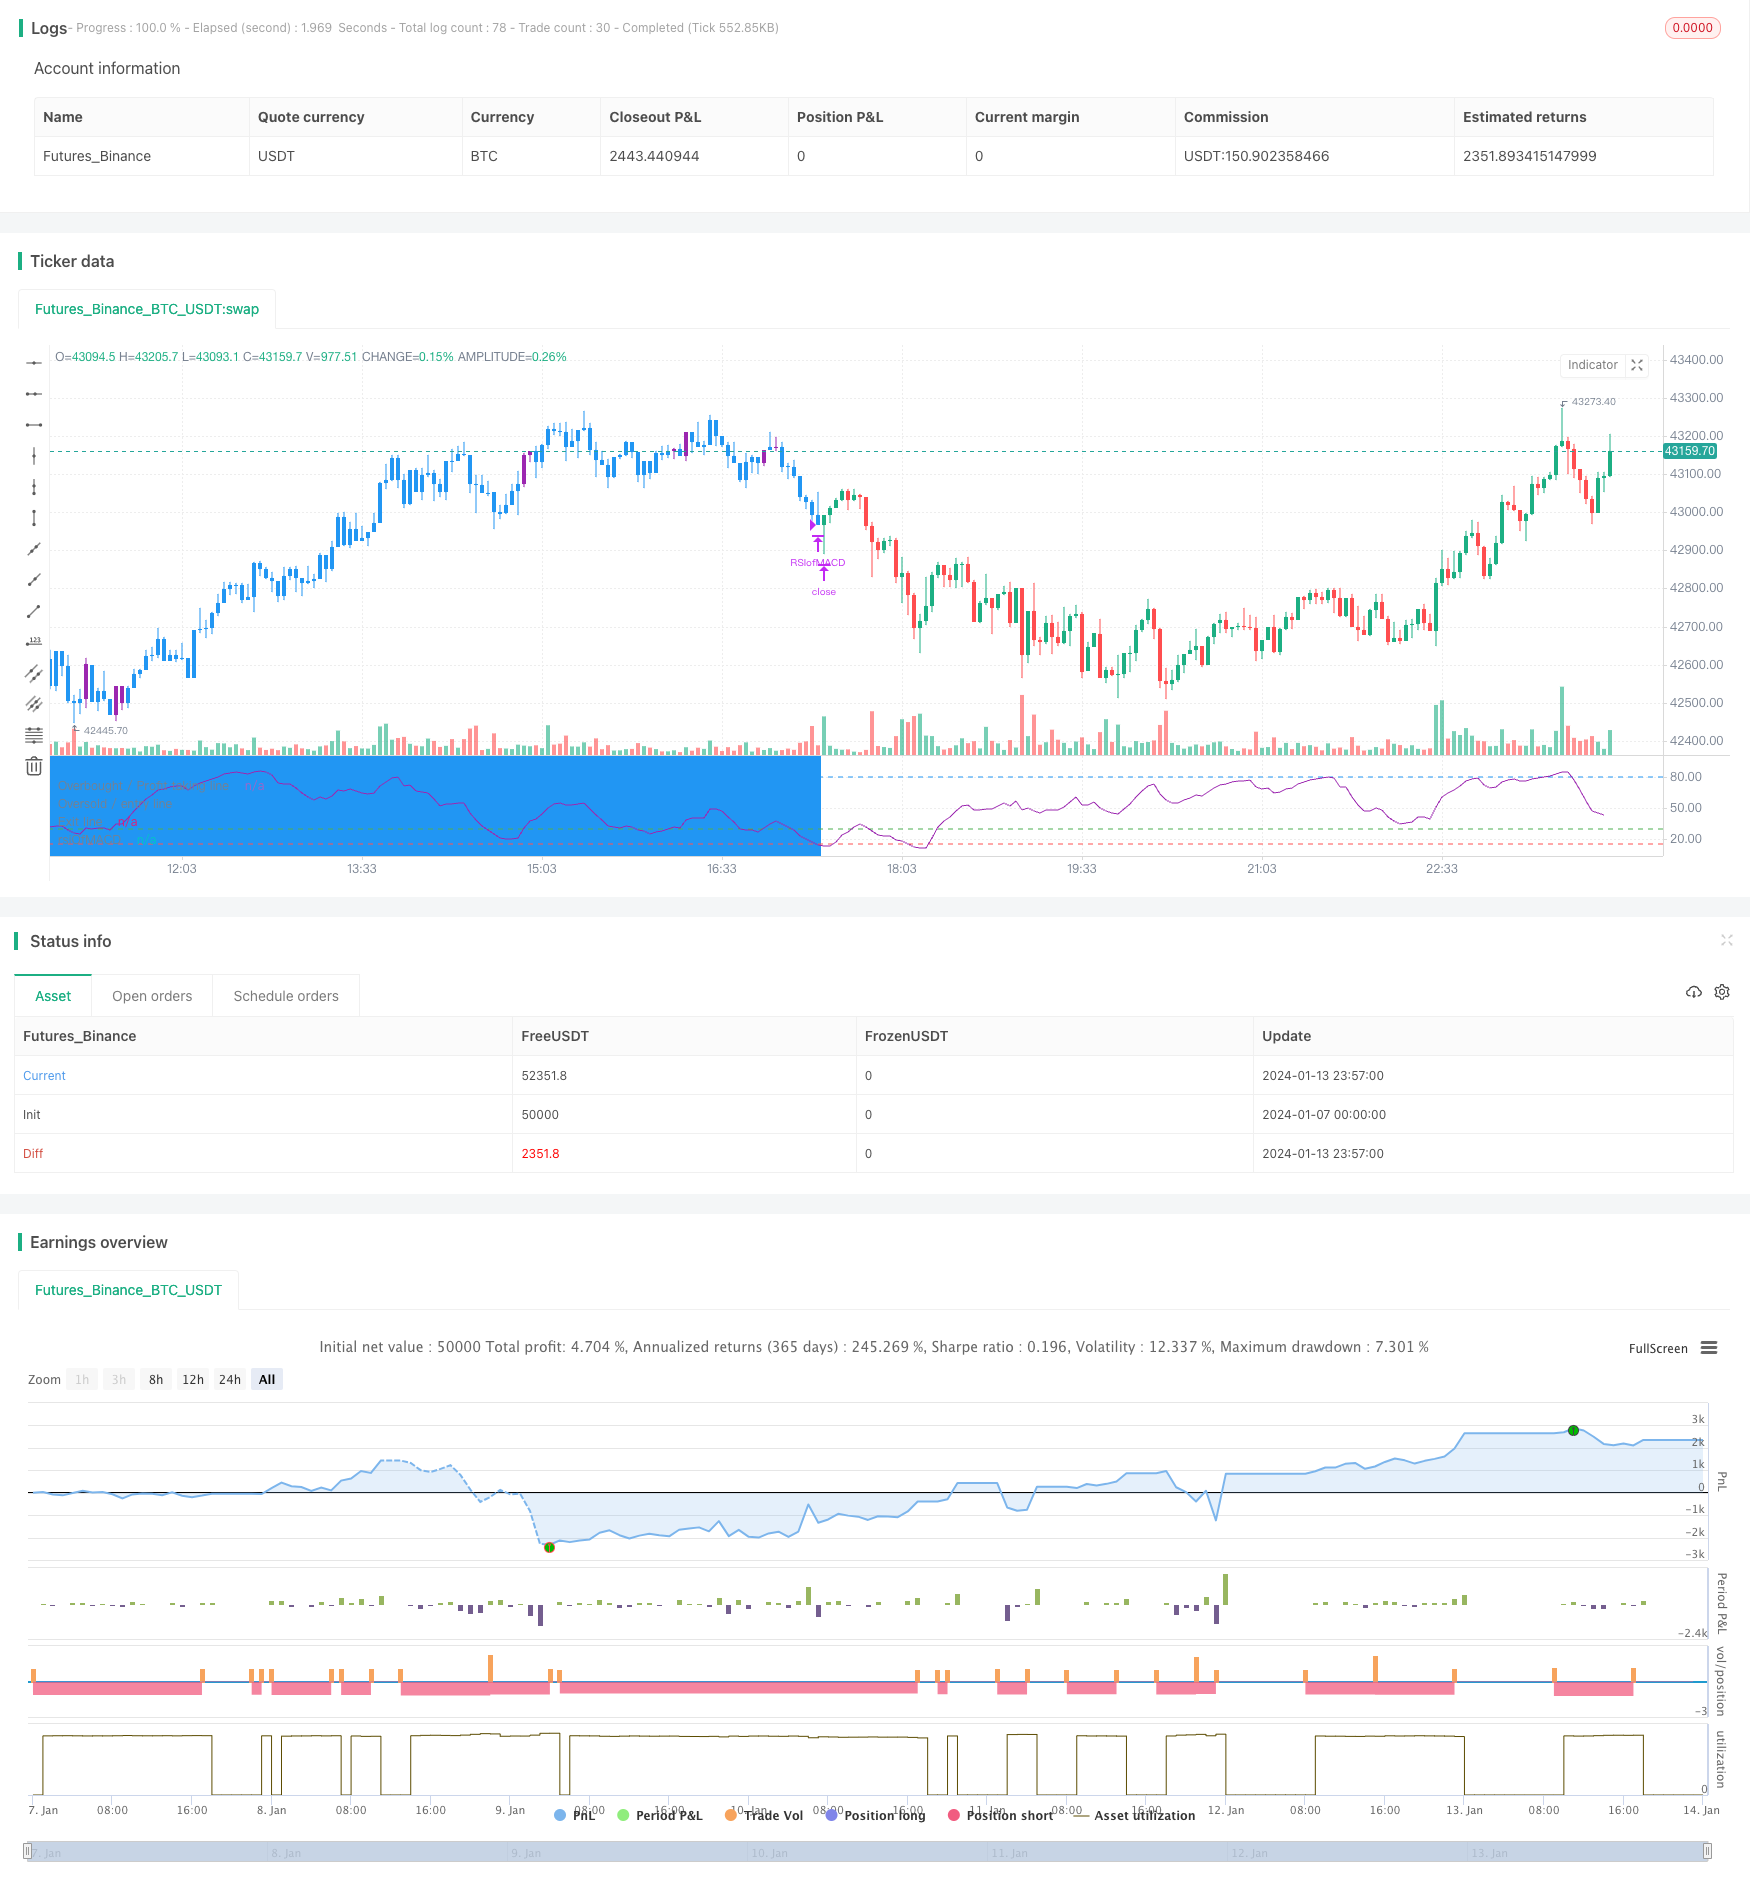
2024-01-15 12:33:14
最終変更日:
2024-01-15 12:33:14
コピー:
0
クリック数:
939
1
フォロー
1750
フォロワー
概要
この戦略は,MACD指標のRSI値に基づいて買入と売却のシグナルを判断する. RSI値が超買線または超売り区間を超えると買入し,RSI値が超売り区間を下回るとストップまたはストップする.
戦略原則
この戦略は,MACD指数とRSI指数の優位性を組み合わせている.
まず,DIF線,DEA線,MACD線を含む3つの曲線を計算し,MACD線上でRSIを計算し,MACDのRSIを形成します.
RSI of MACDの指標が30または35を超えた時,買入シグナルが生じ,MACD線が超売区に入ると,株価のトレンドは反転し始めます. RSI of MACDの指標が15を超えた時,売りシグナルが生じ,トレンド反転が終了しました.
この戦略はまた,部分ストップを設定し,RSI of MACDの指標が80を超えると,この超買区は,部分ポジションを売り,部分利益をロックすることができる.
優位分析
- MACDの指数でトレンドの逆転を判断する
- RSI指標を用いて過買過売領域を判断する
- この2つの指標を組み合わせて,購入・販売のポイントを正確に特定します.
- 損失拡大を防ぐ部分停止を設定する
リスク分析
- MACD指数パラメータの設定が不適切で,トレンドを正確に判断できない
- RSI指標のパラメータが正しく設定されていないため,過買過売を正確に判断することはできません.
- ストップ設定が激しすぎて,もっと大きな上昇を逃しているかもしれない.
解決策は
- MACDパラメータを最適化して,最適なパラメータの組み合わせを見つけます.
- RSIパラメータを最適化し,精度を向上させる
- 適切な部分的緩和により,より大きな利益を追求する
最適化の方向
この戦略は以下の方向から最適化できます.
- 減価償却策を強化し,下落リスクをさらに抑制する
- ポジション管理モジュールを追加し,価格に合わせてポジションを拡大します.
- 機械学習モデルを統合し,過去データ訓練を利用し,購入・販売の判断の精度をさらに向上させる
- 15分や5分といった短い周期で実行してみて,戦略の頻度をさらに高めましょう.
要約する
この戦略の全体的な設計思いは明確であり,中心的な考え方は,MACDの反転とRSIのフィルタリングを組み合わせて,買入点の判断である.パラメータ最適化,ストップ・ロズ・マネジメント,リスク・コントロールなどの手段によって,非常に実用的な量化取引戦略にすることができます.
ストラテジーソースコード
/*backtest
start: 2024-01-07 00:00:00
end: 2024-01-14 00:00:00
period: 3m
basePeriod: 1m
exchanges: [{"eid":"Futures_Binance","currency":"BTC_USDT"}]
*/

// This source code is subject to the terms of the Mozilla Public License 2.0 at https://mozilla.org/MPL/2.0/
// © mohanee

//@version=4

strategy(title="RSI of MACD Strategy[Long only]",  shorttitle="RSIofMACD" , overlay=false, pyramiding=1,     default_qty_type=strategy.percent_of_equity,  default_qty_value=20, initial_capital=10000, currency=currency.USD)  //default_qty_value=10, default_qty_type=strategy.fixed,


/////////////////////////////////////////////////////////////////////////////////


// MACD Inputs ///
fastLen = input(12, title="Fast Length")
slowLen = input(21, title="Slow Length")
sigLen  = input(9, title="Signal Length")

rsiLength  = input(14, title="RSI of MACD Length")


riskCapital = input(title="Risk % of capital", defval=10, minval=1)
stopLoss=input(3,title="Stop Loss",minval=1)

takeProfit=input(false, title="Take Profit")


[macdLine, signalLine, _] = macd(close, fastLen, slowLen, sigLen)

rsiOfMACD = rsi(macdLine, rsiLength)
emaSlow = ema(close, slowLen)


//drawings
/////////////////////////////////////////////////////////////////////////////////


obLevelPlot = hline(80, title="Overbought / Profit taking line",  color=color.blue , linestyle=hline.style_dashed)
osLevelPlot = hline(30, title="Oversold / entry line", color=color.green, linestyle=hline.style_dashed)

exitLinePlot = hline(15, title="Exit line", color=color.red, linestyle=hline.style_dashed)


plot(rsiOfMACD, title = "rsiOfMACD" ,  color=color.purple)


//drawings
/////////////////////////////////////////////////////////////////////////////////


//Strategy Logic
/////////////////////////////////////////////////////////////////////////////////

//Entry--
//Echeck how many units can be purchased based on risk manage ment and stop loss
qty1 = (strategy.equity  * riskCapital / 100 ) /  (close*stopLoss/100)

//check if cash is sufficient  to buy qty1  , if capital not available use the available capital only
qty1:= (qty1 * close >= strategy.equity ) ? (strategy.equity / close) : qty1


strategy.entry(id="RSIofMACD", long=true,   qty=qty1,  when =  ( crossover(rsiOfMACD, 30) or crossover(rsiOfMACD, 35)  ) and close>=emaSlow )


bgcolor(abs(strategy.position_size)>=1 ? color.blue : na , transp=70)


barcolor(abs(strategy.position_size)>=1 and  ( crossover(rsiOfMACD, 30) or crossover(rsiOfMACD, 35) ) ? color.purple : abs(strategy.position_size)>=1 ? color.blue : na  )


//partial exit
strategy.close(id="RSIofMACD", comment="PExit Profit is "+tostring(close - strategy.position_avg_price,  "###.##")  ,  qty=strategy.position_size/3, when= takeProfit and abs(strategy.position_size)>=1 and close > strategy.position_avg_price and crossunder(rsiOfMACD,80) )

//Close All
strategy.close(id="RSIofMACD", comment="Close All   Profit is "+tostring(close - strategy.position_avg_price,  "###.##"), when=abs(strategy.position_size)>=1 and crossunder(rsiOfMACD,15) ) //and close > strategy.position_avg_price )


//Strategy Logic
/////////////////////////////////////////////////////////////////////////////////