二重移動平均クロスオーバーに基づくプルバックエントリー戦略
概要 概要
EintSimple Pullback Strategyは,双移動平均の交差に基づくリコールエントリー戦略である.この戦略は,まず,長期と短期の2つの移動平均を使用し,短期移動平均が長期移動平均を下から突破すると買入シグナルを生成する.休日突破をフィルターするために,この戦略は,長期移動平均より高い閉盘価格も要求する.
入場後,価格が短期移動平均線から再び下落した場合,btcは退出信号を体現する.さらに,この戦略は,オフフィールドのストップを設定し,最高点からの撤回幅が設定されたストップのパーセントに達した場合,ポジションを退出する.
戦略論理
この戦略は,主に双動平均の黄金の交差点を基に入場のタイミングを判断する.具体的には,以下の条件を同時に満たす必要がある.
- 終盤は長期移動平均 (ma1) よりも大きい
- 閉店価格は短期移動平均より低いma2
- 現在持っていない
この戦略は,上記の条件を満たすと,全力で実行されます.
退出シグナルの判断は,価格が短期移動平均を再び下落させるとか,最高点の引き戻し幅から設定されたストップロスの割合である,という2つの条件に基づいています.具体的退出条件は以下のとおりです.
- 閉店価格は短期移動平均より大きい
- 設定された最大ポイントの止損率から最大ポイントの止損率まで
退出条件のいずれかが満たされた場合,この戦略は,すべての多項を平らにする.
Advantages 優位性分析について
双動平均の交差を用い,実物閉盘価格判断と組み合わせて,偽突破を効果的にフィルターすることができる.
リコール入場は,株価が短期的なターニングを形成した後に入場することができる.
ストップ・ダメージの設定により,最大撤退を制限できます.
リスク分析
双移動平均の交差策は,複数の取引信号を生成しやすく,上昇と低下を追う可能性があります.
移動平均のパラメータを正しく設定しない場合,曲線が滑らかすぎたり,過度に敏感になる可能性があります.
ストップ・ロスの設定が緩やかすぎると,損失が拡大する.
オプティマイゼーション
異なる長さの長短移動平均のパラメータの組み合わせをテストし,最適なパラメータを見つけます.
閉盤価格と典型的な価格を使用して移動平均の交差を判断する効果を比較テスト.
取引量や波動性指標などのフィルターを追加するテスト.
停止幅の回測を最適化して,最適な設定を見つけます.
結論 結論
EintSimple Pullback Strategyは,シンプルで実用的な二重移動平均の逆戻り戦略である.移動平均の指示機能を有効に活用し,実体閉盘価格判断と組み合わせて偽信号をフィルタリングする.この戦略は,頻繁に取引し,高殺低を追跡する問題を引き起こすが,パラメータの最適化とフィルターの追加によってさらに完善することができる.全体的に,この戦略は,量化取引の初心者の実践と最適化に非常に適した戦略である.
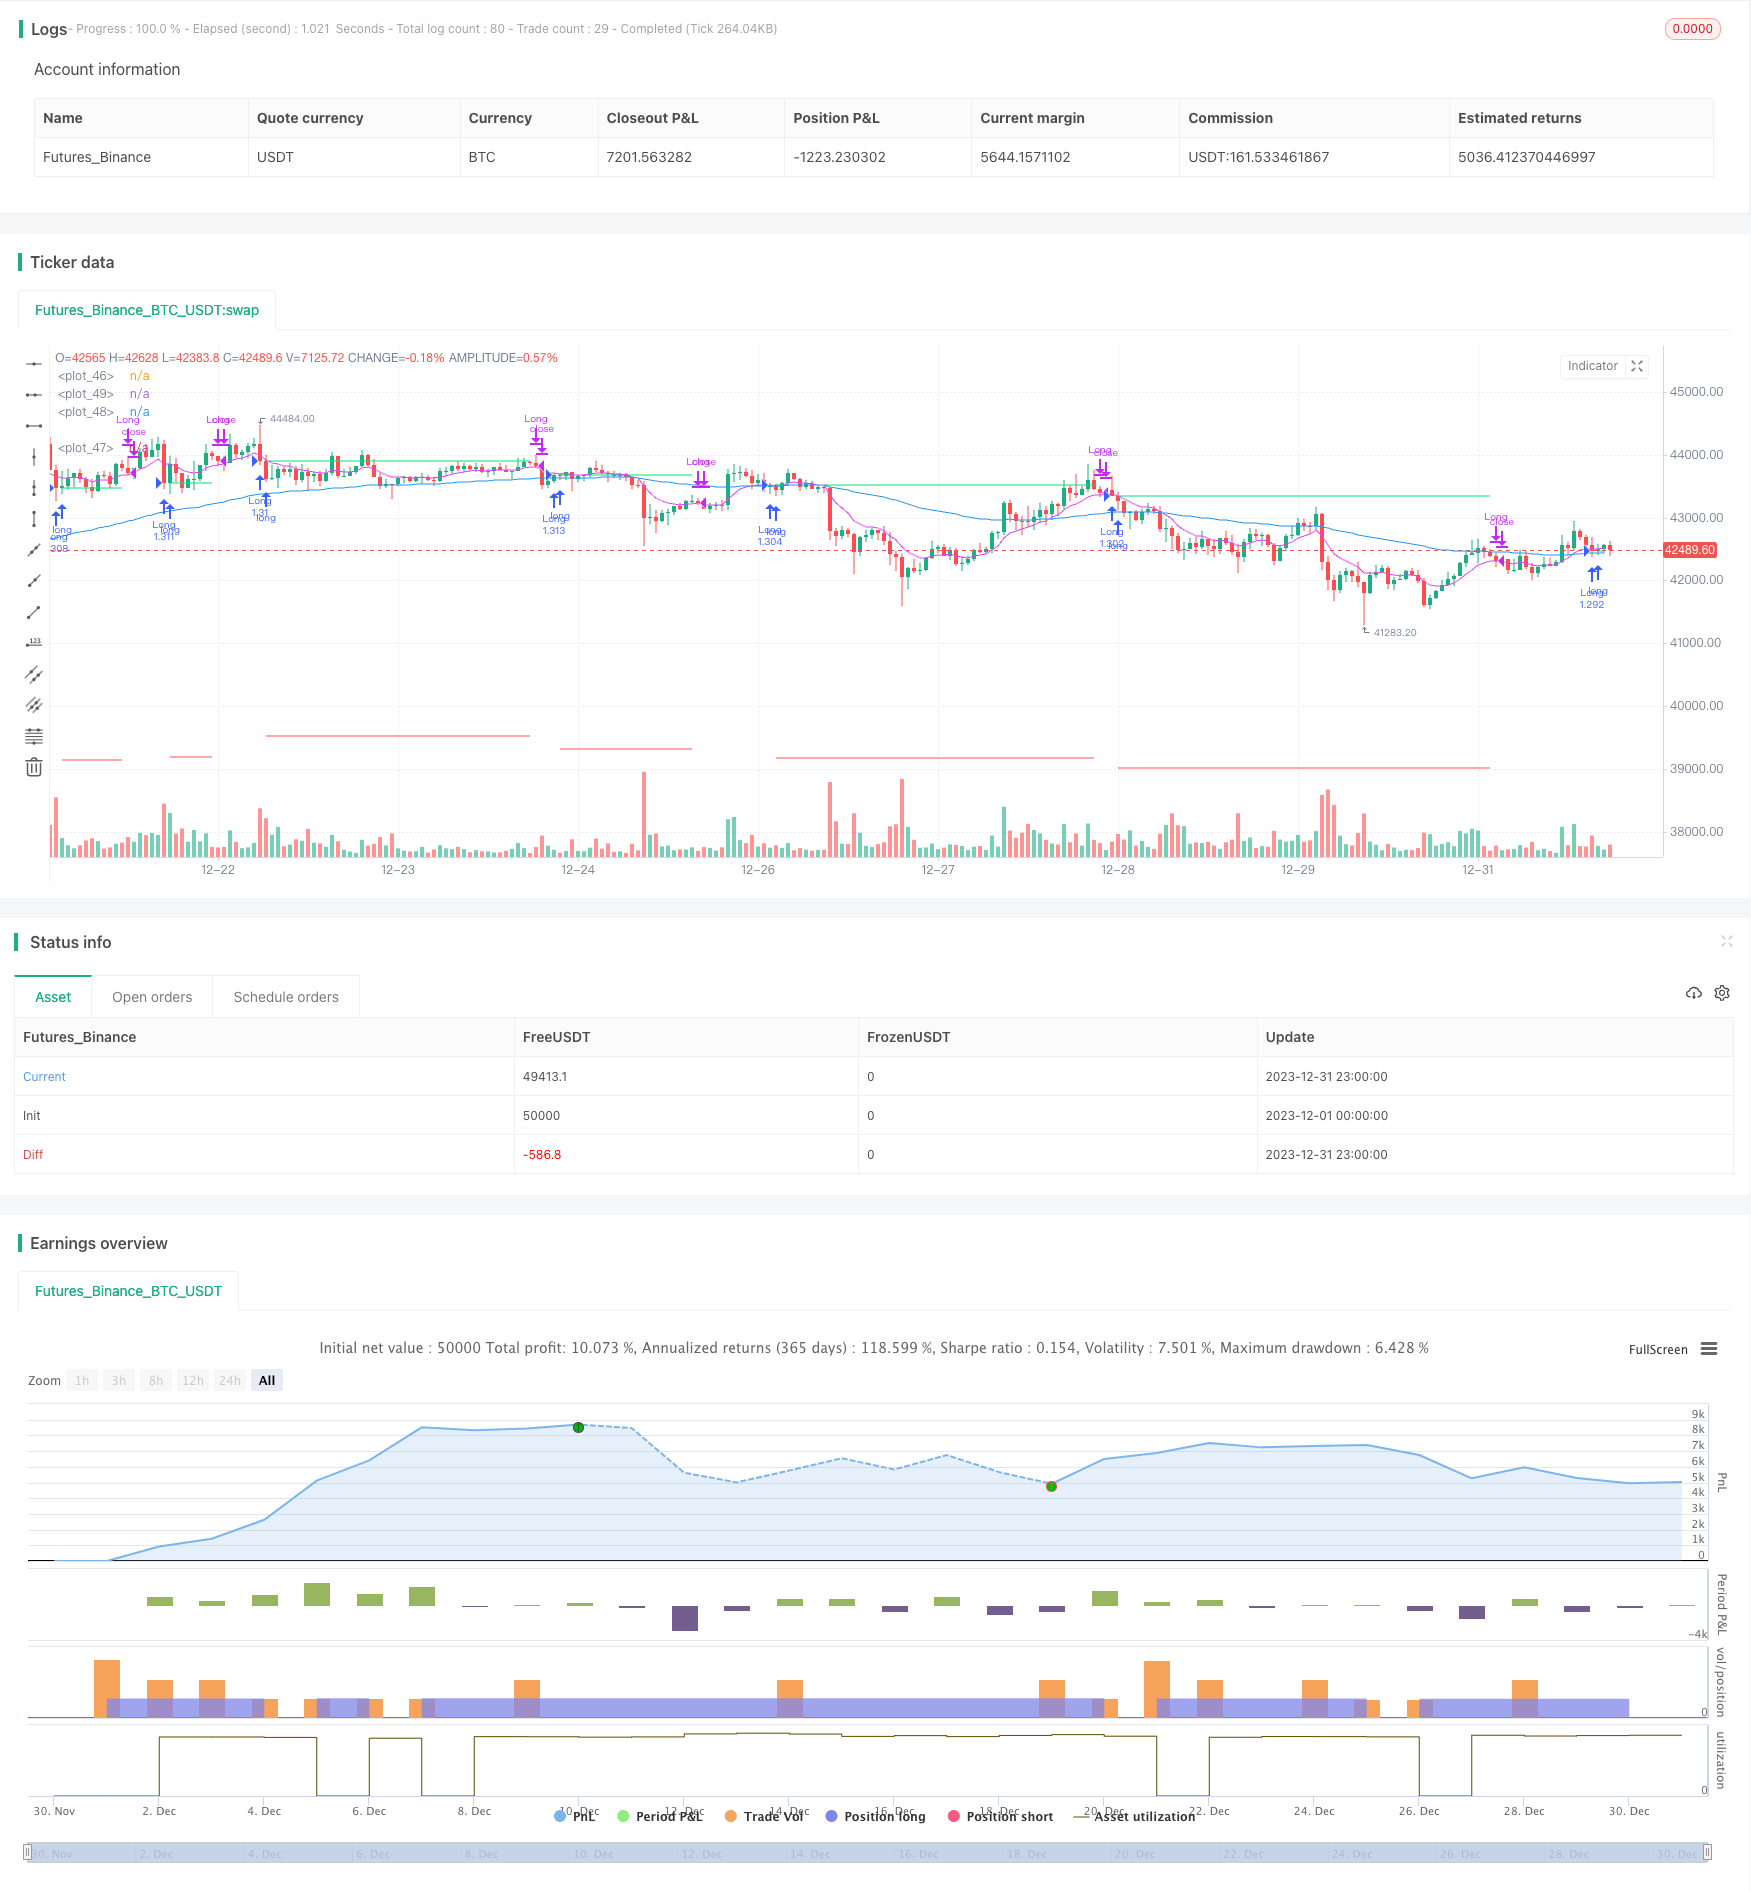
/*backtest
start: 2023-12-01 00:00:00
end: 2023-12-31 23:59:59
period: 1h
basePeriod: 15m
exchanges: [{"eid":"Futures_Binance","currency":"BTC_USDT"}]
*/

// This source code is subject to the terms of the Mozilla Public License 2.0 at https://mozilla.org/MPL/2.0/
// © ZenAndTheArtOfTrading / www.PineScriptMastery.com
// @version=5
strategy("Simple Pullback Strategy",
     overlay=true,
     initial_capital=50000,
     default_qty_type=strategy.percent_of_equity,
     default_qty_value=100)// 100% of balance invested on each trade

// Get user input
i_ma1           = input.int(title="MA 1 Length", defval=75, step=1, group="Strategy Parameters", tooltip="Long-term EMA")
i_ma2           = input.int(title="MA 2 Length", defval=9, step=1, group="Strategy Parameters", tooltip="Short-term EMA")
i_stopPercent   = input.float(title="Stop Loss Percent", defval=0.10, step=0.1, group="Strategy Parameters", tooltip="Failsafe Stop Loss Percent Decline")
i_lowerClose    = input.bool(title="Exit On Lower Close", defval=true, group="Strategy Parameters", tooltip="Wait for a lower-close before exiting above MA2")
i_startTime     = input(title="Start Filter", defval=timestamp("01 Jan 1995 13:30 +0000"), group="Time Filter", tooltip="Start date & time to begin searching for setups")
i_endTime       = input(title="End Filter", defval=timestamp("1 Jan 2099 19:30 +0000"), group="Time Filter", tooltip="End date & time to stop searching for setups")

// Get indicator values
ma1 = ta.ema(close, i_ma1)
ma2 = ta.ema(close, i_ma2)

// Check filter(s)
f_dateFilter = true

// Check buy/sell conditions
var float buyPrice = 0
buyCondition    = close > ma1 and close < ma2 and strategy.position_size == 0 and f_dateFilter
sellCondition   = close > ma2 and strategy.position_size > 0 and (not i_lowerClose or close < low[1])
stopDistance    = strategy.position_size > 0 ? ((buyPrice - close) / close) : na
stopPrice       = strategy.position_size > 0 ? buyPrice - (buyPrice * i_stopPercent) : na
stopCondition   = strategy.position_size > 0 and stopDistance > i_stopPercent

// Enter positions
if buyCondition
    strategy.entry(id="Long", direction=strategy.long)

if buyCondition[1]
    buyPrice := open

// Exit positions
if sellCondition or stopCondition
    strategy.close(id="Long", comment="Exit" + (stopCondition ? "SL=true" : ""))
    buyPrice := na

// Draw pretty colors
plot(buyPrice, color=color.lime, style=plot.style_linebr)
plot(stopPrice, color=color.red, style=plot.style_linebr, offset=-1)
plot(ma1, color=color.blue)
plot(ma2, color=color.fuchsia)