SSL に基づく移動平均トレンドフォロー戦略
概要
この戦略は,SSL通道指標を用いて市場動向を判断し,均線を基準としてトレンドフォローする戦略である.これは中長線の4時間線と日線に適用される.
戦略原則
SSLチャネルは,ケルター平均線と実振幅で構成されている。それは,市場のトレンド方向を判断することができる。価格が上線を突破すると,看板信号であり,下線を突破すると,看板信号である。
策略はEMAなどの平均線指標を利用して,基準平均線を計算する.この平均線は,部分的な偽突破をフィルターすることができる.
策略は,価格がSSL上位線を突破したときに多めにし,価格がSSL下位線を突破したときに空きをする. 上位トレンドで追いつき,下位トレンドで knifeを抄写する.
ストップ・ロスの方法には,ストップ・パーセンテージ,ATR・ストップ,最低価格/最高価格・ストップを振り返る.ストップ・ストップはストップ・ロスのN倍である.具体的パラメータはユーザーによって決定される.
優位分析
SSLチャネルは,トレンドの方向を正確に判断し,偽信号を減らす.均線結成と協力して,入札の根拠として,追尾殺底を避ける.
市場状況の広い範囲に適応するために,異なる種類の平均線を柔軟に選択できます.
ストップダメージの方法は柔軟で,リスクは制御できます. ストップダメージの倍数も,異なる好みを満たすために柔軟に設定できます.
市場における両方向の機会を最大限に活用するために,同時に空き時間を増やすことができます.
リスク分析
平均線指標は遅滞しており,累積的な損失が発生する可能性があります.
震動の動きは,軌道上下を突破すると,反転が起こり,簡単に引っ張られる.
ATRと回顧ストップは,異常突破時に過度に緩やかになり,損失が拡大する可能性があります.
リスク対策:
- 均線パラメータを適切に調整するか,または他のタイプの均線を選択する.
- ストップ・ダメージの幅を拡大して ストップ・ダメージをタイムリーに
- ATRに倍数因子を加えるか,回顧周期を調整する.
最適化の方向
- 平均線指標の種類をテストし,最適なパラメータを見つけます.
- ATR周期パラメータを最適化する.
- 異なる止損倍数パラメータをテストする.
- のリスク係数をテストする.
要約する
この戦略は,SSLのトレンド判断と均線指標の確認を統合して,効率的にトレンドフォローすることができます. リスクを制御しながら,より高い収益を得るために,柔軟な停止と停止方法を提供します. 継続的にテストし,パラメータを最適化することで,より良い取引パフォーマンスを得ることができます.
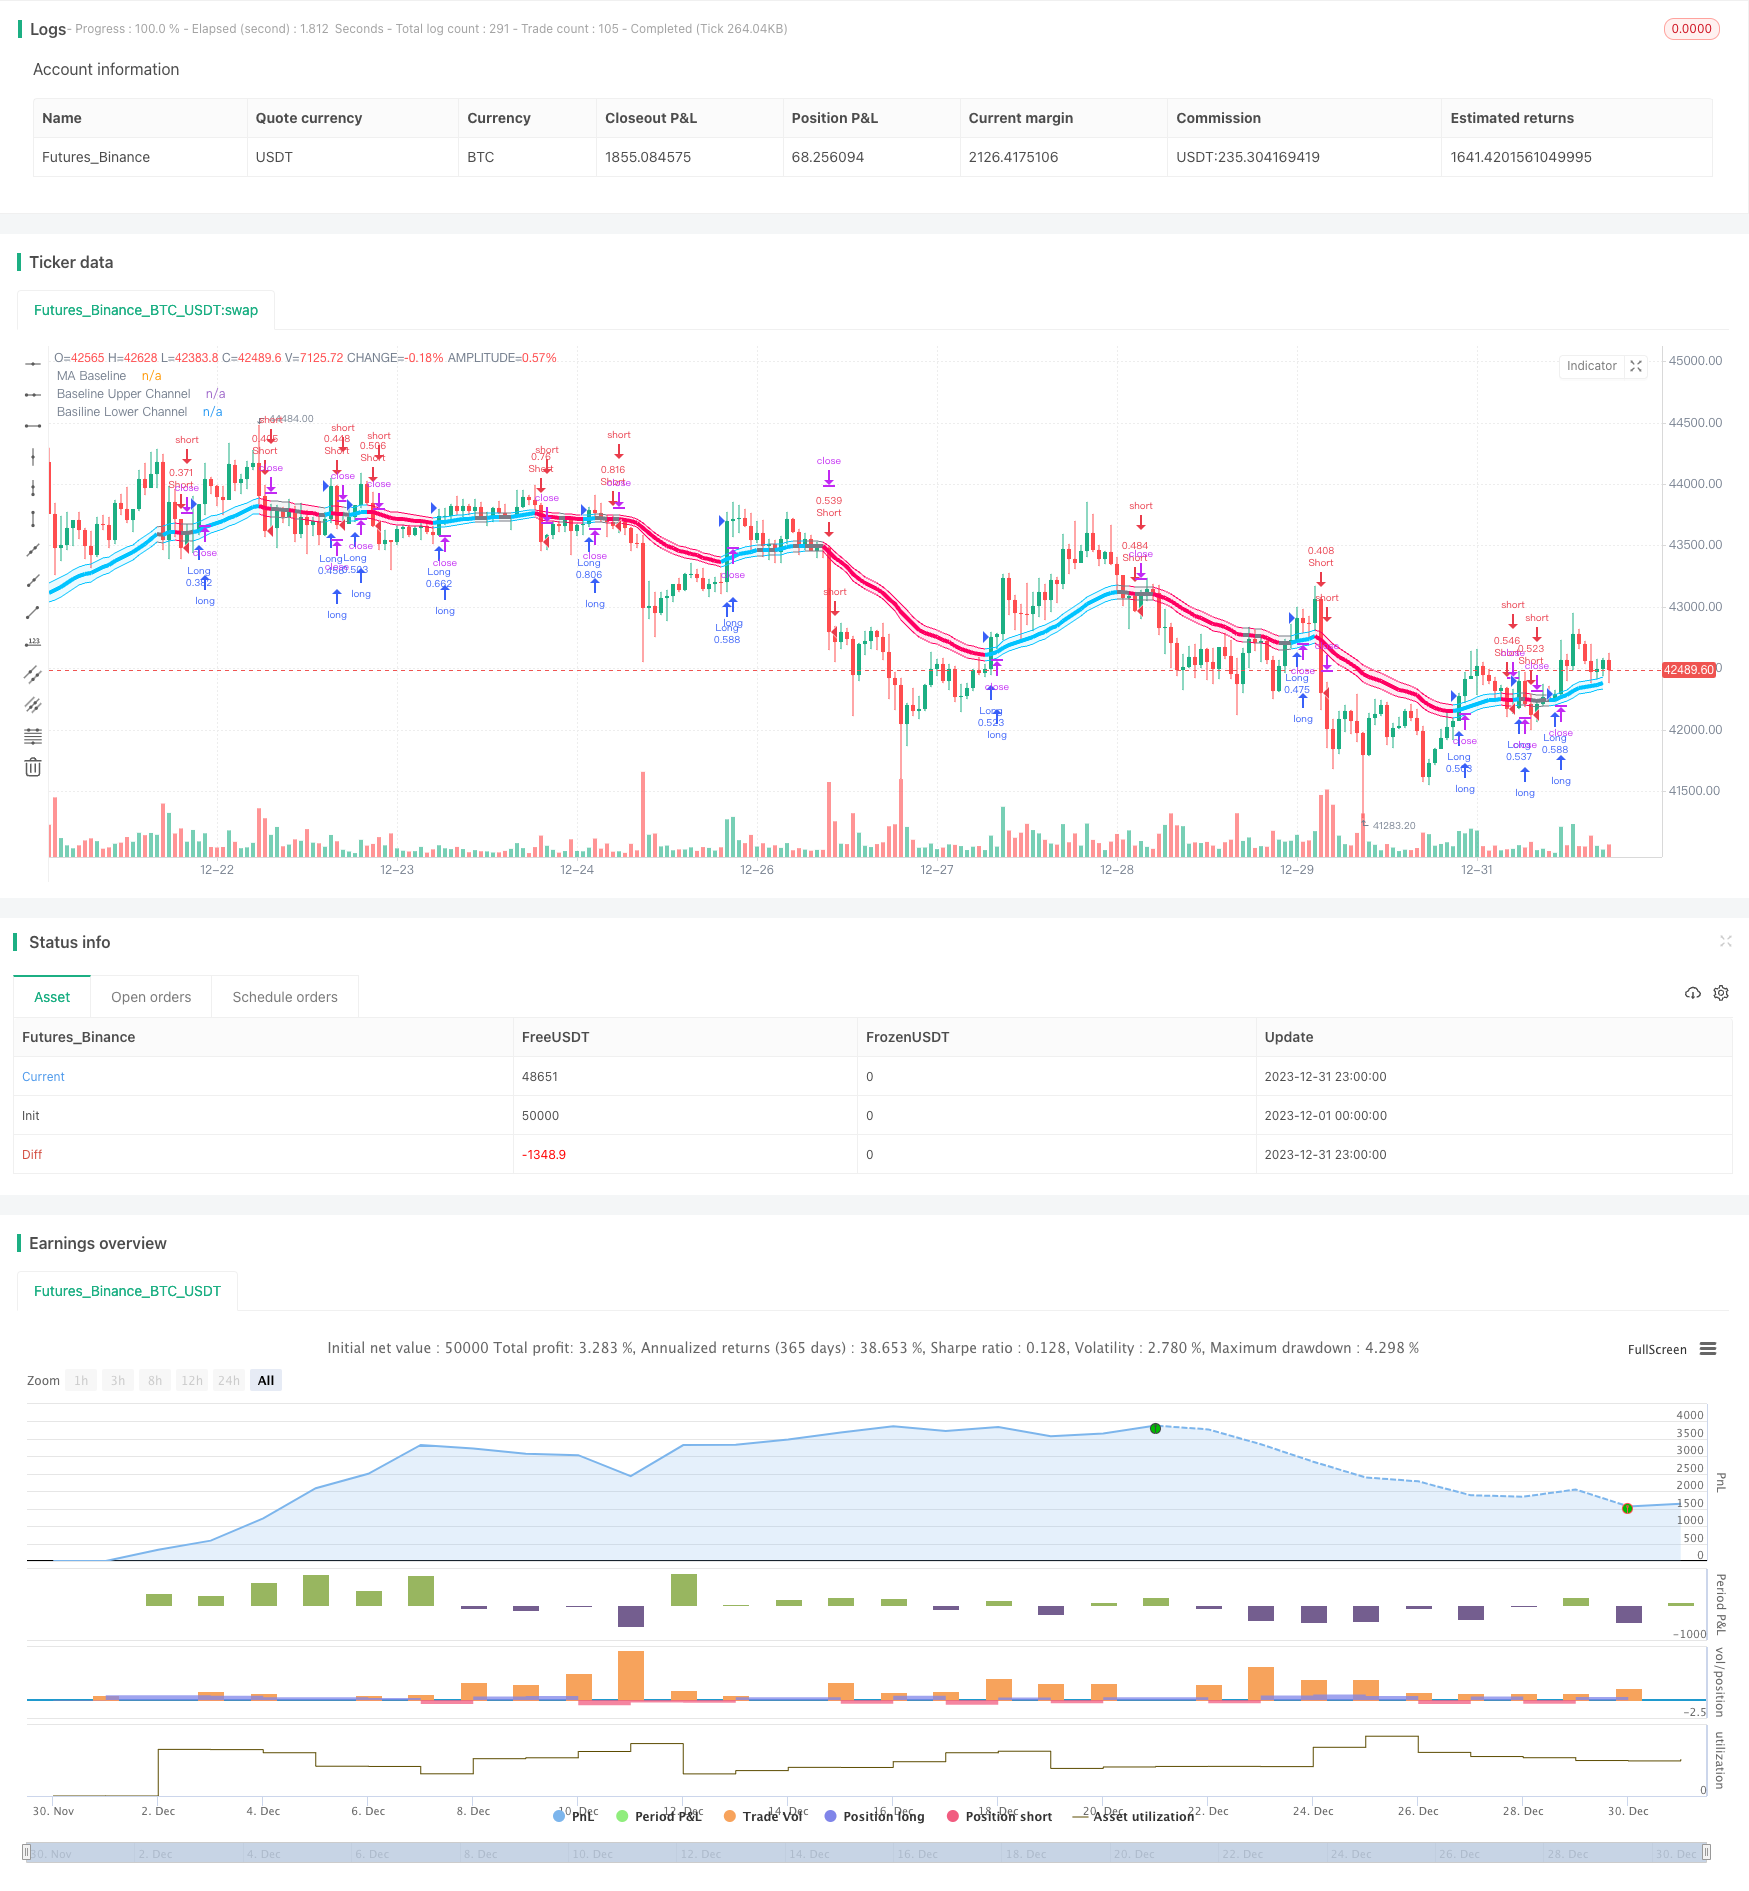
/*backtest
start: 2023-12-01 00:00:00
end: 2023-12-31 23:59:59
period: 1h
basePeriod: 15m
exchanges: [{"eid":"Futures_Binance","currency":"BTC_USDT"}]
*/

// This source code is subject to the terms of the Mozilla Public License 2.0 at https://mozilla.org/MPL/2.0/
// Thanks to @kevinmck100 for opensource strategy template and @Mihkel00 for SSL Hybrid
// @fpemehd
// @version=5
strategy(title = '[fpemehd] SSL Baseline Strategy',
      shorttitle = '[f] SSL',
      overlay = true)

// # ========================================================================= #
// #                                Inputs
// # ========================================================================= #

// 1. Time
i_start                 = input (defval = timestamp("20 Jan 1990 00:00 +0900"), title = "Start Date", tooltip = "Choose Backtest Start Date", inline = "Start Date", group = "Time" )
i_end                   = input (defval = timestamp("20 Dec 2030 00:00 +0900"), title = "End Date", tooltip = "Choose Backtest End Date", inline = "End Date", group = "Time" )
inDateRange             = true


// 2. Inputs for direction: Long? Short? Both?
// i_longEnabled           = input.bool(defval = true , title = "Long?", tooltip = "Enable Long Position Trade?", inline = "1", group = "Long / Short" )
// i_shortEnabled          = input.bool(defval = true , title = "Short?", tooltip = "Enable Short Position Trade?", inline = "1", group = "Long / Short" )

// 3. Shared inputs for Long and Short
//// 3-1. Inputs for Stop Loss Type: ATR or Percent?
i_slType                = input.string (defval = "ATR", title = "SL Type ", group = "Strategy: Stop Loss Conditions", options = ["Percent", "ATR", "Previous LL / HH"], tooltip = "Stop Loss based on %? ATR?", inline = "1")
i_slPercent             = input.float (defval = 3, title = "SL % ",             group = "Strategy: Stop Loss Conditions", inline = "2")
i_slAtrLength           = input.int (14, "SL ATR Length ",                      group = "Strategy: Stop Loss Conditions", inline = "3", minval = 0, maxval = 10000)
i_slAtrMultiplier       = input.float (4,    "SL ATR Multiplier",               group = "Strategy: Stop Loss Conditions",    inline = "3", minval = 0, step = 0.1,     tooltip = "Length of ATR used to calculate Stop Loss. \nSize of StopLoss is determined by multiplication of ATR value. Take Profit is derived from this also by multiplying the StopLoss value by the Risk:Reward multiplier.")
i_slLookBack            = input.int(30,   "Lowest Price Before Entry",          group = "Strategy: Stop Loss Conditions",    inline = "4", minval = 30, step = 1,     tooltip = "Lookback to find the Lowest Price. \nStopLoss is determined by the Lowest price of the look back period. Take Profit is derived from this also by multiplying the StopLoss value by the Risk:Reward multiplier.")

//// 3-2. Inputs for Quantity & Risk Manangement: Take Profit
i_riskReward            = input.float(2,    "Risk : Reward  Ratio ",            group = "Strategy: Risk Management",    inline = "1", minval = 0, step = 0.1,     tooltip = "Previous high or low (long/short dependant) is used to determine TP level. 'Risk : Reward' ratio is then used to calculate SL based of previous high/low level.\n\nIn short, the higher the R:R ratio, the smaller the SL since TP target is fixed by previous high/low price data.")
i_accountRiskPercent    = input.float(1,    "Portfolio Risk %",                 group = "Strategy: Risk Management",    inline = "1", minval = 0, step = 0.1,     tooltip = "Percentage of portfolio you lose if trade hits SL.\n\nYou then stand to gain\n  Portfolio Risk % * Risk : Reward\nif trade hits TP.")


// 4. Inputs for Drawings
i_showTpSlBoxes       = input.bool(false,  "Show TP / SL Boxes",               group = "Strategy: Drawings",           inline = "1",  tooltip = "Show or hide TP and SL position boxes.\n\nNote: TradingView limits the maximum number of boxes that can be displayed to 500 so they may not appear for all price data under test.")
i_showLabels          = input.bool(false, "Show Trade Exit Labels",            group = "Strategy: Drawings",           inline = "1",  tooltip = "Useful labels to identify Profit/Loss and cumulative portfolio capital after each trade closes.\n\nAlso note that TradingView limits the max number of 'boxes' that can be displayed on a chart (max 500). This means when you lookback far enough on the chart you will not see the TP/SL boxes. However you can check this option to identify where trades exited.")
i_showDashboard       = input.bool(false, "Show Dashboard",                    group = "Strategy: Drawings",           inline = "1",  tooltip = "Show Backtest Results")
i_show_color_bar      = input.bool(false , "Color Bars",                       group = "Strategy: Drawings",           inline = "1")
// 5. Inputs for Indicators
//// 5-1. Inputs for Indicator - 1: SSL Hybrid
i_useTrueRange = input.bool(defval = true , title = "use true range for Keltner Channel?", tooltip = "", inline = " ", group = "1: SSL Hybrid")
i_maType = input.string(defval='EMA', title='Baseline Type', options=['SMA', 'EMA', 'DEMA', 'TEMA', 'LSMA', 'WMA', 'MF', 'VAMA', 'TMA', 'HMA', 'JMA', 'Kijun v2', 'EDSMA', 'McGinley'],group = "1: SSL Hybrid")
i_len = input.int(defval=30,title='Baseline Length', group = "1: SSL Hybrid")
i_multy = input.float(0.2, step=0.05, title='Base Channel Multiplier', group = "1: SSL Hybrid")

// Input for Baseline
i_kidiv = input.int(defval=1, maxval=4, minval=0, title='Kijun MOD Divider',inline="Kijun v2", group="1: SSL Hybrid")
i_jurik_phase = input.int(defval=3, title='Baseline Type = JMA -> Jurik Phase', inline='JMA',group="1: SSL Hybrid")
i_jurik_power = input.int(defval=1, title='Baseline Type = JMA -> Jurik Power', inline='JMA',group="1: SSL Hybrid")
i_volatility_lookback = input.int(defval=10, title='Baseline Type = VAMA -> Volatility lookback length', inline='VAMA',group="1: SSL Hybrid")
// MF
i_beta = input.float(0.8, minval=0, maxval=1, step=0.1, title='Baseline Type = MF (Modular Filter, General Filter) ->Beta', inline='MF',group="1: SSL Hybrid")
i_feedback = input.bool(defval=false, title='Baseline Type = MF (Modular Filter) -> Use Feedback?', inline='MF',group="1: SSL Hybrid")
i_z = input.float(0.5, title='Baseline Type = MF (Modular Filter) ->  Feedback Weighting', step=0.1, minval=0, maxval=1, inline='MF',group="1: SSL Hybrid")
// EDSMA
i_ssfLength = input.int(title='EDSMA - Super Smoother Filter Length', minval=1, defval=20, inline='EDSMA',group="1: SSL Hybrid")
i_ssfPoles = input.int(title='EDSMA - Super Smoother Filter Poles', defval=2, options=[2, 3], inline='EDSMA',group="1: SSL Hybrid")

// # ========================================================================= #
// #               Functions for Stop Loss & Take Profit & Plots
// # ========================================================================= #

percentAsPoints(pcnt) =>
    math.round(pcnt / 100 * close / syminfo.mintick)

calcStopLossPrice(pointsOffset, isLong) =>
    priceOffset = pointsOffset * syminfo.mintick
    if isLong
        close - priceOffset
    else
        close + priceOffset

calcProfitTrgtPrice(pointsOffset, isLong) =>
    calcStopLossPrice(-pointsOffset, isLong)


printLabel(barIndex, msg) => label.new(barIndex, close, msg)

printTpSlHitBox(left, right, slHit, tpHit, entryPrice, slPrice, tpPrice) =>
    if i_showTpSlBoxes
        box.new (left = left,   top = entryPrice,   right = right,  bottom = slPrice,   bgcolor = slHit ? color.new(color.red, 60)   : color.new(color.gray, 90), border_width = 0)
        box.new (left = left,   top = entryPrice,   right = right,  bottom = tpPrice,   bgcolor = tpHit ? color.new(color.green, 60) : color.new(color.gray, 90), border_width = 0)
        line.new(x1 = left,     y1 = entryPrice,    x2 = right,     y2 = entryPrice,    color = color.new(color.yellow, 20))
        line.new(x1 = left,     y1 = slPrice,       x2 = right,     y2 = slPrice,       color = color.new(color.red, 20))
        line.new(x1 = left,     y1 = tpPrice,       x2 = right,     y2 = tpPrice,       color = color.new(color.green, 20))

printTpSlNotHitBox(left, right, entryPrice, slPrice, tpPrice) =>
    if i_showTpSlBoxes
        box.new (left = left,   top = entryPrice,   right = right,  bottom = slPrice,   bgcolor = color.new(color.gray, 90), border_width = 0)
        box.new (left = left,   top = entryPrice,   right = right,  bottom = tpPrice,   bgcolor = color.new(color.gray, 90), border_width = 0)
        line.new(x1 = left,     y1 = entryPrice,    x2 = right,     y2 = entryPrice,    color = color.new(color.yellow, 20))
        line.new(x1 = left,     y1 = slPrice,       x2 = right,     y2 = slPrice,       color = color.new(color.red, 20))
        line.new(x1 = left,     y1 = tpPrice,       x2 = right,     y2 = tpPrice,       color = color.new(color.green, 20))

printTradeExitLabel(x, y, posSize, entryPrice, pnl) =>
    if i_showLabels
        labelStr = "Position Size: " + str.tostring(math.abs(posSize), "#.##") + "\nPNL: " + str.tostring(pnl, "#.##") + "\nCapital: " + str.tostring(strategy.equity, "#.##") + "\nEntry Price: " + str.tostring(entryPrice, "#.##") + "\nExit Price: " + str.tostring(close,"#.##")
        label.new(x = x, y = y, text = labelStr, color = pnl > 0 ? color.new(color.green, 60) : color.new(color.red, 60), textcolor = color.white, style = label.style_label_down)

f_fillCell(_table, _column, _row, _title, _value, _bgcolor, _txtcolor) =>
    _cellText = _title + " " + _value
    table.cell(_table, _column, _row, _cellText, bgcolor=_bgcolor, text_color=_txtcolor, text_size=size.auto)

// # ========================================================================= #
// #                          Entry, Close Logic
// # ========================================================================= #
// 1. Calculate Indicators
//// 1-1. Calculate Indicators for SSL Hybrid Baseline
////// TEMA
tema(src, len) =>
    ema1 = ta.ema(src, len)
    ema2 = ta.ema(ema1, len)
    ema3 = ta.ema(ema2, len)
    3 * ema1 - 3 * ema2 + ema3
////// EDSMA
get2PoleSSF(src, length) =>
    PI = 2 * math.asin(1)
    arg = math.sqrt(2) * PI / length
    a1 = math.exp(-arg)
    b1 = 2 * a1 * math.cos(arg)
    c2 = b1
    c3 = -math.pow(a1, 2)
    c1 = 1 - c2 - c3

    ssf = 0.0
    ssf := c1 * src + c2 * nz(ssf[1]) + c3 * nz(ssf[2])
    ssf

get3PoleSSF(src, length) =>
    PI = 2 * math.asin(1)

    arg = PI / length
    a1 = math.exp(-arg)
    b1 = 2 * a1 * math.cos(1.738 * arg)
    c1 = math.pow(a1, 2)

    coef2 = b1 + c1
    coef3 = -(c1 + b1 * c1)
    coef4 = math.pow(c1, 2)
    coef1 = 1 - coef2 - coef3 - coef4

    ssf = 0.0
    ssf := coef1 * src + coef2 * nz(ssf[1]) + coef3 * nz(ssf[2]) + coef4 * nz(ssf[3])
    ssf

ma(type, src, len) =>
    float result = 0
    if type == 'TMA'
        result := ta.sma(ta.sma(src, math.ceil(len / 2)), math.floor(len / 2) + 1)
        result
    if type == 'MF'
        ts = 0.
        b = 0.
        c = 0.
        os = 0.
        //----
        alpha = 2 / (len + 1)
        a = i_feedback ? i_z * src + (1 - i_z) * nz(ts[1], src) : src
        //----
        b := a > alpha * a + (1 - alpha) * nz(b[1], a) ? a : alpha * a + (1 - alpha) * nz(b[1], a)
        c := a < alpha * a + (1 - alpha) * nz(c[1], a) ? a : alpha * a + (1 - alpha) * nz(c[1], a)
        os := a == b ? 1 : a == c ? 0 : os[1]
        //----
        upper = i_beta * b + (1 - i_beta) * c
        lower = i_beta * c + (1 - i_beta) * b
        ts := os * upper + (1 - os) * lower
        result := ts
        result
    if type == 'LSMA'
        result := ta.linreg(src, len, 0)
        result
    if type == 'SMA'  // Simple
        result := ta.sma(src, len)
        result
    if type == 'EMA'  // Exponential
        result := ta.ema(src, len)
        result
    if type == 'DEMA'  // Double Exponential
        e = ta.ema(src, len)
        result := 2 * e - ta.ema(e, len)
        result
    if type == 'TEMA'  // Triple Exponential
        e = ta.ema(src, len)
        result := 3 * (e - ta.ema(e, len)) + ta.ema(ta.ema(e, len), len)
        result
    if type == 'WMA'  // Weighted
        result := ta.wma(src, len)
        result
    if type == 'VAMA'  // Volatility Adjusted
        /// Copyright © 2019 to present, Joris Duyck (JD)
        mid = ta.ema(src, len)
        dev = src - mid
        vol_up = ta.highest(dev, i_volatility_lookback)
        vol_down = ta.lowest(dev, i_volatility_lookback)
        result := mid + math.avg(vol_up, vol_down)
        result
    if type == 'HMA'  // Hull
        result := ta.wma(2 * ta.wma(src, len / 2) - ta.wma(src, len), math.round(math.sqrt(len)))
        result
    if type == 'JMA'  // Jurik
        /// Copyright © 2018 Alex Orekhov (everget)
        /// Copyright © 2017 Jurik Research and Consulting.
        phaseRatio = i_jurik_phase < -100 ? 0.5 : i_jurik_phase > 100 ? 2.5 : i_jurik_phase / 100 + 1.5
        beta = 0.45 * (len - 1) / (0.45 * (len - 1) + 2)
        alpha = math.pow(beta, i_jurik_power)
        jma = 0.0
        e0 = 0.0
        e0 := (1 - alpha) * src + alpha * nz(e0[1])
        e1 = 0.0
        e1 := (src - e0) * (1 - beta) + beta * nz(e1[1])
        e2 = 0.0
        e2 := (e0 + phaseRatio * e1 - nz(jma[1])) * math.pow(1 - alpha, 2) + math.pow(alpha, 2) * nz(e2[1])
        jma := e2 + nz(jma[1])
        result := jma
        result
    if type == 'Kijun v2'
        kijun = math.avg(ta.lowest(len), ta.highest(len))  //, (open + close)/2)
        conversionLine = math.avg(ta.lowest(len / i_kidiv), ta.highest(len / i_kidiv))
        delta = (kijun + conversionLine) / 2
        result := delta
        result
    if type == 'McGinley'
        mg = 0.0
        mg := na(mg[1]) ? ta.ema(src, len) : mg[1] + (src - mg[1]) / (len * math.pow(src / mg[1], 4))
        result := mg
        result
    if type == 'EDSMA'
        zeros = src - nz(src[2])
        avgZeros = (zeros + zeros[1]) / 2

        // Ehlers Super Smoother Filter
        ssf = i_ssfPoles == 2 ? get2PoleSSF(avgZeros, i_ssfLength) : get3PoleSSF(avgZeros, i_ssfLength)

        // Rescale filter in terms of Standard Deviations
        stdev = ta.stdev(ssf, len)
        scaledFilter = stdev != 0 ? ssf / stdev : 0

        alpha = 5 * math.abs(scaledFilter) / len

        edsma = 0.0
        edsma := alpha * src + (1 - alpha) * nz(edsma[1])
        result := edsma
        result
    result

////// Keltner Baseline Channel (Baseline)
BBMC = ma(i_maType, close, i_len)
Keltma = ma(i_maType, close, i_len)
range_1 = i_useTrueRange ? ta.tr : high - low
rangema = ta.ema(range_1, i_len)
upperk = Keltma + rangema * i_multy
lowerk = Keltma - rangema * i_multy

// 2. Entry Condition for Long and Short
// Condition 1
bullSSL             = close > upperk
bearSSL             = close < lowerk
// Enter Position based on Condition 1
goLong              = inDateRange and bullSSL
goShort             = inDateRange and bearSSL
// # ========================================================================= #
// #                   Position Control Logic (Entry & Exit)
// # ========================================================================= #
// 1. Trade entry and exit variables
var tradeEntryBar   = bar_index
var profitPoints    = 0.
var lossPoints      = 0.
var slPrice         = 0.
var tpPrice         = 0.
var inLong          = false
var inShort         = false
// 2. Entry decisions
openLong            = (goLong and not inLong)                           // Long entry condition & not in long position
openShort           = (goShort and not inShort)                         // Short entry condition & not in short position
flippingSides       = (goLong and inShort) or (goShort and inLong)      // (Long entry condition & in short position) and the opposite
enteringTrade       = openLong or openShort                             // Entering Long or Short Condition
inTrade             = inLong or inShort
// 3. Stop Loss & Take Profit Percent
lowestLow           = ta.lowest(source = low, length = i_slLookBack)
highestHigh         = ta.highest(source = high, length = i_slLookBack)
llhhSLPercent       = openLong ? math.abs((close - lowestLow) / close) * 100 : openShort ? math.abs((highestHigh - close) / close) * 100 : na
atr                 = ta.atr(i_slAtrLength)
slAmount            = atr * i_slAtrMultiplier
slPercent           = i_slType == 'ATR' ? math.abs((1 - (close - slAmount) / close) * 100) : i_slType == 'Percent' ? i_slPercent : llhhSLPercent
tpPercent           = slPercent * i_riskReward
// 4. Risk calculations & Quantity Management
riskAmt             = strategy.equity * i_accountRiskPercent / 100
entryQty            = math.abs(riskAmt / slPercent * 100)  / close

// 5. Open Position
if openLong
    if strategy.position_size < 0
        printTpSlNotHitBox(tradeEntryBar + 1, bar_index + 1, strategy.position_avg_price, slPrice, tpPrice)
        printTradeExitLabel(bar_index + 1, math.max(tpPrice, slPrice), strategy.position_size, strategy.position_avg_price, strategy.openprofit)
    strategy.entry("Long", strategy.long, qty = entryQty, alert_message = "Long Entry")
    enteringTrade   := true
    inLong          := true
    inShort         := false

if openShort
    if strategy.position_size > 0
        printTpSlNotHitBox(tradeEntryBar + 1, bar_index + 1, strategy.position_avg_price, slPrice, tpPrice)
        printTradeExitLabel(bar_index + 1, math.max(tpPrice, slPrice), strategy.position_size, strategy.position_avg_price, strategy.openprofit)
    strategy.entry("Short", strategy.short, qty = entryQty, alert_message = "Short Entry")
    enteringTrade   := true
    inShort         := true
    inLong          := false

if enteringTrade
    profitPoints    := percentAsPoints(tpPercent)
    lossPoints      := percentAsPoints(slPercent)
    slPrice         := calcStopLossPrice(lossPoints, openLong)
    tpPrice         := calcProfitTrgtPrice(profitPoints, openLong)
    tradeEntryBar   := bar_index

// Can add more take profit Actions
strategy.exit("TP/SL", profit = profitPoints, loss = lossPoints, comment_profit = "TP Hit", comment_loss = "SL Hit", alert_profit = "TP Hit Alert", alert_loss = "SL Hit Alert")

// # ========================================================================= #
// #                    Plots (Bar Color, Plot, Label, Boxes)
// # ========================================================================= #

// 1. SSL Hybrid Baseline
longColor = #00c3ff
shortColor = #ff0062
color_bar = close > upperk ? longColor : close < lowerk ? shortColor : color.gray
p1 = plot(BBMC, color=color.new(color=color_bar, transp=0), linewidth=4, title='MA Baseline')

// 2. Bar color Based On SSL Hybrid Baseline
barcolor(i_show_color_bar ? color_bar : na)
up_channel = plot(upperk, color=color_bar, title='Baseline Upper Channel')
low_channel = plot(lowerk, color=color_bar, title='Basiline Lower Channel')
fill(up_channel, low_channel, color.new(color=color_bar, transp=90))


// 3. Stoploss Boxes
slHit           = (inShort and high >= slPrice) or (inLong  and low <= slPrice)
tpHit           = (inLong  and high >= tpPrice) or (inShort and low <= tpPrice)
exitTriggered   = slHit or tpHit
entryPrice      = strategy.closedtrades.entry_price (strategy.closedtrades - 1)
pnl             = strategy.closedtrades.profit      (strategy.closedtrades - 1)
posSize         = strategy.closedtrades.size        (strategy.closedtrades - 1)

if (inTrade and exitTriggered)
    inShort    := false
    inLong     := false
    printTpSlHitBox(tradeEntryBar + 1, bar_index, slHit, tpHit, entryPrice, slPrice, tpPrice)
    printTradeExitLabel(bar_index, math.max(tpPrice, slPrice), posSize, entryPrice, pnl)

if barstate.islastconfirmedhistory and strategy.position_size != 0
    printTpSlNotHitBox(tradeEntryBar + 1, bar_index + 1, strategy.position_avg_price, slPrice, tpPrice)


// 4. Data Windows
plotchar(slPrice,    "Stop Loss Price",     "")
plotchar(tpPrice,    "Take Profit Price",   "")

// 5. Showing Labels
plotDebugLabels = false
if plotDebugLabels
    if bar_index == tradeEntryBar
        printLabel(bar_index, "Position size: " + str.tostring(entryQty * close, "#.##"))

// 6. Showing Dashboard
if i_showDashboard
    var bgcolor = color.new(color.black,0)

    // Keep track of Wins/Losses streaks
    newWin  = (strategy.wintrades  > strategy.wintrades[1]) and (strategy.losstrades == strategy.losstrades[1]) and (strategy.eventrades == strategy.eventrades[1])
    newLoss = (strategy.wintrades == strategy.wintrades[1]) and (strategy.losstrades  > strategy.losstrades[1]) and (strategy.eventrades == strategy.eventrades[1])

    varip int winRow     = 0
    varip int lossRow    = 0
    varip int maxWinRow  = 0
    varip int maxLossRow = 0

    if newWin
        lossRow := 0
        winRow := winRow + 1
    if winRow > maxWinRow
        maxWinRow := winRow

    if newLoss
        winRow := 0
        lossRow := lossRow + 1
    if lossRow > maxLossRow
        maxLossRow := lossRow


    // Prepare stats table
    var table dashTable = table.new(position.bottom_right, 1, 15, border_width=1)


    if barstate.islastconfirmedhistory
        // Update table
        dollarReturn = strategy.netprofit
        f_fillCell(dashTable, 0, 0, "Start:", str.format("{0,date,long}", strategy.closedtrades.entry_time(0)) , bgcolor, color.white) // + str.format(" {0,time,HH:mm}", strategy.closedtrades.entry_time(0))
        f_fillCell(dashTable, 0, 1, "End:", str.format("{0,date,long}", strategy.opentrades.entry_time(0)) , bgcolor, color.white) // + str.format(" {0,time,HH:mm}", strategy.opentrades.entry_time(0))
        _profit = (strategy.netprofit / strategy.initial_capital) * 100
        f_fillCell(dashTable, 0, 2, "Net Profit:", str.tostring(_profit, '##.##') + "%", _profit > 0 ? color.green : color.red, color.white)
        _numOfDaysInStrategy = (strategy.opentrades.entry_time(0) - strategy.closedtrades.entry_time(0)) / (1000 * 3600 * 24)
        f_fillCell(dashTable, 0, 3, "Percent Per Day", str.tostring(_profit / _numOfDaysInStrategy, '#########################.#####')+"%", _profit > 0 ? color.green : color.red, color.white)
        _winRate = ( strategy.wintrades / strategy.closedtrades ) * 100
        f_fillCell(dashTable, 0, 4, "Percent Profitable:", str.tostring(_winRate, '##.##') + "%", _winRate < 50 ? color.red : _winRate < 75 ? #999900 : color.green, color.white)
        f_fillCell(dashTable, 0, 5, "Profit Factor:", str.tostring(strategy.grossprofit / strategy.grossloss,  '##.###'), strategy.grossprofit > strategy.grossloss ? color.green : color.red, color.white)
        f_fillCell(dashTable, 0, 6, "Total Trades:", str.tostring(strategy.closedtrades), bgcolor, color.white)
        f_fillCell(dashTable, 0, 8, "Max Wins In A Row:", str.tostring(maxWinRow, '######') , bgcolor, color.white)
        f_fillCell(dashTable, 0, 9, "Max Losses In A Row:", str.tostring(maxLossRow, '######') , bgcolor, color.white)