ADX ダイナミック平均トレンド指標戦略
概要
ADX動平均トレンド指数戦略は,市場トレンドの強さやトレンド方向を判断するためにADX指数を使用する定量取引戦略である.この戦略は,平均トレンド指数 ((ADX) を計算して市場がトレンドがあるかどうかを判断し,正向指数 ((DI+) と負向指数 ((DI-) を計算してトレンドの方向を判断し,買入と売却の信号を生成する.
戦略原則
この戦略はまず,ADX指標を使って市場がトレンドしているかどうかを判断する。ADXがユーザが設定した重要な値より高く (デフォルトは23),市場が強いトレンドであることを示す。当時のADXの値がADXの前のn日の値より高いとき (デフォルトは3日),ADXが上昇し,市場がトレンドを形成していることを示す。
DI+とDI−の方向を判断する.DI+がDI−より高いときは,市場が上昇傾向にあることを示し,DI+がDI−より低いときは,市場が下降傾向にあることを示している.
最後に,ADXとDIの状況を分析し,具体的な買入と売却のシグナルを生成します.
- ADXが上昇すると,キット値より高く,DI+がDI−より高くなり,買取シグナルが生じる
- ADXが上昇し,臨界値を超え,DI+がDI−を下回ると,売り込みシグナルが生じる
- ADXが下がると平仓信号が作られます.
この戦略は,移動平均フィルターやカスタマイズされた再測時間範囲などの機能を提供し,必要に応じて構成することができます.
優位分析
ADXの動平均トレンド指数戦略は以下の利点があります.
- 市場動向を自動で判断し,無効取引を避ける
- 市場動向を自動判断し,トレンドを追跡する.
- トレンドがあるときに購入する/トレンドがなくなると平衡する明確な論理を提供
- 設定可能な移動平均をフィルタリングし,偽突破を避ける
- 履歴テストのための設定可能な回帰時間帯
- 標識とパラメータは調整可能で,異なる品種に最適化できます
リスク分析
この戦略にはいくつかのリスクがあります.
- ADXは後退しており,トレンドの初期にチャンスを逃している可能性がある.
- 多空判断はDI指数に依存し,DI指数は敏感で,誤信号が生じることがあります.
- 移動平均のフィルタリングは,ショートラインのチャンスを逃す可能性があります.
- 誤った回帰時間帯は過適合を引き起こす可能性がある
- 指数パラメータを正しく設定しない場合, 策略の効果に影響を及ぼす
リスクを下げるために,以下のことを考えてください.
- ADXパラメータを適切に縮小して,遅延を減らす
- 誤信号を防ぐためにDIフィルターを調整または削除
- 移動平均の周期を適切に短縮する
- 検査期間を拡大し,全サンプルを検査する
- メインパラメータを最適化して,最適な設定を探します.
最適化の方向
この戦略は以下の点で最適化できます.
- 複数の株を組み合わせてポートフォリオテストを行い,単一株のリスクを分散する
- 単一損失を制御するためにストップ・ロジックを追加
- 他の指標と組み合わせた検証により,信号の精度が向上する
- 機械学習アルゴリズムを導入し,
- 自動パラメータ最適化モジュールを追加し,動的なパラメータ調整を実現
要約する
ADX動平均トレンド指数戦略は,ADXがトレンドの存在とDIがトレンド方向を判断することを利用し,トレンドが存在するときに取引信号を生成し,戦略の考え方は明確である.この戦略は,自動的にトレンドを判断し,トレンドを追跡し,一定程度に非トレンド市場の無効取引を回避することができる.ある程度の最適化により,この戦略は,中長期線を量化する取引の強力なツールになることができる.
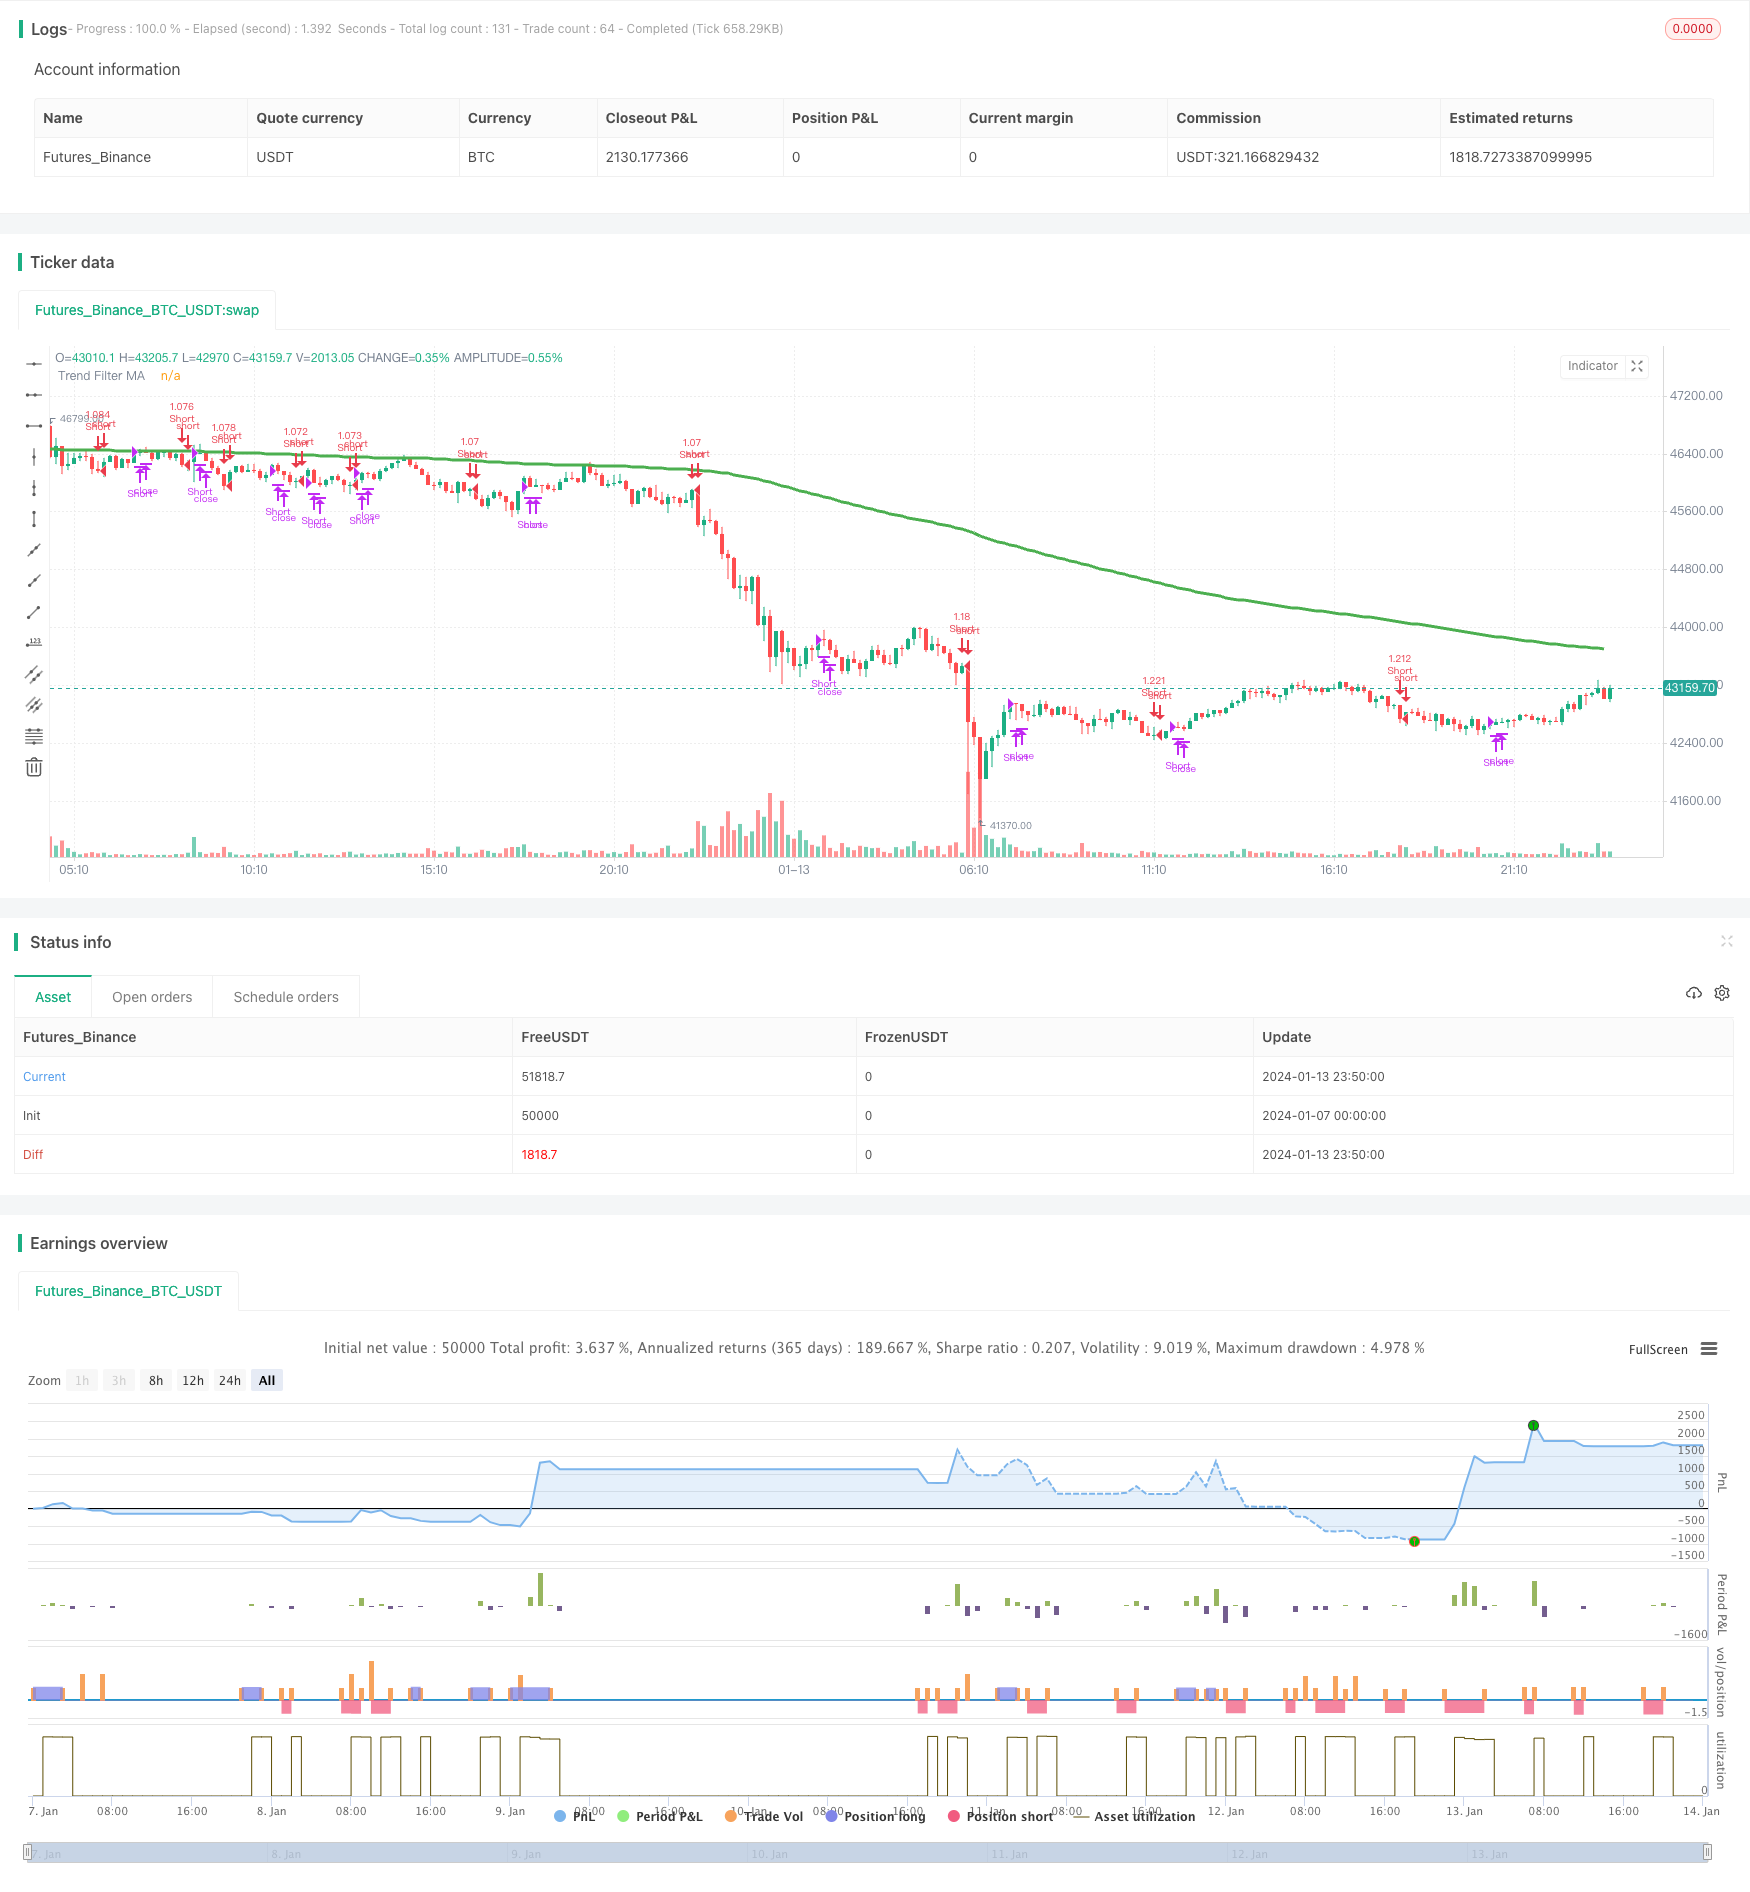
/*backtest
start: 2024-01-07 00:00:00
end: 2024-01-14 00:00:00
period: 10m
basePeriod: 1m
exchanges: [{"eid":"Futures_Binance","currency":"BTC_USDT"}]
*/

//@version=4
// This source code is subject to the terms of the Mozilla Public License 2.0 at https://mozilla.org/MPL/2.0/
// © millerrh with inspiration from @9e52f12edd034d28bdd5544e7ff92e
//The intent behind this study is to look at ADX when it has an increasing slope and is above a user-defined key level (23 default).
//This is to identify when it is trending.
//It then looks at the DMI levels.  If D+ is above D- and the ADX is sloping upwards and above the key level, it triggers a buy condition.  Opposite for short.
//Can use a user-defined moving average to filter long/short if desried.
// NOTE: THIS IS MEANT TO BE USED IN CONJUNCTION WITH MY "ATX TRIGGER" INDICATOR FOR VISUALIZATION. MAKE SURE SETTINGS ARE THE SAME FOR BOTH.

strategy("ADX | DMI Trend", overlay=true, initial_capital=10000, currency='USD',
   default_qty_type=strategy.percent_of_equity, default_qty_value=100, commission_type=strategy.commission.percent, commission_value=0.04)

// === BACKTEST RANGE ===
From_Year  = input(defval = 2019, title = "From Year")
From_Month = input(defval = 1, title = "From Month", minval = 1, maxval = 12)
From_Day   = input(defval = 1, title = "From Day", minval = 1, maxval = 31)
To_Year    = input(defval = 9999, title = "To Year")
To_Month   = input(defval = 1, title = "To Month", minval = 1, maxval = 12)
To_Day     = input(defval = 1, title = "To Day", minval = 1, maxval = 31)
Start  = timestamp(From_Year, From_Month, From_Day, 00, 00)  // backtest start window
Finish = timestamp(To_Year, To_Month, To_Day, 23, 59)        // backtest finish window

// == INPUTS ==
// ADX Info
adxlen = input(14, title="ADX Smoothing")
dilen = input(14, title="DI Period")
keyLevel = input(23, title="Keylevel for ADX")
adxLookback = input(3, title="Lookback Period for Slope")

// == FILTERING ==
// Inputs
useMaFilter = input(title = "Use MA for Filtering?", type = input.bool, defval = true)
maType = input(defval="EMA", options=["EMA", "SMA"], title = "MA Type For Filtering")
maLength   = input(defval = 200, title = "MA Period for Filtering", minval = 1)

// Declare function to be able to swap out EMA/SMA
ma(maType, src, length) =>
    maType == "EMA" ? ema(src, length) : sma(src, length) //Ternary Operator (if maType equals EMA, then do ema calc, else do sma calc)
maFilter = ma(maType, close, maLength)
plot(maFilter, title = "Trend Filter MA", color = color.green, linewidth = 3, style = plot.style_line, transp = 50)

// Check to see if the useMaFilter check box is checked, this then inputs this conditional "maFilterCheck" variable into the strategy entry
maFilterCheck = if useMaFilter == true
    maFilter
else
    close

// == USE BUILT-IN DMI FUNCTION TO DETERMINE ADX AND BULL/BEAR STRENGTH
[diplus, diminus, adx] = dmi(dilen, adxlen)

buySignal = (adx[0]-adx[adxLookback] > 0) and adx > keyLevel and diplus > diminus  and close >= maFilterCheck
// buySignalValue = valuewhen(buySignal, close, 0)
shortSignal = (adx[0]-adx[adxLookback] > 0) and adx > keyLevel and diplus < diminus  and close <= maFilterCheck
// shortSignalValue = valuewhen(shortSignal, close, 0)
sellCoverSignal = adx[0]-adx[adxLookback] < 0

// == ENTRY & EXIT CRITERIA
// Triggers to be TRUE for it to fire of the BUY Signal : (opposite for the SELL signal).
// (1): Price is over the 200 EMA line. (EMA level configurable by the user)
// (2): "D+" is OVER the "D-" line
// (3): RSI 7 is under 30 (for SELL, RSI 7 is over 70)
// 1* = The ultimate is to have a combination line of 3 EMA values, EMA 14, EMA 50 and EMA 200 - And if price is over this "combo" line, then it's a strong signal

// == STRATEGY ENTRIES/EXITS ==
strategy.entry("Long", strategy.long, when = buySignal)
strategy.close("Long", when = sellCoverSignal)
strategy.entry("Short", strategy.short, when = shortSignal)
strategy.close("Short", when = sellCoverSignal)

// == ALERTS ==
// alertcondition(buySignal, title='ADX Trigger Buy', message='ADX Trigger Buy')
// alertcondition(sellSignal, title='ADX Trigger Sell', message='ADX Trigger Sell')