モメンタム平均差指標ブレイクアウト戦略
作成日:
2024-01-17 14:08:46
最終変更日:
2024-01-17 14:08:46
コピー:
1
クリック数:
739
1
フォロー
1750
フォロワー
概要
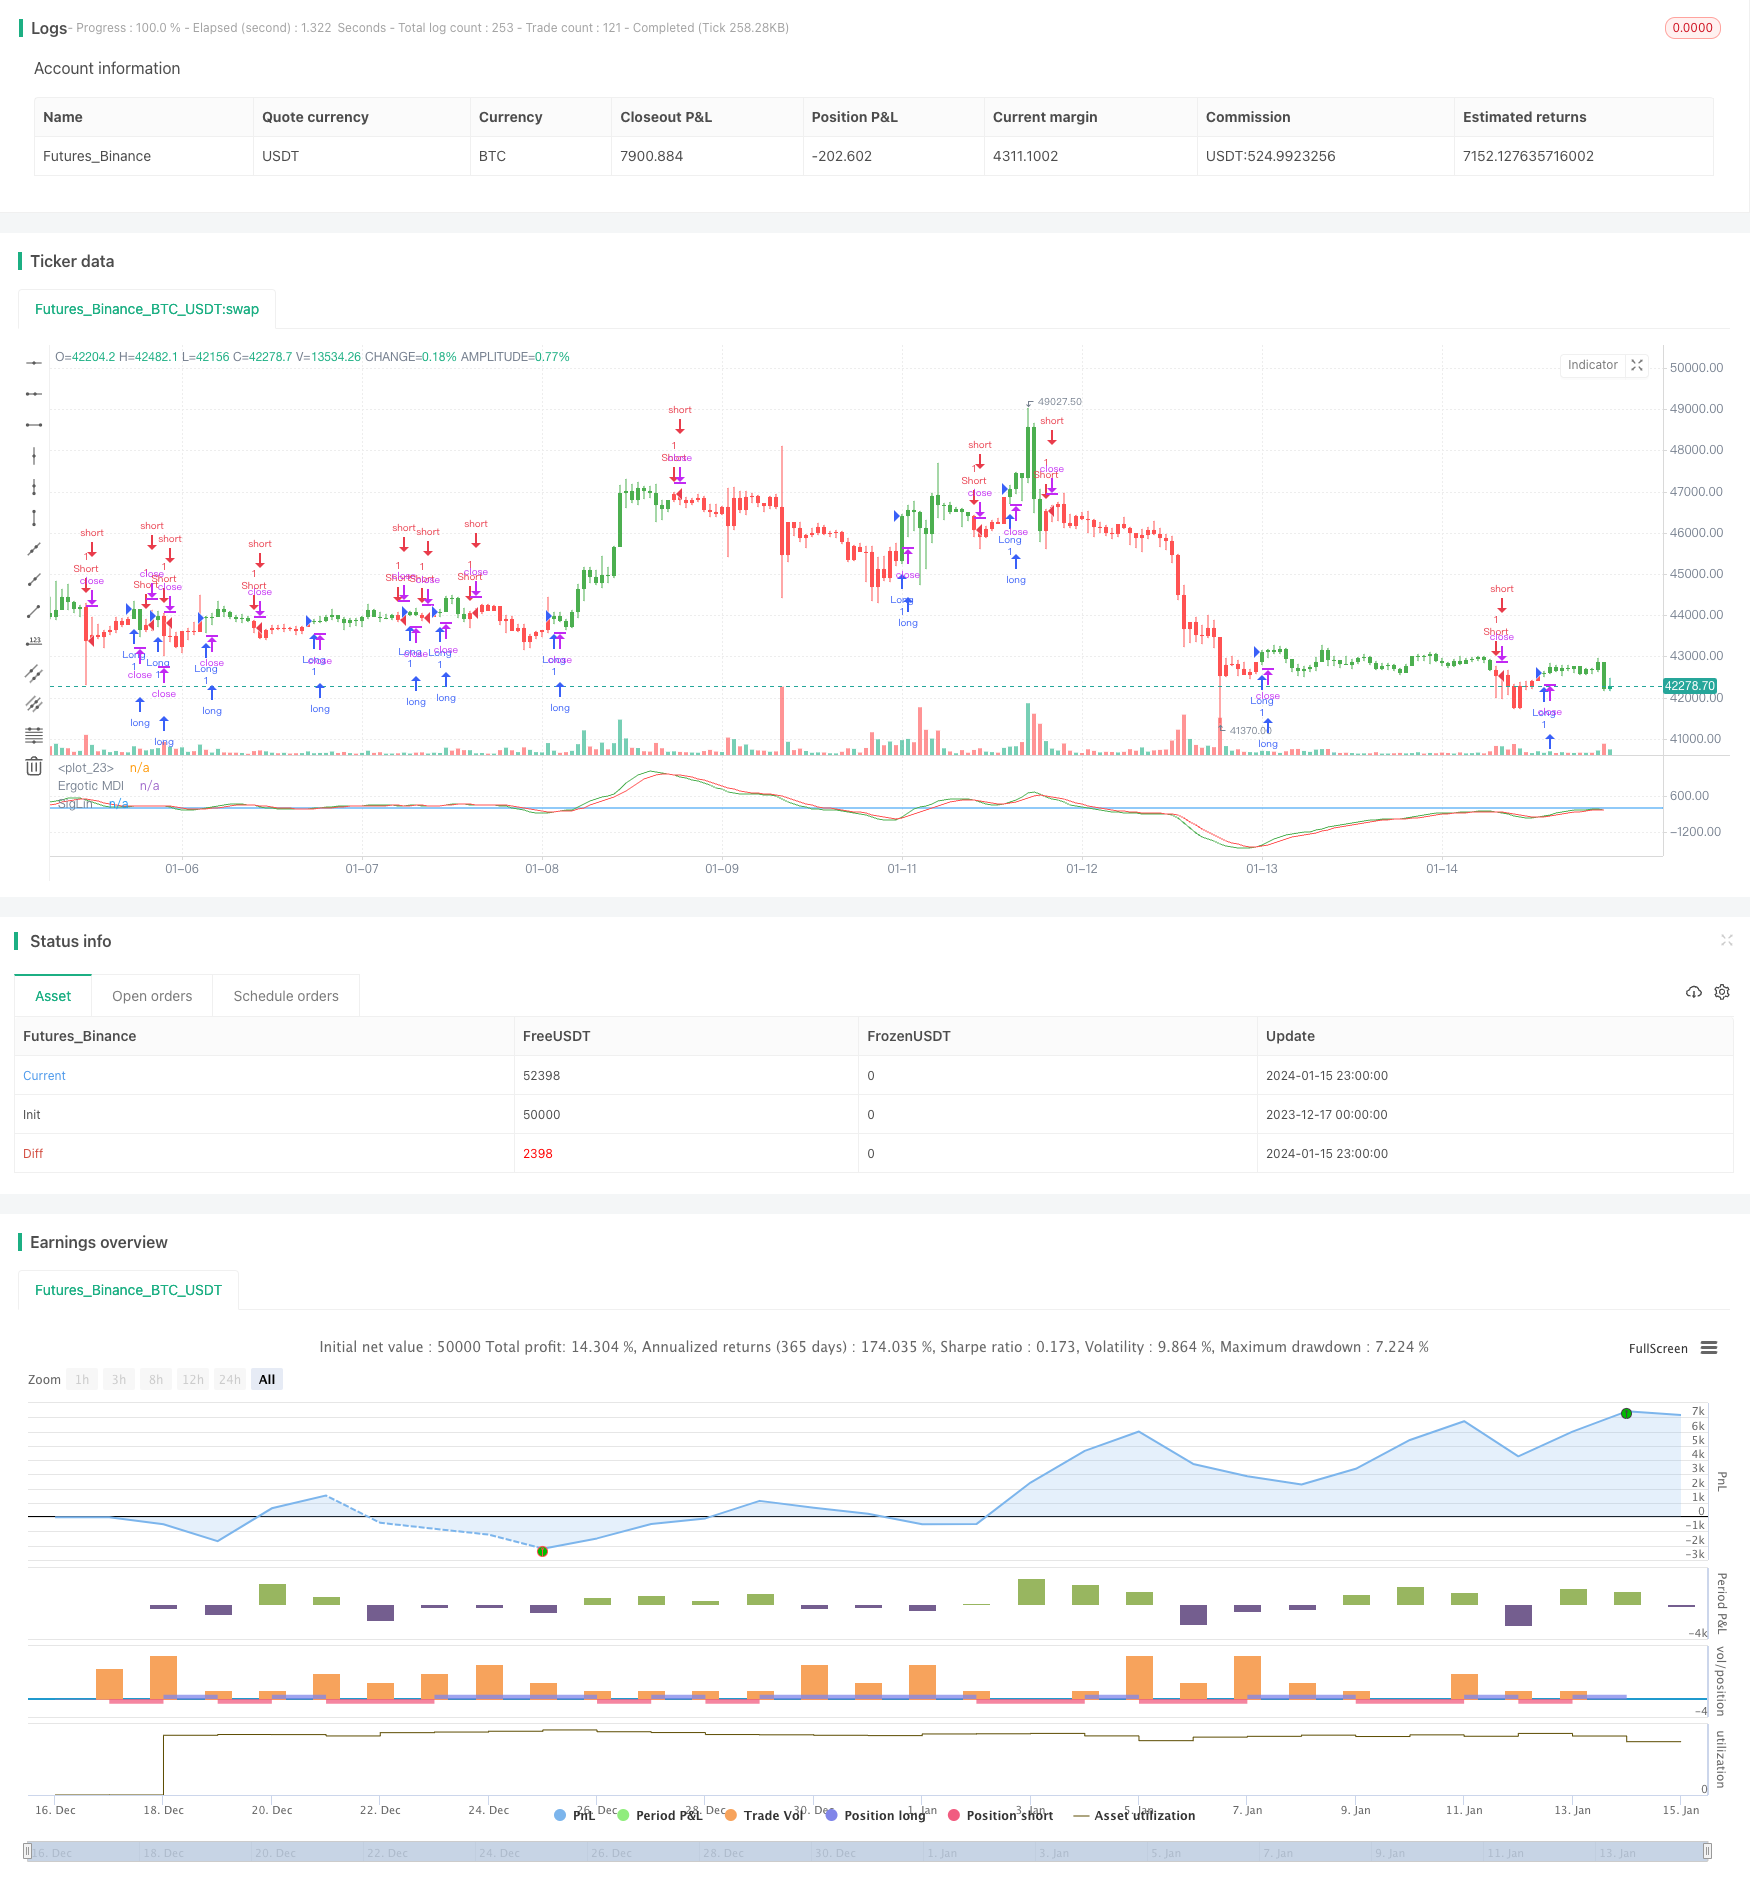
この戦略は,ウィリアム・ブラウが1995年に出版した”動量,方向,および離“という本で記述した技術指標の動量動量均差指標の設計に基づいています.この指標は,価格の動量,価格の方向,および価格の離の3つの重要な要素に焦点を当て,価格と動量との関係を深く分析しています.
戦略原則
この策略は,価格の傾向と破裂点を判断するために,運動均差指数を使用する.まず,価格のEMA平均を計算し,次に価格がEMA線から偏差を計算する.この偏差は,ダブルEMA平行処理され,最終的な運動均差指数曲線が得られる.この曲線は,自身の信号線を横切ったり下切ったりするときに取引信号を生成する.具体的には,計算の流れは次のとおりである.
- 価格を計算するEMA平均線xEMA
- 価格とxEMAの偏差を計算するxEMA_S
- xEMA_SにEMAを平滑化すると,パラメータはsで,xEMA_Uが得られる.
- xEMA_UにEMAを平滑して,パラメータはuで,信号線xSignalが得られる
- xEMA_UとxSignalの大きさの関係を比較する:
- xEMA_U > xSignalは多頭信号として
- xEMA_U
- 取引シグナルpossigを生成する
POSSIG信号で買い物や売却を行う.
優位分析
この戦略の利点は以下の通りです.
- 双EMAフィルターを使用し,偽突破を効果的にフィルタリングし,信号の信頼性を向上させる
- 短期的な価格変動に敏感で,トレンドの転換点を捉える EMA ベース
- パラメタリックな設計により,異なる周期と品種に合わせてパラメータを調整できます.
- 価格の双方向の波動を利用して利益を得るための,長短双方向の取引信号を含む
リスク分析
この戦略にはいくつかの潜在的リスクがあります.
- EMAはパラメータ選択に敏感であり,不適切な設定で信号が逃れ,または間違った信号が生成される可能性がある.
- 複数の頭と空頭信号が同時に発生する可能性があるため,フィルタリング条件を設定し,相互を抵消しないようにする必要があります.
- ダブルEMAフィルタは有効な信号を過度に過濾し,漏れ状を引き起こす可能性がある.
- 大周期的なトレンド関係が考慮されていないため,逆転取引のリスクがある
これらのリスクは,パラメータの最適化,フィルタリング条件の設定,トレンド判断の導入などによって軽減できます.
最適化の方向
この戦略の最適化方向は以下の通りです.
- パラメータ r,s,u を最適化して,周期や品種特性に合わせる
- トレンド判断モジュールを追加し,逆行操作を避ける
- 通路突破などのフィルタリング条件を追加して無効信号を回避する
- 戦略の効果を高めるために,他の要因とモデルを組み合わせる
要約する
この戦略は,価格と動量関係の動量均差指数に基づいて,価格逆転の瞬間を捕捉する.これはパラメータ化され,最適化可能な設計であり,異なる周期と品種に適応することができる.しかし,一定量の偽信号と逆向きの取引のリスクもある.パラメータとモデルをさらに最適化し,トレンド判断などと組み合わせることで,より良いパフォーマンスを期待できる.
ストラテジーソースコード
/*backtest
start: 2023-12-17 00:00:00
end: 2024-01-16 00:00:00
period: 1h
basePeriod: 15m
exchanges: [{"eid":"Futures_Binance","currency":"BTC_USDT"}]
*/

//@version = 2
////////////////////////////////////////////////////////////
//  Copyright by HPotter v1.0 12/12/2016
// This is one of the techniques described by William Blau in his book "Momentum,
// Direction and Divergence" (1995). If you like to learn more, we advise you to
// read this book. His book focuses on three key aspects of trading: momentum,
// direction and divergence. Blau, who was an electrical engineer before becoming
// a trader, thoroughly examines the relationship between price and momentum in
// step-by-step examples. From this grounding, he then looks at the deficiencies
// in other oscillators and introduces some innovative techniques, including a
// fresh twist on Stochastics. On directional issues, he analyzes the intricacies
// of ADX and offers a unique approach to help define trending and non-trending periods.
//
// You can change long to short in the Input Settings
// Please, use it only for learning or paper trading. Do not for real trading.
////////////////////////////////////////////////////////////
strategy(title="Ergotic MDI (Mean Deviation Indicator) Bactest")
r = input(32, minval=1)
s = input(5, minval=1)
u = input(5, minval=1)
SmthLen = input(3, minval=1)
reverse = input(false, title="Trade reverse")
hline(0, color=blue, linestyle=line)
xEMA = ema(close, r)
xEMA_S = close - xEMA
xEMA_U = ema(ema(xEMA_S, s), u)
xSignal = ema(xEMA_U, u)
pos = iff(xEMA_U > xSignal, 1,
	   iff(xEMA_U < xSignal, -1, nz(pos[1], 0)))
possig = iff(reverse and pos == 1, -1,
          iff(reverse and pos == -1, 1, pos))
if (possig == 1)
    strategy.entry("Long", strategy.long)
if (possig == -1)
    strategy.entry("Short", strategy.short)
barcolor(possig == -1 ? red: possig == 1 ? green : blue )
plot(xEMA_U, color=green, title="Ergotic MDI")
plot(xSignal, color=red, title="SigLin")