モメンタムブレイクアウト最適化トレンドフォロー戦略
概要
動態突破最適化戦略は,動態指標に基づいて取引シグナル生成とストップストップ設定を実現するトレンド追跡戦略である.この戦略は,価格と移動平均線の交差点を計算して市場のトレンド方向を判断し,ATRとLinRegチャネルを組み合わせて動態ストップメカニズムを構築する.同時に,戦略は,CMO指標を使用して,超買い超売状況を識別し,より良い入場を実現する.
戦略原則
- 1. 価格のZLEMA移動平均をトレンドの方向を判断する技術指標として計算する
- 2. ATRによる長期ストップ価格と短期ストップ価格の計算
- 3. CMO指標の計算は,移動平均と組み合わせて,超売り区間を判断し,入場シグナルとして使用します.
- 4. ATRと移動平均の突破に基づいて3つの取引シグナルを構成する
- 移動平均線とストップ価格の交差信号
- 価格とストップ価格の交差信号
- 価格と移動平均の交差信号
- 5. パラメータ設定によって異なるタイプの信号の有効化が制御される
- 6. リスク管理のためのリスク係数とポジションコントロールの設定
戦略全体は,複数の指標の組み合わせによる安定したトレンド追跡と自動停止を実現し,十分な取引機会を保証するとともに,取引リスクを制御します.
優位分析
複数の指標の組み合わせを使用
戦略は,移動平均,ATR,CMOなどの複数の指標の組み合わせを使用し,指標の間の効果的な補足を形成し,トレンドの方向を特定し,超買い超売り領域の判断をより正確に信頼することができます.
動的トレーリングストップ
ATRベースのダイナミック・ストップ・メカニズムにより,市場の変動に応じてストップ・ポジションを柔軟に調整し,単一損失を効果的に制御することができる.
リスクの管理
戦略は,ポジションコントロールとリスク係数の設定を提供し,最大損失の資金比率を事前に定義し,資金の大幅な変動を回避します.
豊かな取引信号
戦略は,合計で3つの取引シグナルのセットを提供しており,異なるタイプのシグナルの組み合わせを有効にすることで,より良い反射結果を得ることができます.
リスク分析
取引頻度が高い
全信号パケットを有効にすると,取引頻度が過高になる可能性があります. 部分信号パケットのみを使用することを選択することで回避できます.
メインパラメータは敏感です
複数の指標の組み合わせを使用することで,パラメータの選択がより複雑になり,パラメータ設定に敏感になり,パラメータの最適な組み合わせを精密にテストする必要があります.
突破信号の撤回率が高い
価格とストップ価格の交差のみに基づいた取引信号は,ストップの範囲が大きく,単一の損失と撤回が大きくなる可能性があります.移動均線信号とその組み合わせを使用することを選択できます.
最適化の方向
異なるパラメータをテストする
移動平均型,長さのパラメータを最適化;ATR周期パラメータを最適化;CMOパラメータを最適化.パラメータの最適なマッチを見つける.
信号使用戦略の最適化
テストは,移動平均信号,ストップ価格信号,および組合せ信号のみを使用して,最適な使用戦略を分析する.
異なる品種でテスト
株価指数,外貨,商品品種で反省し,市場タイプに戦略の適合性を分析する.
要約する
この戦略は,トレンドの方向を識別し,ストップ・ロスの仕組みを構築し,超買い超売りの機会を発見するために,複数の指標を総合的に使用する.パラメータ最適化,シグナル組み合わせ選択などの方法によって調整することで,より良い撤回指標を得ることができる.全体的に言えば,この戦略システムは,完全で,信頼性が高く,現場でさらにテスト・最適化の価値があります.
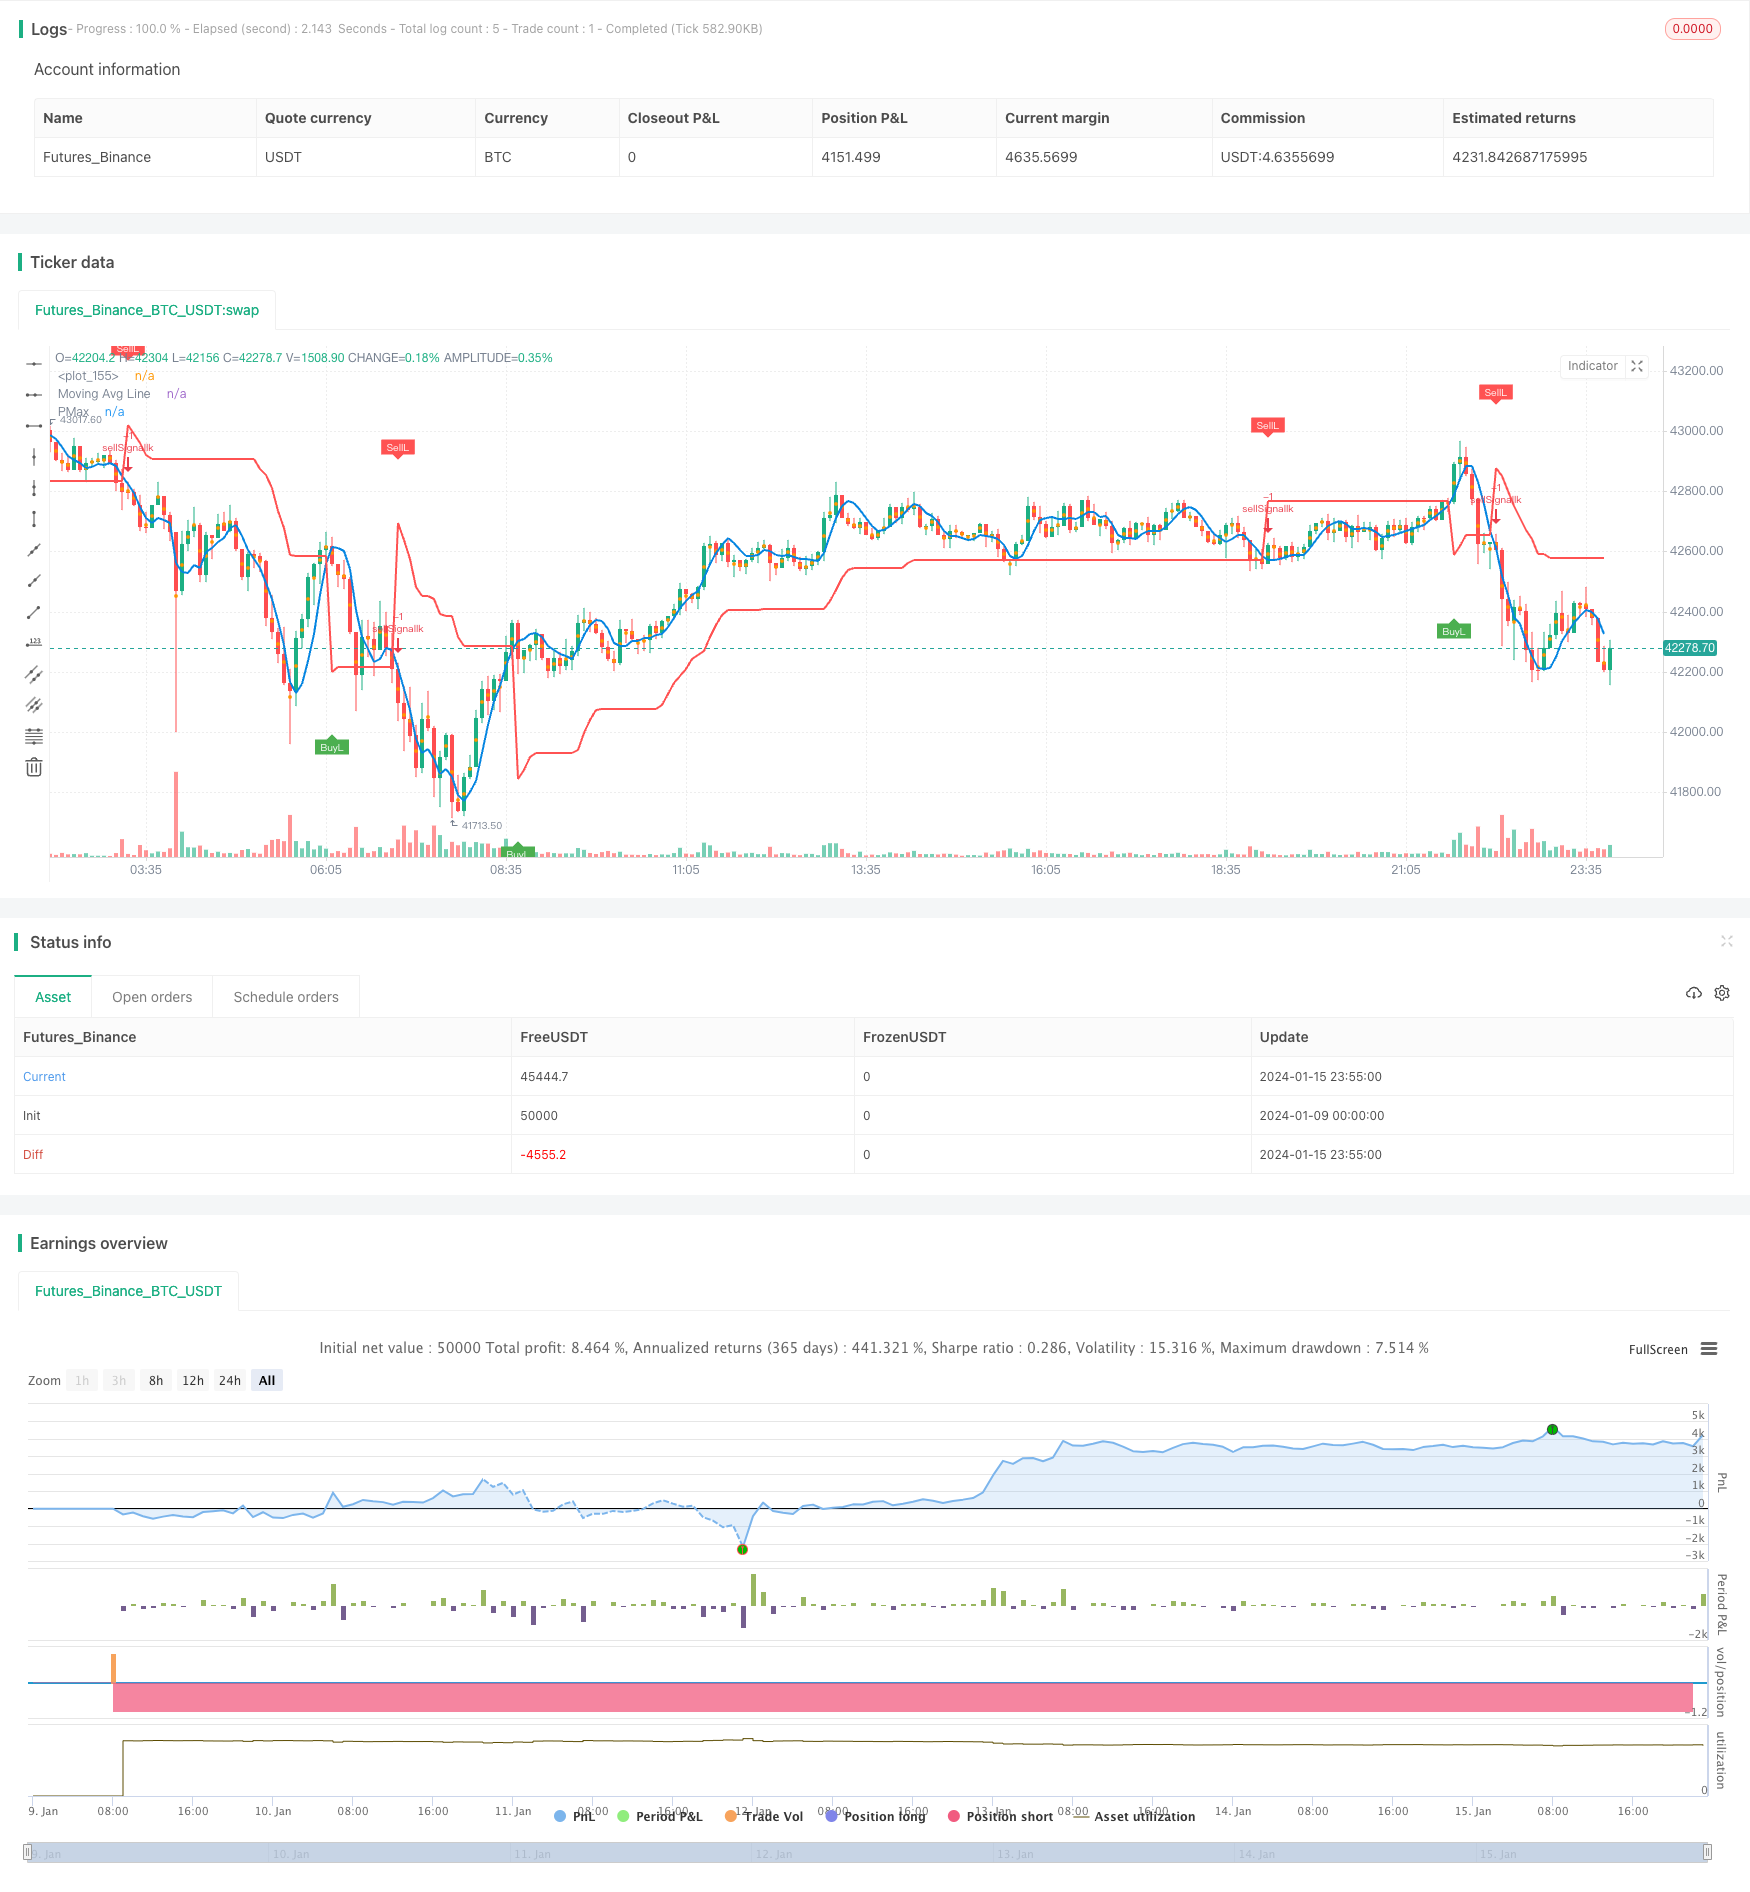
/*backtest
start: 2024-01-09 00:00:00
end: 2024-01-16 00:00:00
period: 5m
basePeriod: 1m
exchanges: [{"eid":"Futures_Binance","currency":"BTC_USDT"}]
*/

//@version=4
// This source code is subject to the terms of the Mozilla Public License 2.0 at https://mozilla.org/MPL/2.0/
// © KivancOzbilgic
//developer: @KivancOzbilgic
//author: @KivancOzbilgic

strategy(title="Profit Maximizer PMax", overlay=true,
     pyramiding=0, initial_capital=1000,
     commission_type=strategy.commission.cash_per_order,
     commission_value=0.025, slippage=2)


src = input(hl2, title="Source")
Periods = input(title="ATR Length", type=input.integer, defval=10)
Multiplier = input(title="ATR Multiplier", type=input.float, step=0.1, defval=3.0)
mav = input(title="Moving Average Type", defval="ZLEMA", options=["SMA", "EMA", "WMA", "TMA", "VAR", "WWMA", "ZLEMA", "TSF"])
length =input(10, "Moving Average Length", minval=1)
changeATR= input(title="Change ATR Calculation Method ?", type=input.bool, defval=true)
showsupport = input(title="Show Moving Average?", type=input.bool, defval=true)
showsignalsk = input(title="Show Crossing Signals?", type=input.bool, defval=true)
showsignalsc = input(title="Show Price/Pmax Crossing Signals?", type=input.bool, defval=false)
highlighting = input(title="Highlighter On/Off ?", type=input.bool, defval=true)

usePosSize = input(title="Use Position Sizing?", type=input.bool, defval=true)
riskPerc   = input(title="Risk %", type=input.float, defval=0.5, step=0.25)

// Make input options that configure backtest date range
startDate = input(title="Start Date", type=input.integer,
     defval=1, minval=1, maxval=31)
startMonth = input(title="Start Month", type=input.integer,
     defval=1, minval=1, maxval=12)
startYear = input(title="Start Year", type=input.integer,
     defval=2019, minval=1800, maxval=2100)

endDate = input(title="End Date", type=input.integer,
     defval=1, minval=1, maxval=31)
endMonth = input(title="End Month", type=input.integer,
     defval=12, minval=1, maxval=12)
endYear = input(title="End Year", type=input.integer,
     defval=2021, minval=1800, maxval=2100)

// Look if the close time of the current bar
// falls inside the date range
inDateRange = true

atr2 = sma(tr, Periods)
atr= changeATR ? atr(Periods) : atr2
valpha=2/(length+1)
vud1=src>src[1] ? src-src[1] : 0
vdd1=src<src[1] ? src[1]-src : 0
vUD=sum(vud1,9)
vDD=sum(vdd1,9)
vCMO=nz((vUD-vDD)/(vUD+vDD))
VAR=0.0
VAR:=nz(valpha*abs(vCMO)*src)+(1-valpha*abs(vCMO))*nz(VAR[1])
wwalpha = 1/ length
WWMA = 0.0
WWMA := wwalpha*src + (1-wwalpha)*nz(WWMA[1])
zxLag = length/2==round(length/2) ? length/2 : (length - 1) / 2
zxEMAData = (src + (src - src[zxLag]))
ZLEMA = ema(zxEMAData, length)
lrc = linreg(src, length, 0)
lrc1 = linreg(src,length,1)
lrs = (lrc-lrc1)
TSF = linreg(src, length, 0)+lrs
getMA(src, length) =>
    ma = 0.0
    if mav == "SMA"
        ma := sma(src, length)
        ma

    if mav == "EMA"
        ma := ema(src, length)
        ma

    if mav == "WMA"
        ma := wma(src, length)
        ma

    if mav == "TMA"
        ma := sma(sma(src, ceil(length / 2)), floor(length / 2) + 1)
        ma

    if mav == "VAR"
        ma := VAR
        ma

    if mav == "WWMA"
        ma := WWMA
        ma

    if mav == "ZLEMA"
        ma := ZLEMA
        ma

    if mav == "TSF"
        ma := TSF
        ma
    ma

MAvg=getMA(src, length)
longStop = MAvg - Multiplier*atr
longStopPrev = nz(longStop[1], longStop)
longStop := MAvg > longStopPrev ? max(longStop, longStopPrev) : longStop
shortStop = MAvg + Multiplier*atr
shortStopPrev = nz(shortStop[1], shortStop)
shortStop := MAvg < shortStopPrev ? min(shortStop, shortStopPrev) : shortStop
dir = 1
dir := nz(dir[1], dir)
dir := dir == -1 and MAvg > shortStopPrev ? 1 : dir == 1 and MAvg < longStopPrev ? -1 : dir
PMax = dir==1 ? longStop: shortStop
plot(showsupport ? MAvg : na, color=#0585E1, linewidth=2, title="Moving Avg Line")
pALL=plot(PMax, color=color.red, linewidth=2, title="PMax", transp=0)

alertcondition(cross(MAvg, PMax), title="Cross Alert", message="PMax - Moving Avg Crossing!")
alertcondition(crossover(MAvg, PMax), title="Crossover Alarm", message="Moving Avg BUY SIGNAL!")
alertcondition(crossunder(MAvg, PMax), title="Crossunder Alarm", message="Moving Avg SELL SIGNAL!")
alertcondition(cross(src, PMax), title="Price Cross Alert", message="PMax - Price Crossing!")
alertcondition(crossover(src, PMax), title="Price Crossover Alarm", message="PRICE OVER PMax - BUY SIGNAL!")
alertcondition(crossunder(src, PMax), title="Price Crossunder Alarm", message="PRICE UNDER PMax - SELL SIGNAL!")


// Calculate position size
riskEquity  = (riskPerc / 100) * strategy.equity
atrCurrency = (atr(20) * syminfo.pointvalue)
posSize     = usePosSize ? floor(riskEquity / atrCurrency) : 1

//Long
buySignalk = crossover(MAvg, PMax)
plotshape(buySignalk and showsignalsk ? PMax*0.995 : na, title="Buy", text="BuyL", location=location.absolute, style=shape.labelup, size=size.tiny, color=color.green, textcolor=color.white, transp=0)


if(buySignalk and showsignalsk and inDateRange)
    strategy.entry(id="buySignalk", long=true, qty=posSize)

sellSignallk = crossunder(MAvg, PMax)
plotshape(sellSignallk and showsignalsk ? PMax*1.005 : na, title="Sell", text="SellL", location=location.absolute, style=shape.labeldown, size=size.tiny, color=color.red, textcolor=color.white, transp=0)

if(sellSignallk and showsignalsk and inDateRange)
    strategy.order(id="sellSignallk", long=false, qty=strategy.position_size)

//Short
buySignalc = crossover(src, PMax)
plotshape(buySignalc and showsignalsc ? PMax*0.995 : na, title="Buy", text="BuyS", location=location.absolute, style=shape.labelup, size=size.tiny, color=#0F18BF, textcolor=color.white, transp=0)

if(buySignalc and showsignalsc and inDateRange)
    strategy.entry(id="BuyS", long=false, qty=posSize)

sellSignallc = crossunder(src, PMax)
plotshape(sellSignallc and showsignalsc ? PMax*1.005 : na, title="Sell", text="SellS", location=location.absolute, style=shape.labeldown, size=size.tiny, color=#0F18BF, textcolor=color.white, transp=0)

if(sellSignallc and showsignalsc and inDateRange)
    strategy.order(id="SellS", long=true, qty=abs(strategy.position_size))

mPlot = plot(ohlc4, title="", style=plot.style_circles, linewidth=0,display=display.none)

longFillColor = highlighting ? (MAvg>PMax ? color.green : na) : na
shortFillColor = highlighting ? (MAvg<PMax ? color.red : na) : na

fill(mPlot, pALL, title="UpTrend Highligter", color=longFillColor)
fill(mPlot, pALL, title="DownTrend Highligter", color=shortFillColor)

// Exit open market position when date range ends
if (not inDateRange)
    strategy.close_all()