ボリンジャーバンド交差平均PBインジケーター戦略
概要
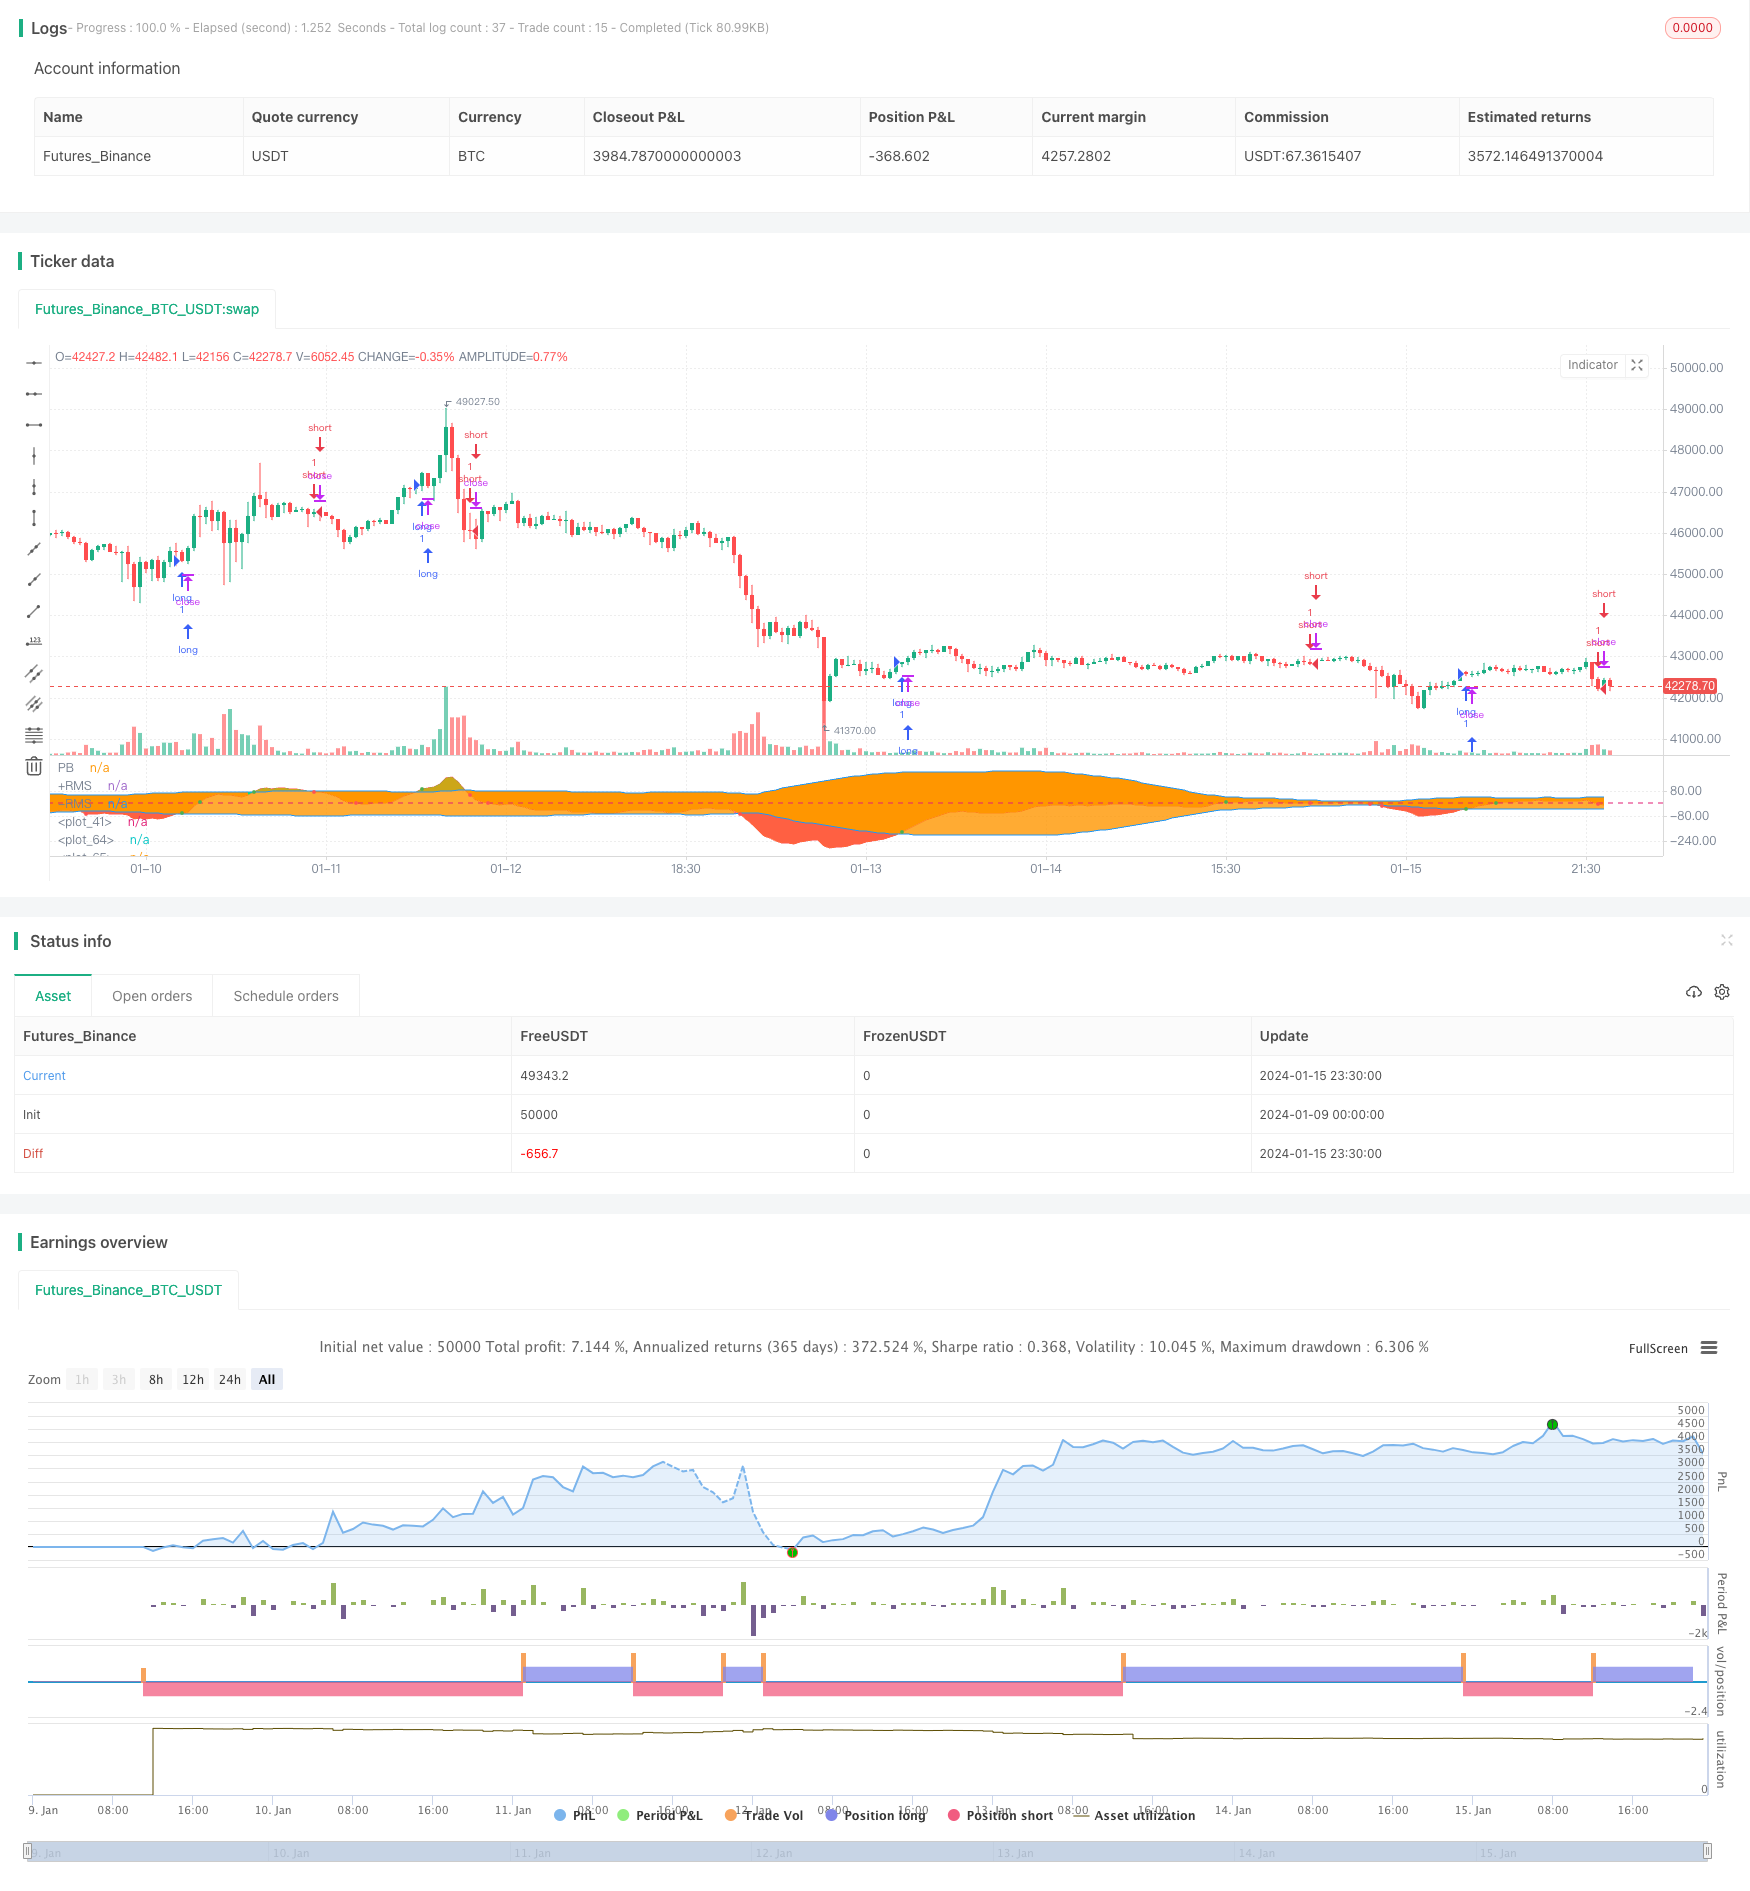
この戦略は,平均PB指数とブリン帯の下落を計算して,PB指数とブリン帯の下落の金叉死叉関係を判断し,買入と売り出しのシグナルを生成する.PB指数が上向きにブリン帯の中間線や下落を突破すると,買入シグナルを生成する.PB指数が下向きにブリン帯中間線や上線を突破すると,売り出しシグナルを生成する.
戦略原則
戦略の核心指標は平均PB指標である.平均PB指標は,均線システムの安定性とPB指標の感度とを組み合わせ,価格変化の傾向を表すために,2つの異なる周期平均線の差値を使用し,空白状態を見ることを判断する.
この戦略はまた,ブリン帯の指標を用いて,株価の超買超売を判断する.ブリン帯の指標は,中軌道,上軌道,下軌道3つの曲線で構成されている.中軌道線は,n日の移動平均であり,上下軌は,中軌道と歴史の変動率から計算される.株価が上軌道に近づくと超買区,下軌道に近づくと超売り区,中軌道近くで合理的な株価区である.
全体として,この戦略は,平均PB指標を巧みに使用して,株価の上昇下落の傾向を判断し,ブリン帯指標を補助して,超買い超売り状況を判断し,両者の指標関係の中で買い売り点を探し,典型的な数値指標取引戦略に属します.
優位分析
この戦略の主な利点は
- 平均PB指標を用いて株価の動向の変化を判断し,高い感度
- ブリン帯指数による超買超売区の識別により,買賣点を特定する精度が向上する
- 戦略はシンプルで実行しやすい
- 戦略的利益が大きいと反省したデータ
リスク分析
この戦略の主なリスクは
- 平均PB指数とブリン帯指数は,歴史的なデータ計算に依存し,株価が大きく変動すると,誤ったシグナルが生じやすい.
- PB指数とブリン帯は,パラメータ設定に敏感であり,不適切な設定により,誤った取引が多発する可能性があります.
- 戦略の実施期間に,経済危機,政策の変更など,マクロ環境の変化が株価に大きな影響を与える可能性があり,戦略の失敗につながる可能性があります.
上記のリスクに対して,最適化パラメータ設定,厳格な止損,大環境要因を考慮し,人工モニタリングなどの方法によってリスク回避を行うことができる.
最適化の方向
この戦略の最適化方向は以下の通りです.
- 平均PB指数とブリン帯のパラメータを最適化して最適なパラメータの組み合わせを見つける
- MACD,KDJなどの他の指標のフィルターを追加して,戦略の効果を高める
- 単一損失を効果的に制御するための止損メカニズムを増やす
- より大きなタイムサイクル指標と組み合わせて,大きな方向性を判断し,逆転取引を避ける
要約する
この戦略は,平均PB指標を中心に,ブリン帯で判断し,操作が簡単,感度が高く,反測パフォーマンスは良好である.継続的な最適化パラメータ設定,他の指標補助,厳格な止損などの措置を追加することによって,戦略の収益率と安定性をさらに向上させることができる.実験的に検証し,適用する価値がある.
/*backtest
start: 2024-01-09 00:00:00
end: 2024-01-16 00:00:00
period: 30m
basePeriod: 15m
exchanges: [{"eid":"Futures_Binance","currency":"BTC_USDT"}]
*/

//@version=4
strategy("BandPass EOS", overlay=false, initial_capital = 1000)

src = input(close, "Source", input.source)
Period1 = input(41, "Fast Period", input.integer)
Period2 = input(54, "Slow Period", input.integer)
showBG = input(false, "Show crosses on background?", input.bool)
UseReversalStop = input(true, "Use additional triggers?", input.bool)

//Super Passband Filter
a1 = 0.0
a2 = 0.0
PB = 0.0
RMS = 0.0
if bar_index > Period1
    a1 := 5 / Period1
    a2 := 5 / Period2
    PB := (a1 - a2) * src + (a2 * (1 - a1) - a1 * (1 - a2)) * src[1] +
       (1 - a1 + 1 - a2) * nz(PB[1]) - (1 - a1) * (1 - a2) * nz(PB[2])
    for i = 0 to 49 by 1
        RMS := RMS + PB[i] * PB[i]
        RMS
    RMS := sqrt(RMS / 40)
    RMS
z = 0

buy = PB > PB [5] and crossover(PB, -RMS) or PB > PB [5] and crossover (PB, RMS) or PB > PB [5] and crossover (PB, z)
sell = PB < PB [5] and crossunder(PB, RMS) or PB < PB [5] and crossunder (PB, -RMS) or PB < PB [5] and crossunder (PB, z)
signal = buy ? 1 : sell ? -1 : 0
bg = buy ? color.green : sell ? color.red : color.white
bg := showBG ? bg : na
upperFill = PB>RMS ? color.lime : na
lowerFill = PB<-RMS ? color.red : na

p1 = plot(PB,"PB",color.red)
p2 = plot(RMS,"+RMS",color.blue)
p3 = plot(-RMS,"-RMS",color.blue)
bgcolor(bg)
fill(p1,p2,upperFill)
fill(p1,p3,lowerFill)
hline(0)


//PERIOD
testStartYear = input(2018, "Backtest Start Year")
testStartMonth = input(1, "Backtest Start Month")
testStartDay = input(1, "Backtest Start Day")
testPeriodStart = timestamp(testStartYear,testStartMonth,testStartDay, 0, 0)

testStopYear = input(2019, "Backtest Stop Year")
testStopMonth = input(12, "Backtest Stop Month")
testStopDay = input(31, "Backtest Stop Day")
testPeriodStop = timestamp(testStopYear,testStopMonth,testStopDay, 0, 0)

testPeriod() => true

lcolor = PB > PB [5] and crossover(PB, -RMS) or PB > PB [5] and crossover (PB, RMS) or PB > PB [5] and crossover (PB, z)
scolor = PB < PB [5] and crossunder(PB, RMS) or PB < PB [5] and crossunder (PB, -RMS) or PB < PB [5] and crossunder (PB, z)

c1 = (PB < PB [5] and crossunder(PB, RMS) or PB < PB [5] and crossunder (PB, -RMS) or PB < PB [5] and crossunder (PB, z))
c2 = (PB > PB [5] and crossover(PB, -RMS) or PB > PB [5] and crossover (PB, RMS) or PB > PB [5] and crossover (PB, z))

plot (c1 ? PB : na, style = plot.style_circles, color = color.red, linewidth = 3)
plot (c2 ? PB : na, style = plot.style_circles, color = color.green, linewidth = 3)

if (PB > PB [5] and crossover(PB, -RMS) or PB > PB [5] and crossover (PB, RMS) or PB > PB [5] and crossover (PB, z))
    strategy.entry("long", strategy.long, when = testPeriod())


if (PB < PB [5] and crossunder(PB, RMS) or PB < PB [5] and crossunder (PB, -RMS) or PB < PB [5] and crossunder (PB, z))
    strategy.entry("short", strategy.short, when = testPeriod())