ダブル確認反転トレンドフォロー戦略
作成日:
2024-01-17 18:03:50
最終変更日:
2024-01-17 18:03:50
コピー:
1
クリック数:
706
1
フォロー
1750
フォロワー
概要
双重確認反転トレンド追跡戦略は123形状反転戦略と支柱抵抗位突破戦略を融合し,価格反転信号の双重確認を実現し,それによって部分的なノイズ取引信号をフィルターし,戦略の勝利率を向上させる.
この戦略は主に中長線取引に適用されます.これは,価格が反転信号を形成するときに,同時に,重要なサポートまたはレジスタンス値を突破したかどうかを検出し,二重確認後に取引信号を生成します.
戦略原則
双重確認の逆転トレンド追跡戦略は,以下の2つの部分から構成されています.
- 123形反転戦略
前2つのK線の閉盘価格を比較して,価格が逆転形状に現れているかどうかを判断する. ランダムな指標と組み合わせて,波動度を判断し,誤報の機会をフィルターする.
- 阻力位突破戦略を支える
前日の最高値,最低値,閉盤価格を使用してサポートとレジスタンス値を計算します. 価格がこれらのキー値を突破するかどうかを監視します.
価格が両策の取引シグナルを同時に満たしているときに,反転シグナルが二重確認され,最終的な取引指示が生成されると考えられる.
戦略的優位性
- 双信号確認により信頼性が向上する
- 逆転の追跡 逆転の機会を把握する
- ランダムな指標の補助で,偽突破を効果的にフィルタリング
戦略リスク
- 双重確認は,フィルターに少数の機会を 導きます
- 大潮の逆転の失敗のリスク
パラメータの最適化により,二重確認の厳格性を調整し,戦略の勝利率と稼ぎ回数をバランスさせることができる.
戦略の最適化
- ストキャスティックパラメータを調整し,波動のフィルタを最適化します.
- 異なる日線計算のサポート抵抗位をテストする
- ストップ・ロスを増やし,トレンドの逆転のリスクを低減する
要約する
二重確認反転トレンド追跡戦略は,反転形状と重要な位突破を成功裏に組み合わせ,信号の質を向上させながら取引回数を保証し,中長期トレンド取引に適した戦略である.パラメータ調整とストップ・ローズ戦略の追加は,戦略の安定性と実用性をさらに強化する.
ストラテジーソースコード
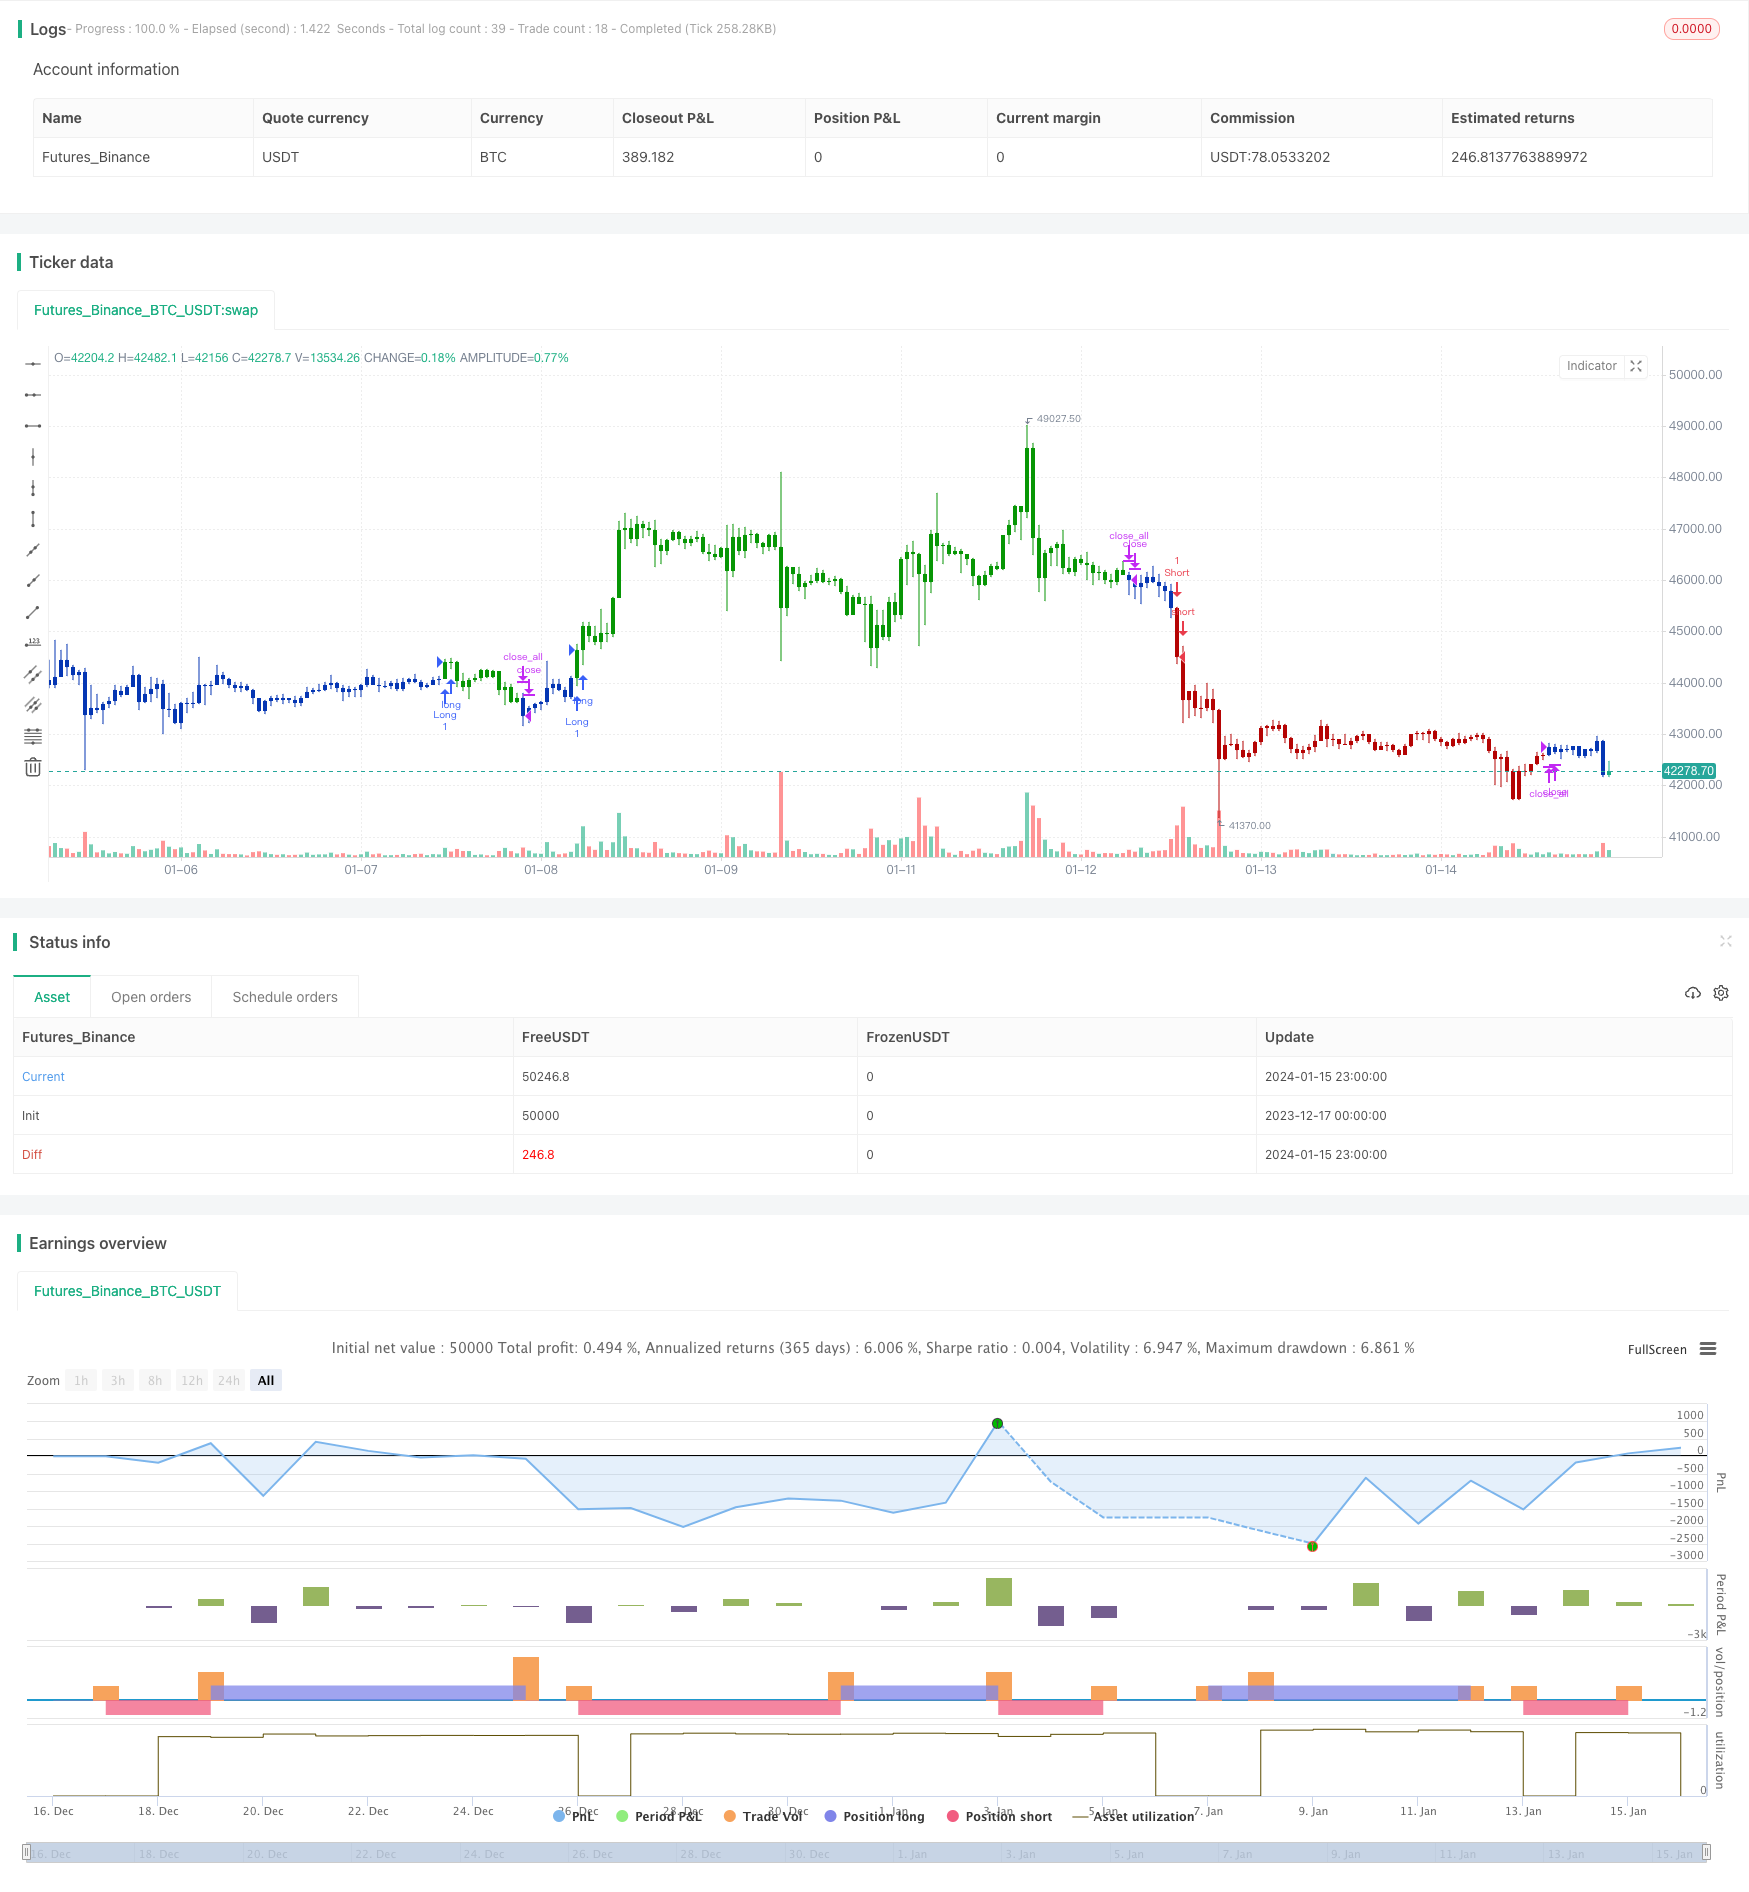
/*backtest
start: 2023-12-17 00:00:00
end: 2024-01-16 00:00:00
period: 1h
basePeriod: 15m
exchanges: [{"eid":"Futures_Binance","currency":"BTC_USDT"}]
*/

//@version=4
////////////////////////////////////////////////////////////
//  Copyright by HPotter v1.0 15/09/2020
// This is combo strategies for get a cumulative signal.
//
// First strategy
// This System was created from the Book "How I Tripled My Money In The
// Futures Market" by Ulf Jensen, Page 183. This is reverse type of strategies.
// The strategy buys at market, if close price is higher than the previous close
// during 2 days and the meaning of 9-days Stochastic Slow Oscillator is lower than 50.
// The strategy sells at market, if close price is lower than the previous close price
// during 2 days and the meaning of 9-days Stochastic Fast Oscillator is higher than 50.
//
// Second strategy
// The name ‘Floor-Trader Pivot,’ came from the fact that Pivot points can
// be calculated quickly, on the fly using price data from the previous day
// as an input. Although time-frames of less than a day can be used, Pivots are
// commonly plotted on the Daily Chart; using price data from the previous day’s
// trading activity.
//
// WARNING:
// - For purpose educate only
// - This script to change bars colors.
////////////////////////////////////////////////////////////
Reversal123(Length, KSmoothing, DLength, Level) =>
    vFast = sma(stoch(close, high, low, Length), KSmoothing)
    vSlow = sma(vFast, DLength)
    pos = 0.0
    pos := iff(close[2] < close[1] and close > close[1] and vFast < vSlow and vFast > Level, 1,
	         iff(close[2] > close[1] and close < close[1] and vFast > vSlow and vFast < Level, -1, nz(pos[1], 0)))
	pos


FPP() =>
    pos = 0
    xHigh  = security(syminfo.tickerid,"D", high[1])
    xLow   = security(syminfo.tickerid,"D", low[1])
    xClose = security(syminfo.tickerid,"D", close[1])
    vPP = (xHigh+xLow+xClose) / 3
    vR1 = (vPP * 2) - xLow
    vS1 = (vPP * 2) - xHigh
    pos := iff(close > vR1, 1,
             iff(close < vS1, -1, nz(pos[1], 0)))
    pos

strategy(title="Combo Backtest 123 Reversal & Floor Pivot Points", shorttitle="Combo", overlay = true)
Length = input(15, minval=1)
KSmoothing = input(1, minval=1)
DLength = input(3, minval=1)
Level = input(50, minval=1)
//-------------------------
reverse = input(false, title="Trade reverse")
posReversal123 = Reversal123(Length, KSmoothing, DLength, Level)
posFPP = FPP()
pos = iff(posReversal123 == 1 and posFPP == 1 , 1,
	   iff(posReversal123 == -1 and posFPP == -1, -1, 0))
possig = iff(reverse and pos == 1, -1,
          iff(reverse and pos == -1 , 1, pos))
if (possig == 1)
    strategy.entry("Long", strategy.long)
if (possig == -1)
    strategy.entry("Short", strategy.short)
if (possig == 0)
    strategy.close_all()
barcolor(possig == -1 ? #b50404: possig == 1 ? #079605 : #0536b3 )