平均真の範囲に基づくスーパートレンド戦略
作成日:
2024-01-18 12:26:33
最終変更日:
2024-01-18 12:26:33
コピー:
2
クリック数:
749
1
フォロー
1751
フォロワー
概要
この戦略は,平均真波幅 (Average True Range, ATR) の指標に基づいて超トレンド (SuperTrend) チャンネルを構築し,価格が超トレンドチャネルを突破した上で買入と売却のシグナルを生成する.この戦略は,トレンド追跡とストップ管理の優位性を組み合わせて,トレンド方向を効果的に追跡することができる.
戦略原則
超トレンドチャネルの上軌と下軌は,次の式で計算される.
上線 = (最高価格 + 最低価格) / 2 + ATR (n) *因子 下線 = (最高価格 + 最低価格) / 2 - ATR (n) *因子
その中で,ATR ((n) はn日の平均真波幅を表し,因子は可調パラメータで,デフォルトは3。
閉盤価格が上位線より高いときは看板信号,閉盤価格が下位線より低いときは看板信号である.戦略は,看板と看板の信号に基づいて入場と出場を決定する.
優位分析
- ATR指数は,市場波幅に基づいてチャネル範囲を決定し,トレンドを効果的に追跡できます.
- 経路の突破を組み合わせて市場への参入のタイミングを判断し,偽突破を避ける
- 経路の範囲は,因子パラメータに応じて調整され,異なる波動率の市場に対応できます.
- トレンドトラッキングとストップ・マネジメントの統合
リスク分析
- 因子パラメータの不適切な設定は,利益不足または止損過剰を引き起こす可能性があります.
- 超トレンドチャネルからの取引シグナルが頻繁に発生し,市場が揺れ動いているときに過剰取引が起こる可能性があります.
- ATR周期パラメータと因子パラメータのマッチングを最適化する必要があります.
リスク対策:
- 各市場に対応した調整因子パラメータ,過密のストップローズリスクを低減する
- 条件のフィルタを追加し,波動的な市場から頻繁に取引を避ける
- 市場変動率,保有時間などの要素を総合的に考慮してATR周期にマッチする
最適化の方向
- 他の指標と組み合わせたフィルタリング信号で,入場タイミングを最適化
- モバイルストップ・トラッキングを追加し,より多くの利益をロックする
- 各種,周期パラメータ最適化
- ATR周期と因子パラメータのマッチングを最適化
要約する
この戦略は,超トレンドチャネルを利用してトレンド追跡とストップ管理を実現する.ATR周期と因子パラメータのマッチングは戦略の効果に不可欠である.次のステップは,パラメータ最適化,信号フィルタリングなどの面で戦略をさらに最適化して,より複雑な市場環境に対応できるようにする.
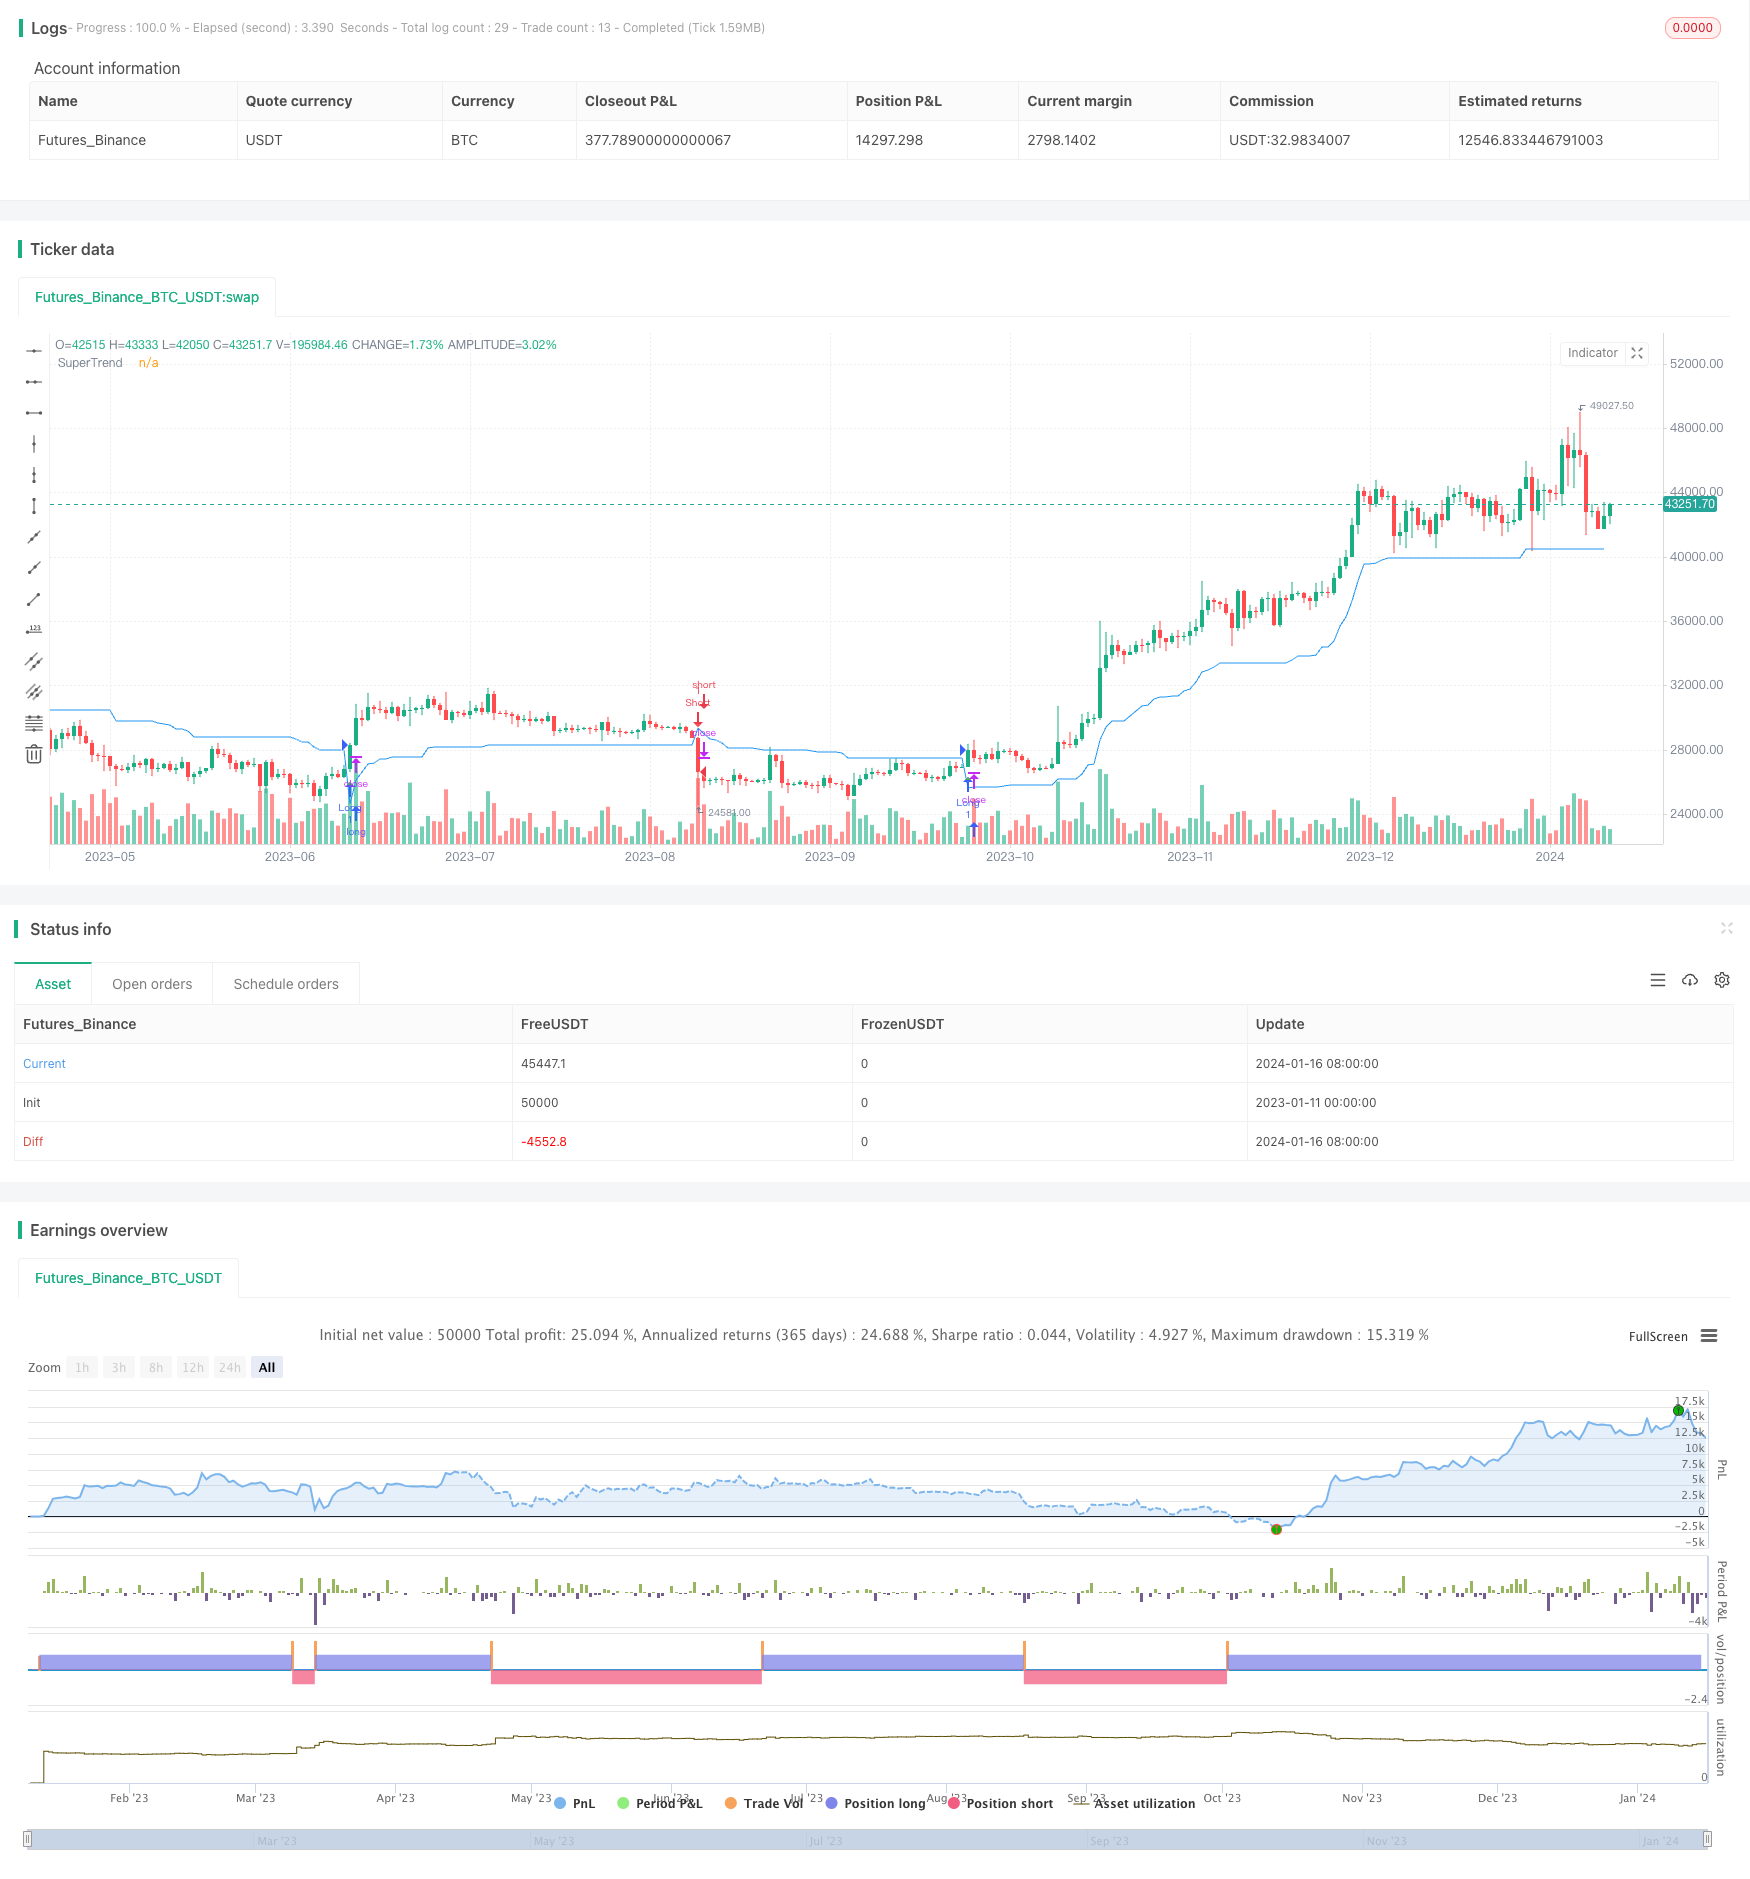
ストラテジーソースコード
/*backtest
start: 2023-01-11 00:00:00
end: 2024-01-17 00:00:00
period: 1d
basePeriod: 1h
exchanges: [{"eid":"Futures_Binance","currency":"BTC_USDT"}]
*/

//@version=5
strategy("Supertrend Backtest", shorttitle="STBT", overlay=true)

// Input for ATR Length
atrLength = input.int(10, title="ATR Length", minval=1)
atrFactor = input.float(3.0, title="Factor", minval=0.01, step=0.01)

// Calculate SuperTrend
[supertrend, direction] = ta.supertrend(atrFactor, atrLength)
supertrend := barstate.isfirst ? na : supertrend

// Define entry and exit conditions
longCondition = ta.crossover(close, supertrend)
shortCondition = ta.crossunder(close, supertrend)

// Plot the SuperTrend
plot(supertrend, color=color.new(color.blue, 0), title="SuperTrend")

// Plot Buy and Sell signals
plotshape(series=longCondition, style=shape.triangleup, location=location.belowbar, color=color.green, size=size.small, title="Buy Signal")
plotshape(series=shortCondition, style=shape.triangledown, location=location.abovebar, color=color.red, size=size.small, title="Sell Signal")

// Strategy Entry and Exit
strategy.entry("Long", strategy.long, when=longCondition)
strategy.entry("Short", strategy.short, when=shortCondition)