ダブルBインテリジェント追跡戦略
作成日:
2024-01-18 15:41:20
最終変更日:
2024-01-18 15:41:20
コピー:
2
クリック数:
628
1
フォロー
1750
フォロワー
これは,ブリン帯指数を用いて取引する戦略である.この戦略は,ブリン帯指数を用いて価格が激しく変動するタイミングを認識し,それに応じて購入または販売の決定を行うことを目的としている.
戦略原則
この戦略は,ブリン帯の上軌道,中軌道,下軌道線を計算して,現在の価格が波動領域にあるかどうかを判断し,ポジションを建てるか平にするかを判断する.価格が上軌道に近づくと,多頭極域とみなされ,戦略は平仓を売り出すことを選択する.価格が下軌道に近づくと,空頭極域とみなされ,戦略はポジションを建てるのを選択する.
さらに,戦略はトレンド反転因子を導入し,反転シグナルが発生した場合,対応する買入または売却の決定を誘発します.具体的には,戦略の論理は次のとおりです.
- ブリン帯の上線,中線,下線を計算
- 価格が軌道に突破したかどうかを判断する反転信号
- 中道突破がトレンドシグナル
- 逆転信号として上線または下線近く
- 買入,売却,またはクリア命令を発行
この戦略の基本的な取引論理は以下の通りです. ブリン帯の特性を利用し,トレンドと逆転因子を組み合わせて,波動が強まったときに逆転点をつかんで取引しようとします.
戦略的優位性
この戦略は,通常の移動平均策に比べて,以下の利点があります.
- 価格の急激な変動を捉えるためのより敏感なタイミング
- トレンドと逆転要因を組み合わせて,過早な逆転による損失を回避する
- フィルター効果があり,波動のない地域での無駄な取引を避ける
- 中道で主要なトレンドの方向を判断し,取引数を減らす
- 誤判の可能性を減らすため,反転フィルタリング条件を追加しました.
全体として,この戦略は,ブリン帯と価格主体の判断をうまく組み合わせ,合理的な転換点で取引し,一定の利潤レベルを保証し,リスクをコントロールしています.
リスクと最適化
しかし,この戦略にはリスクもあります.
- ブリン帯のパラメータが正しく設定されておらず,価格変動を十分に捉えられない
- 逆転信号の判断は不正確,逆転を逃す,または逆転を誤判する
- トレンドがはっきりしない時,中軌道の信号は効果が悪い.
未来に最適化できるのは以下の点です.
- ブリン帯のパラメータを異なる品種パラメータに合わせて最適化
- 機械学習モデルの判断の逆転確率を増加させる
- トレンドがわからない場合は,他の指標に切り替える
- 取引信号をフィルタリングするために,より多くの価格形状を組み合わせます.
要約する
この戦略は,全体的に典型的なブリン帯取引戦略のテンプレートである.これは,ブリン帯のみを使用すると容易に発生する多くの無効取引の欠点を回避し,トレンド反転判断を導入することで,効率的なフィルタリング信号を,理論的には優れた戦略パフォーマンスを得ることができる.しかし,パラメータ設定と信号フィルタリングの面では,戦略パラメータを優化し,誤判の確率を下げるために,さらなる最適化と改善が必要である.
ストラテジーソースコード
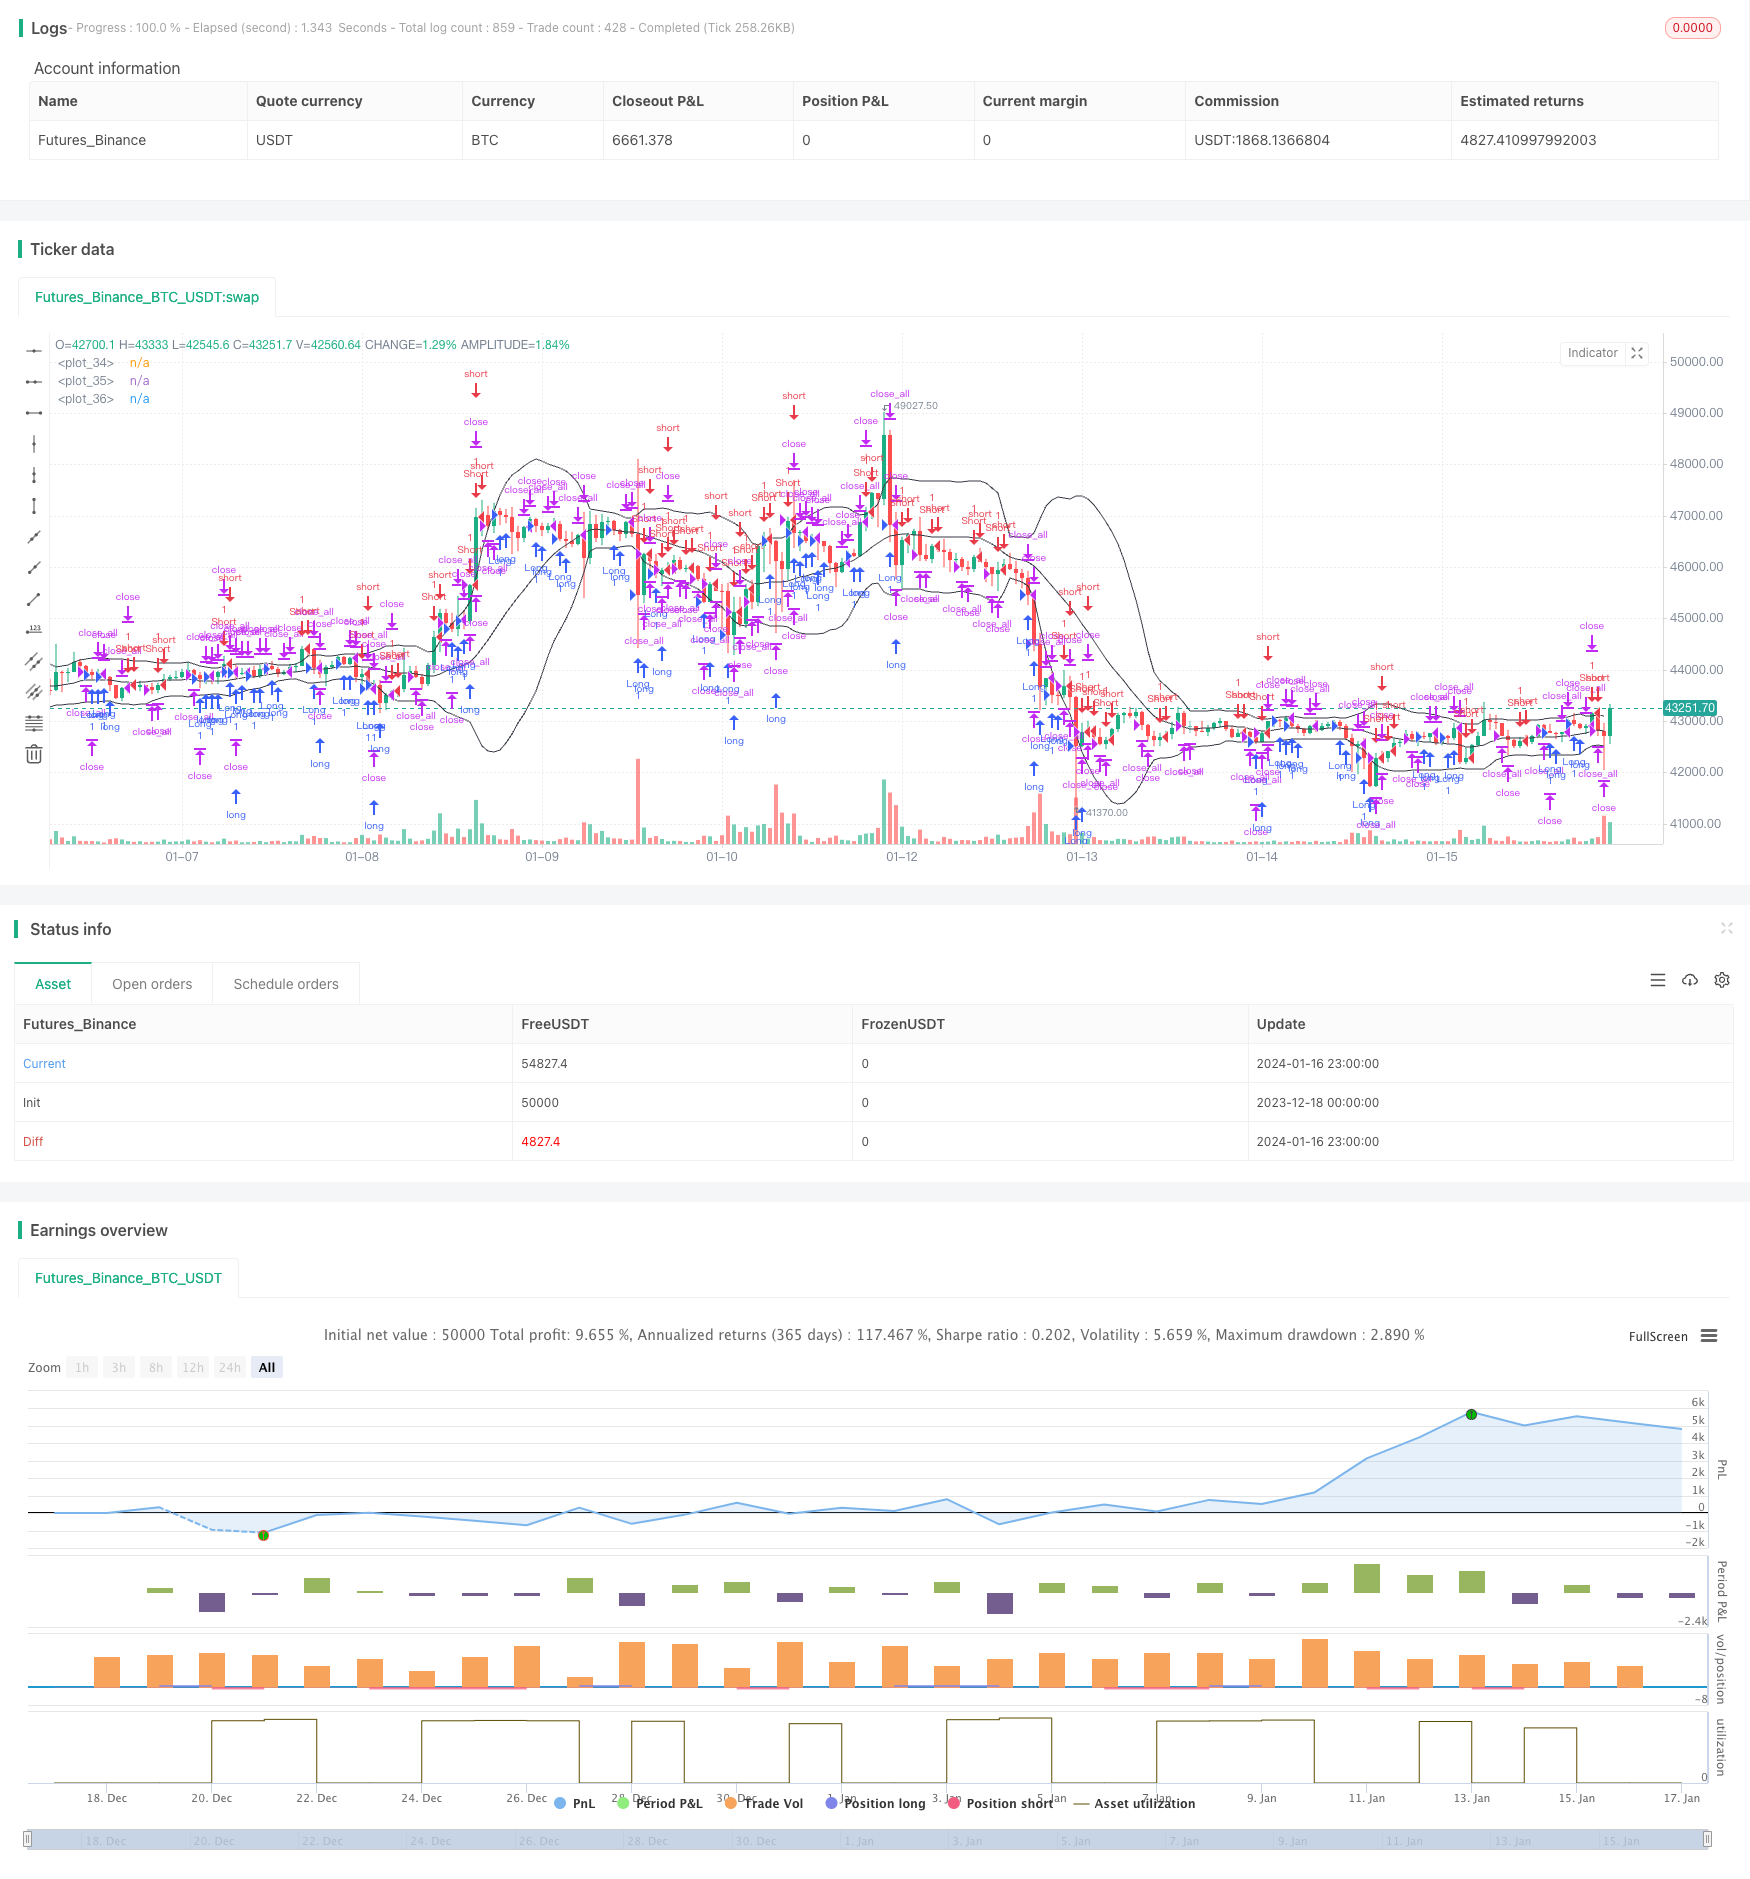
/*backtest
start: 2023-12-18 00:00:00
end: 2024-01-17 00:00:00
period: 1h
basePeriod: 15m
exchanges: [{"eid":"Futures_Binance","currency":"BTC_USDT"}]
*/

//Noro
//2018

//@version=3
strategy("Noro's Bollinger Strategy v1.2", shorttitle = "Bollinger str 1.2", overlay = true )

//Settings
needlong = input(true, defval = true, title = "Long")
needshort = input(true, defval = true, title = "Short")

length = input(20, defval = 20, minval = 1, maxval = 1000, title = "Bollinger Length")
mult = input(2.0, defval = 2.0, minval = 0.001, maxval = 50, title = "Bollinger Mult")
source = input(ohlc4, defval = ohlc4, title = "Bollinger Source")

uset = input(true, defval = true, title = "Use trend entry")
usect = input(true, defval = true, title = "Use counter-trend entry")

fromyear = input(2018, defval = 2018, minval = 1900, maxval = 2100, title = "From Year")
toyear = input(2100, defval = 2100, minval = 1900, maxval = 2100, title = "To Year")
frommonth = input(01, defval = 01, minval = 01, maxval = 12, title = "From Month")
tomonth = input(12, defval = 12, minval = 01, maxval = 12, title = "To Month")
fromday = input(01, defval = 01, minval = 01, maxval = 31, title = "From day")
today = input(31, defval = 31, minval = 01, maxval = 31, title = "To day")
showbands = input(true, defval = true, title = "Show Bollinger Bands")

//Bollinger Bands
basis = sma(source, length)
dev = mult * stdev(source, length)
upper = basis + dev
lower = basis - dev

//Lines
col = showbands ? black : na
plot(upper, linewidth = 1, color = col)
plot(basis, linewidth = 1, color = col)
plot(lower, linewidth = 1, color = col)

//Body
body = abs(close - open)
abody = ema(body, 30)

//Signals
bar = close > open ? 1 : close < open ? -1 : 0
up1 = bar == -1 and close >= basis and close < upper and (close < strategy.position_avg_price or strategy.position_size == 0) and uset
dn1 = bar == 1 and close <= basis and close > lower and (close > strategy.position_avg_price or strategy.position_size == 0) and uset
up2 = close <= lower and usect
dn2 = close >= upper and usect
exit = (strategy.position_size > 0 and close > open) or (strategy.position_size < 0 and close < open) and body > abody / 2

//Trading
if up1 or up2
    strategy.entry("Long", strategy.long, needlong == false ? 0 : na)

if dn1 or dn2
    strategy.entry("Short", strategy.short, needshort == false ? 0 : na)

if exit
    strategy.close_all()