ダブルEMAとRSIを組み合わせたトレンドフォロー戦略
概要
この戦略は,双重EMAとRSIの指数を組み合わせて価格のトレンドを識別し,トレンドの方向に転じるときに間に合うように入場する.具体的には,戦略は,長周期のEMAを使用して大トレンドの方向を判断し,RSIの指数を短期間の超買い超売り現象を判断するために使用する.価格が主トレンドの方向に転落したとき,RSIの指数によって取引信号を発信し,トレンドの方向に応じて多行または空行する.
戦略原則
200周期のEMAを使って大トレンドの方向を判断する.上部にEMA線を穿越すると看板信号,下部にEMA線を穿越すると下部信号となる.
RSI指標のパラメータは10周期に設定されている. RSIの上40を突破すると超売り信号,下60を突破すると超買い信号である.
大トレンドが上昇しているとき (価格がEMA線より高いとき),RSI指標の下40の超売りシグナルが発生した場合,多入場を行う.
大トレンドが下方 (価格がEMA線より下方) になると,RSI指標で60の超買い信号が発生した場合,空白で入場する.
ストップロスはATRの4倍. ストップストップはストップロスの2倍で,リスク・リターン比は2:1である.
優位分析
この戦略の最大の利点は,トレンドと反転指標を同時に組み合わせることで,トレンドが引き戻される時に間に合うように入場でき,その結果,より良いパフォーマンスを得ることができるということです.具体的利点は以下の通りです.
双EMAシステムを使用して,主要トレンドの方向を判断し,価格トレンドを効果的に追跡することができる.
RSIは,短期間の超買超売を識別し,入場タイミングを決定する.
ストップローはATR指標によって設定され,市場の変動に応じてストップローの幅を調整することができ,リスク管理に有利である.
トレンド取引の原則を厳格に遵守することで,不必要な取引を削減し,システム上のリスクを低減できます.
リスク分析
この戦略には以下のリスクがあります.
トレンドの揺れが弱まる過程で,誤った取引信号が生じることがあります.このとき,タイミングを判断し,慎重に入場する必要があります.
極端な状況では,ATR指数で設定されたストップは大きすぎたり小さすぎたりして,動的に調整する必要がある.他のストップ方法に代替することも考えられます.
取引シグナルの発生頻度は高い可能性があり,自分の取引頻度好みに適合するかどうかに関心を持つ必要があります.
RSIパラメータが適切に設定されているかどうかには注意を払い,適切な時にパラメータの最適化を行う必要があります.
最適化の方向
この戦略は以下の方向で最適化できます.
MACDなどの他のトレンド指標をテストして,トレンドの方向性を判断することができます.
他の反転指標,例えばKDJ,ブリン帯など,RSIと組み合わせてテストして,よりよい取引シグナルを探すことができる.
機械学習アルゴリズムを導入して,自主的にパラメータを調整することで,ダイナミックな止損と停止を実現することができる.
感情の指標やニュース面などの要素を組み合わせて判断でき,システムの整体的な安定性を高めることができる.
要約する
この戦略は,全体として,トレンド追跡と逆転指標を組み合わせた非常に典型的なショートライン戦略である.双EMAを使用して大トレンドを判断し,同時にRSI指標の逆転特性を利用してトレンドのPullback機会を捉える.原則的に,この戦略は,異なる指標の優位性を組み合わせて,FORMは良好な互補効果である.この戦略の効果は,パラメータ最適化,モデル融合などの手段によって後期に改善された場合,大きく向上する余地がある.
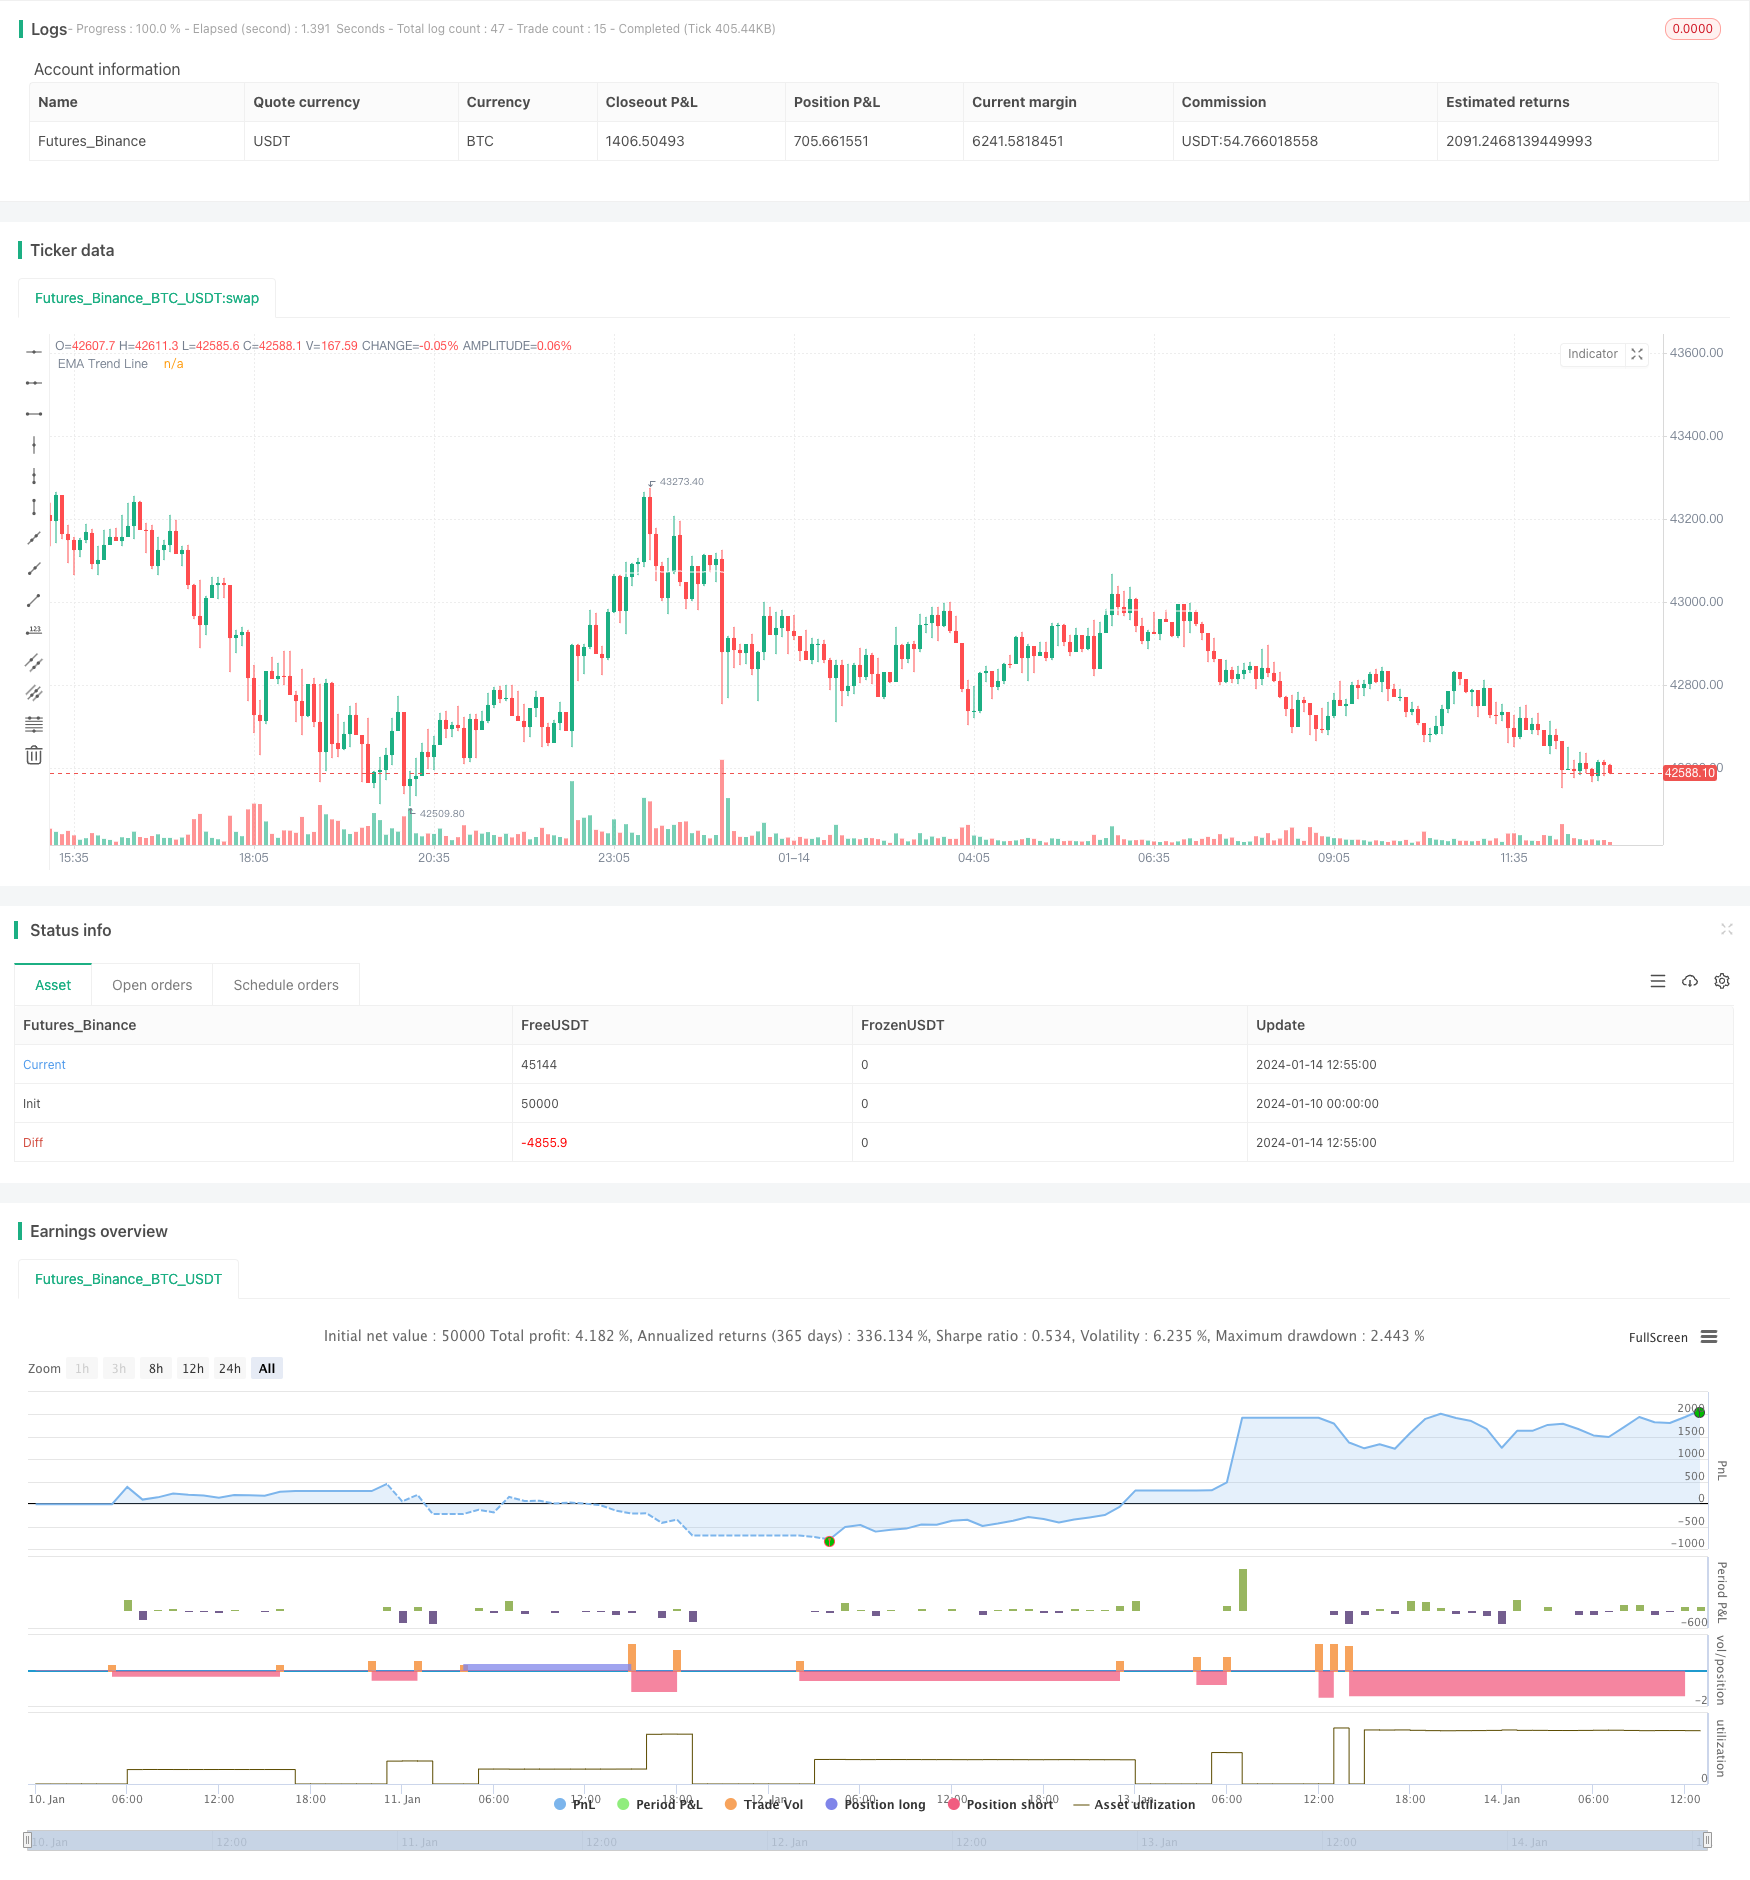
/*backtest
start: 2024-01-10 00:00:00
end: 2024-01-14 13:00:00
period: 5m
basePeriod: 1m
exchanges: [{"eid":"Futures_Binance","currency":"BTC_USDT"}]
*/

// This source code is subject to the terms of the Mozilla Public License 2.0 at https://mozilla.org/MPL/2.0/
// © kevinmck100

// @description
// This strategy is intended to be used as a base template for building new strategies.
//
// It incorporates the following features:
//
//      - Risk management:  Configurable X% loss per stop loss
//                          Configurable R:R ratio
//
//      - Trade entry:      Calculated position size based on risk tolerance
//
//      - Trade exit:       Stop Loss currently configurable ATR multiplier but can be replaced based on strategy
//                          Take Profit calculated from Stop Loss using R:R ratio
//
//      - Backtesting:      Configurable backtesting range by date
//
//      - Trade drawings:   TP/SL boxes drawn for all trades. Can be turned on and off
//                          Trade exit information labels. Can be turned on and off
//                          NOTE: Trade drawings will only be applicable when using overlay strategies
//
//      - Debugging:        Includes section with useful debugging techniques
//
// Strategy conditions:
//
//      - Trade entry:      LONG:   C1: Price is above EMA line
//                                  C2: RSI is crossing out of oversold area
//                          SHORT:  C1: Price is below EMA line
//                                  C2: RSI is crossing out of overbought area
//
//      - Trade exit:       Stop Loss:      Stop Loss ATR multiplier is hit
//                          Take Profit:    R:R multiplier * Stop Loss is hit
//
// The idea is to use RSI to catch pullbacks within the main trend. Note that
// this strategy is intended to be a simple base strategy for building upon.
// It was not designed to be traded in its current form.

//@version=5
INITIAL_CAPITAL = 1000
DEFAULT_COMMISSION = 0.02
MAX_DRAWINGS = 500
IS_OVERLAY = true

strategy("Risk Management Strategy Template", "Strategy Template", overlay = IS_OVERLAY, initial_capital = INITIAL_CAPITAL, currency = currency.NONE, max_labels_count = MAX_DRAWINGS, max_boxes_count = MAX_DRAWINGS, max_lines_count = MAX_DRAWINGS, default_qty_type = strategy.cash, commission_type = strategy.commission.percent, commission_value = DEFAULT_COMMISSION)

// =============================================================================
// INPUTS
// =============================================================================

// ------------------------ Replacable section - Start -------------------------
// ------------------
// Indicator Settings
// ------------------
emaLength           = input.int (200,   "EMA Length          ",             group = "Indicators: Settings",         inline = "IS1", minval = 1,                 tooltip = "EMA line to identify trend direction. Above EMA trend line is bullish. Below EMA trend line is bearish")
rsiLength           = input.int (10,    "RSI Length            ",           group = "Indicators: Settings",         inline = "IS2", minval = 1)

// ----------------------
// Trade Entry Conditions
// ----------------------
rsiOverbought       = input.int (60,    "RSI Overbought        ",           group = "Strategy: Conditions",         inline = "SC1", minval = 50, maxval = 100,  tooltip = "RSI overbought level used to identify pullbacks within the main trend. RSI crossing BELOW this level triggers a SHORT when in a DOWN trend")
rsiOversold         = input.int (40,    "RSI Oversold          ",           group = "Strategy: Conditions",         inline = "SC2", minval = 0,  maxval = 50,   tooltip = "RSI overbought level used to identify pullbacks within the main trend. RSI crossing ABOVE this level triggers a LONG when in an UP trend")

// ---------------------
// Trade Exit Conditions
// ---------------------
atrLength           = input.int  (14,   "Stop Loss ATR Length      ",       group = "Strategy: Exit Conditions",    inline = "EC1", minval = 0,                 tooltip = "Length of ATR used to calculate Stop Loss.")
slAtrMultiplier     = input.float(4,    "Stop Loss ATR Multiplier     ",    group = "Strategy: Exit Conditions",    inline = "EC2", minval = 0, step = 0.1,     tooltip = "Size of StopLoss is determined by multiplication of ATR value. Take Profit is derived from this also by multiplying the StopLoss value by the Risk:Reward multiplier.")
// ------------------------- Replacable section - End --------------------------

// ---------------
// Risk Management
// ---------------
riskReward          = input.float(2,    "Risk : Reward        1 :",         group = "Strategy: Risk Management",    inline = "RM1", minval = 0, step = 0.1,     tooltip = "Previous high or low (long/short dependant) is used to determine TP level. 'Risk : Reward' ratio is then used to calculate SL based of previous high/low level.\n\nIn short, the higher the R:R ratio, the smaller the SL since TP target is fixed by previous high/low price data.")
accountRiskPercent  = input.float(1,    "Portfolio Risk %         ",        group = "Strategy: Risk Management",    inline = "RM1", minval = 0, step = 0.1,     tooltip = "Percentage of portfolio you lose if trade hits SL.\n\nYou then stand to gain\n  Portfolio Risk % * Risk : Reward\nif trade hits TP.")

// ----------
// Date Range
// ----------
startYear           = input.int (2022,  "Start Date       ",                group = 'Strategy: Date Range',         inline = 'DR1', minval    = 1900, maxval = 2100)
startMonth          = input.int (1,     "",                                 group = 'Strategy: Date Range',         inline = 'DR1', options   = [1, 2, 3, 4, 5, 6, 7, 8, 9, 10, 11, 12])
startDate           = input.int (1,     "",                                 group = 'Strategy: Date Range',         inline = 'DR1', options   = [1, 2, 3, 4, 5, 6, 7, 8, 9, 10, 11, 12, 13, 14, 15, 16, 17, 18, 19, 20, 21, 22, 23, 24, 25, 26, 27, 28, 29, 30, 31])
endYear             = input.int (2100,  "End Date      ",                   group = 'Strategy: Date Range',         inline = 'DR2', minval    = 1900, maxval = 2100)
endMonth            = input.int (1,     "",                                 group = 'Strategy: Date Range',         inline = 'DR2', options   = [1, 2, 3, 4, 5, 6, 7, 8, 9, 10, 11, 12])
endDate             = input.int (1,     "",                                 group = 'Strategy: Date Range',         inline = 'DR2', options   = [1, 2, 3, 4, 5, 6, 7, 8, 9, 10, 11, 12, 13, 14, 15, 16, 17, 18, 19, 20, 21, 22, 23, 24, 25, 26, 27, 28, 29, 30, 31])

// ----------------
// Drawing Settings
// ----------------
showTpSlBoxes       = input.bool(false,  "Show TP / SL Boxes",               group = "Strategy: Drawings",           inline = "D1",  tooltip = "Show or hide TP and SL position boxes.\n\nNote: TradingView limits the maximum number of boxes that can be displayed to 500 so they may not appear for all price data under test.")
showLabels          = input.bool(false, "Show Trade Exit Labels",           group = "Strategy: Drawings",           inline = "D2",  tooltip = "Useful labels to identify Profit/Loss and cumulative portfolio capital after each trade closes.\n\nAlso note that TradingView limits the max number of 'boxes' that can be displayed on a chart (max 500). This means when you lookback far enough on the chart you will not see the TP/SL boxes. However you can check this option to identify where trades exited.")

// =============================================================================
// INDICATORS
// =============================================================================

// ------------------------ Replacable section - Start -------------------------
// ---
// EMA
// ---
ema = ta.ema(close, emaLength)
plot(ema, "EMA Trend Line", color.white)

// ---
// RSI
// ---
rsi = ta.rsi(close, rsiLength)
// ------------------------- Replacable section - End --------------------------


// =============================================================================
// STRATEGY LOGIC
// =============================================================================

// ---------
// FUNCTIONS
// ---------

percentAsPoints(pcnt) =>
    math.round(pcnt / 100 * close / syminfo.mintick)

calcStopLossPrice(pointsOffset, isLong) =>
    priceOffset = pointsOffset * syminfo.mintick
    if isLong
        close - priceOffset
    else
        close + priceOffset

calcProfitTrgtPrice(pointsOffset, isLong) =>
    calcStopLossPrice(-pointsOffset, isLong)


printLabel(barIndex, msg) => label.new(barIndex, close, msg)

printTpSlHitBox(left, right, slHit, tpHit, entryPrice, slPrice, tpPrice) =>
    if showTpSlBoxes
        box.new (left = left,   top = entryPrice,   right = right,  bottom = slPrice,   bgcolor = slHit ? color.new(color.red, 60)   : color.new(color.gray, 90), border_width = 0)
        box.new (left = left,   top = entryPrice,   right = right,  bottom = tpPrice,   bgcolor = tpHit ? color.new(color.green, 60) : color.new(color.gray, 90), border_width = 0)
        line.new(x1 = left,     y1 = entryPrice,    x2 = right,     y2 = entryPrice,    color = color.new(color.yellow, 20))
        line.new(x1 = left,     y1 = slPrice,       x2 = right,     y2 = slPrice,       color = color.new(color.red, 20))
        line.new(x1 = left,     y1 = tpPrice,       x2 = right,     y2 = tpPrice,       color = color.new(color.green, 20))

printTpSlNotHitBox(left, right, entryPrice, slPrice, tpPrice) =>
    if showTpSlBoxes
        box.new (left = left,   top = entryPrice,   right = right,  bottom = slPrice,   bgcolor = color.new(color.gray, 90), border_width = 0)
        box.new (left = left,   top = entryPrice,   right = right,  bottom = tpPrice,   bgcolor = color.new(color.gray, 90), border_width = 0)
        line.new(x1 = left,     y1 = entryPrice,    x2 = right,     y2 = entryPrice,    color = color.new(color.yellow, 20))
        line.new(x1 = left,     y1 = slPrice,       x2 = right,     y2 = slPrice,       color = color.new(color.red, 20))
        line.new(x1 = left,     y1 = tpPrice,       x2 = right,     y2 = tpPrice,       color = color.new(color.green, 20))

printTradeExitLabel(x, y, posSize, entryPrice, pnl) =>
    if showLabels
        labelStr = "Position Size: " + str.tostring(math.abs(posSize), "#.##") + "\nPNL: " + str.tostring(pnl, "#.##") + "\nCapital: " + str.tostring(strategy.equity, "#.##") + "\nEntry Price: " + str.tostring(entryPrice, "#.##")
        label.new(x = x, y = y, text = labelStr, color = pnl > 0 ? color.new(color.green, 60) : color.new(color.red, 60), textcolor = color.white, style = label.style_label_down)

// ----------
// CONDITIONS
// ----------

inDateRange         = time >= timestamp(syminfo.timezone, startYear, startMonth, startDate, 0, 0) and time < timestamp(syminfo.timezone, endYear, endMonth, endDate, 0, 0)

// ------------------------ Replacable section - Start -------------------------
// Condition 1: Price above EMA indicates bullish trend, price below EMA indicates bearish trend
bullEma             = close > ema
bearEma             = close < ema

// Condition 2: RSI crossing back from overbought/oversold indicates pullback within trend
bullRsi             = ta.crossover  (rsi, rsiOversold)
bearRsi             = ta.crossunder (rsi, rsiOverbought)

// Combine all entry conditions
goLong              = inDateRange and bullEma and bullRsi
goShort             = inDateRange and bearEma and bearRsi
// ------------------------- Replacable section - End --------------------------

// Trade entry and exit variables
var tradeEntryBar   = bar_index
var profitPoints    = 0.
var lossPoints      = 0.
var slPrice         = 0.
var tpPrice         = 0.
var inLong          = false
var inShort         = false

// Entry decisions
openLong            = (goLong and not inLong)
openShort           = (goShort and not inShort)
flippingSides       = (goLong and inShort) or (goShort and inLong)
enteringTrade       = openLong or openShort
inTrade             = inLong or inShort

// ------------------------ Replacable section - Start -------------------------
// Exit calculations
atr                 = ta.atr(atrLength)
slAmount            = atr * slAtrMultiplier
slPercent           = math.abs((1 - (close - slAmount) / close) * 100)
tpPercent           = slPercent * riskReward
// ------------------------- Replacable section - End --------------------------

// Risk calculations
riskAmt             = strategy.equity * accountRiskPercent / 100
entryQty            = math.abs(riskAmt / slPercent * 100)  / close

if openLong
    if strategy.position_size < 0
        printTpSlNotHitBox(tradeEntryBar + 1, bar_index + 1, strategy.position_avg_price, slPrice, tpPrice)
        printTradeExitLabel(bar_index + 1, math.max(tpPrice, slPrice), strategy.position_size, strategy.position_avg_price, strategy.openprofit)
    strategy.entry("Long", strategy.long, qty = entryQty, alert_message = "Long Entry")
    enteringTrade   := true
    inLong          := true
    inShort         := false

if openShort
    if strategy.position_size > 0
        printTpSlNotHitBox(tradeEntryBar + 1, bar_index + 1, strategy.position_avg_price, slPrice, tpPrice)
        printTradeExitLabel(bar_index + 1, math.max(tpPrice, slPrice), strategy.position_size, strategy.position_avg_price, strategy.openprofit)
    strategy.entry("Short", strategy.short, qty = entryQty, alert_message = "Short Entry")
    enteringTrade   := true
    inShort         := true
    inLong          := false

if enteringTrade
    profitPoints    := percentAsPoints(tpPercent)
    lossPoints      := percentAsPoints(slPercent)
    slPrice         := calcStopLossPrice(lossPoints, openLong)
    tpPrice         := calcProfitTrgtPrice(profitPoints, openLong)
    tradeEntryBar   := bar_index

strategy.exit("TP/SL", profit = profitPoints, loss = lossPoints, comment_profit = "TP Hit", comment_loss = "SL Hit", alert_profit = "TP Hit Alert", alert_loss = "SL Hit Alert")

// =============================================================================
// DRAWINGS
// =============================================================================

// -----------
// TP/SL Boxes
// -----------

slHit           = (inShort and high >= slPrice) or (inLong  and low <= slPrice)
tpHit           = (inLong  and high >= tpPrice) or (inShort and low <= tpPrice)
exitTriggered   = slHit or tpHit
entryPrice      = strategy.closedtrades.entry_price (strategy.closedtrades - 1)
pnl             = strategy.closedtrades.profit      (strategy.closedtrades - 1)
posSize         = strategy.closedtrades.size        (strategy.closedtrades - 1)

// Print boxes for trades closed at profit or loss
if (inTrade and exitTriggered)
    inShort    := false
    inLong     := false
    printTpSlHitBox(tradeEntryBar + 1, bar_index, slHit, tpHit, entryPrice, slPrice, tpPrice)
    printTradeExitLabel(bar_index, math.max(tpPrice, slPrice), posSize, entryPrice, pnl)

// Print TP/SL box for current open trade
if barstate.islastconfirmedhistory and strategy.position_size != 0
    printTpSlNotHitBox(tradeEntryBar + 1, bar_index + 1, strategy.position_avg_price, slPrice, tpPrice)

// =============================================================================
// DEBUGGING
// =============================================================================

// Data window plots
plotchar(slPrice,    "Stop Loss Price",     "")
plotchar(tpPrice,    "Take Profit Price",   "")

// Label plots
plotDebugLabels = false
if plotDebugLabels
    if bar_index == tradeEntryBar
        printLabel(bar_index, "Position size: " + str.tostring(entryQty * close, "#.##"))