SMAとATRに基づくトレンドフォロー戦略
1. 戦略の名称
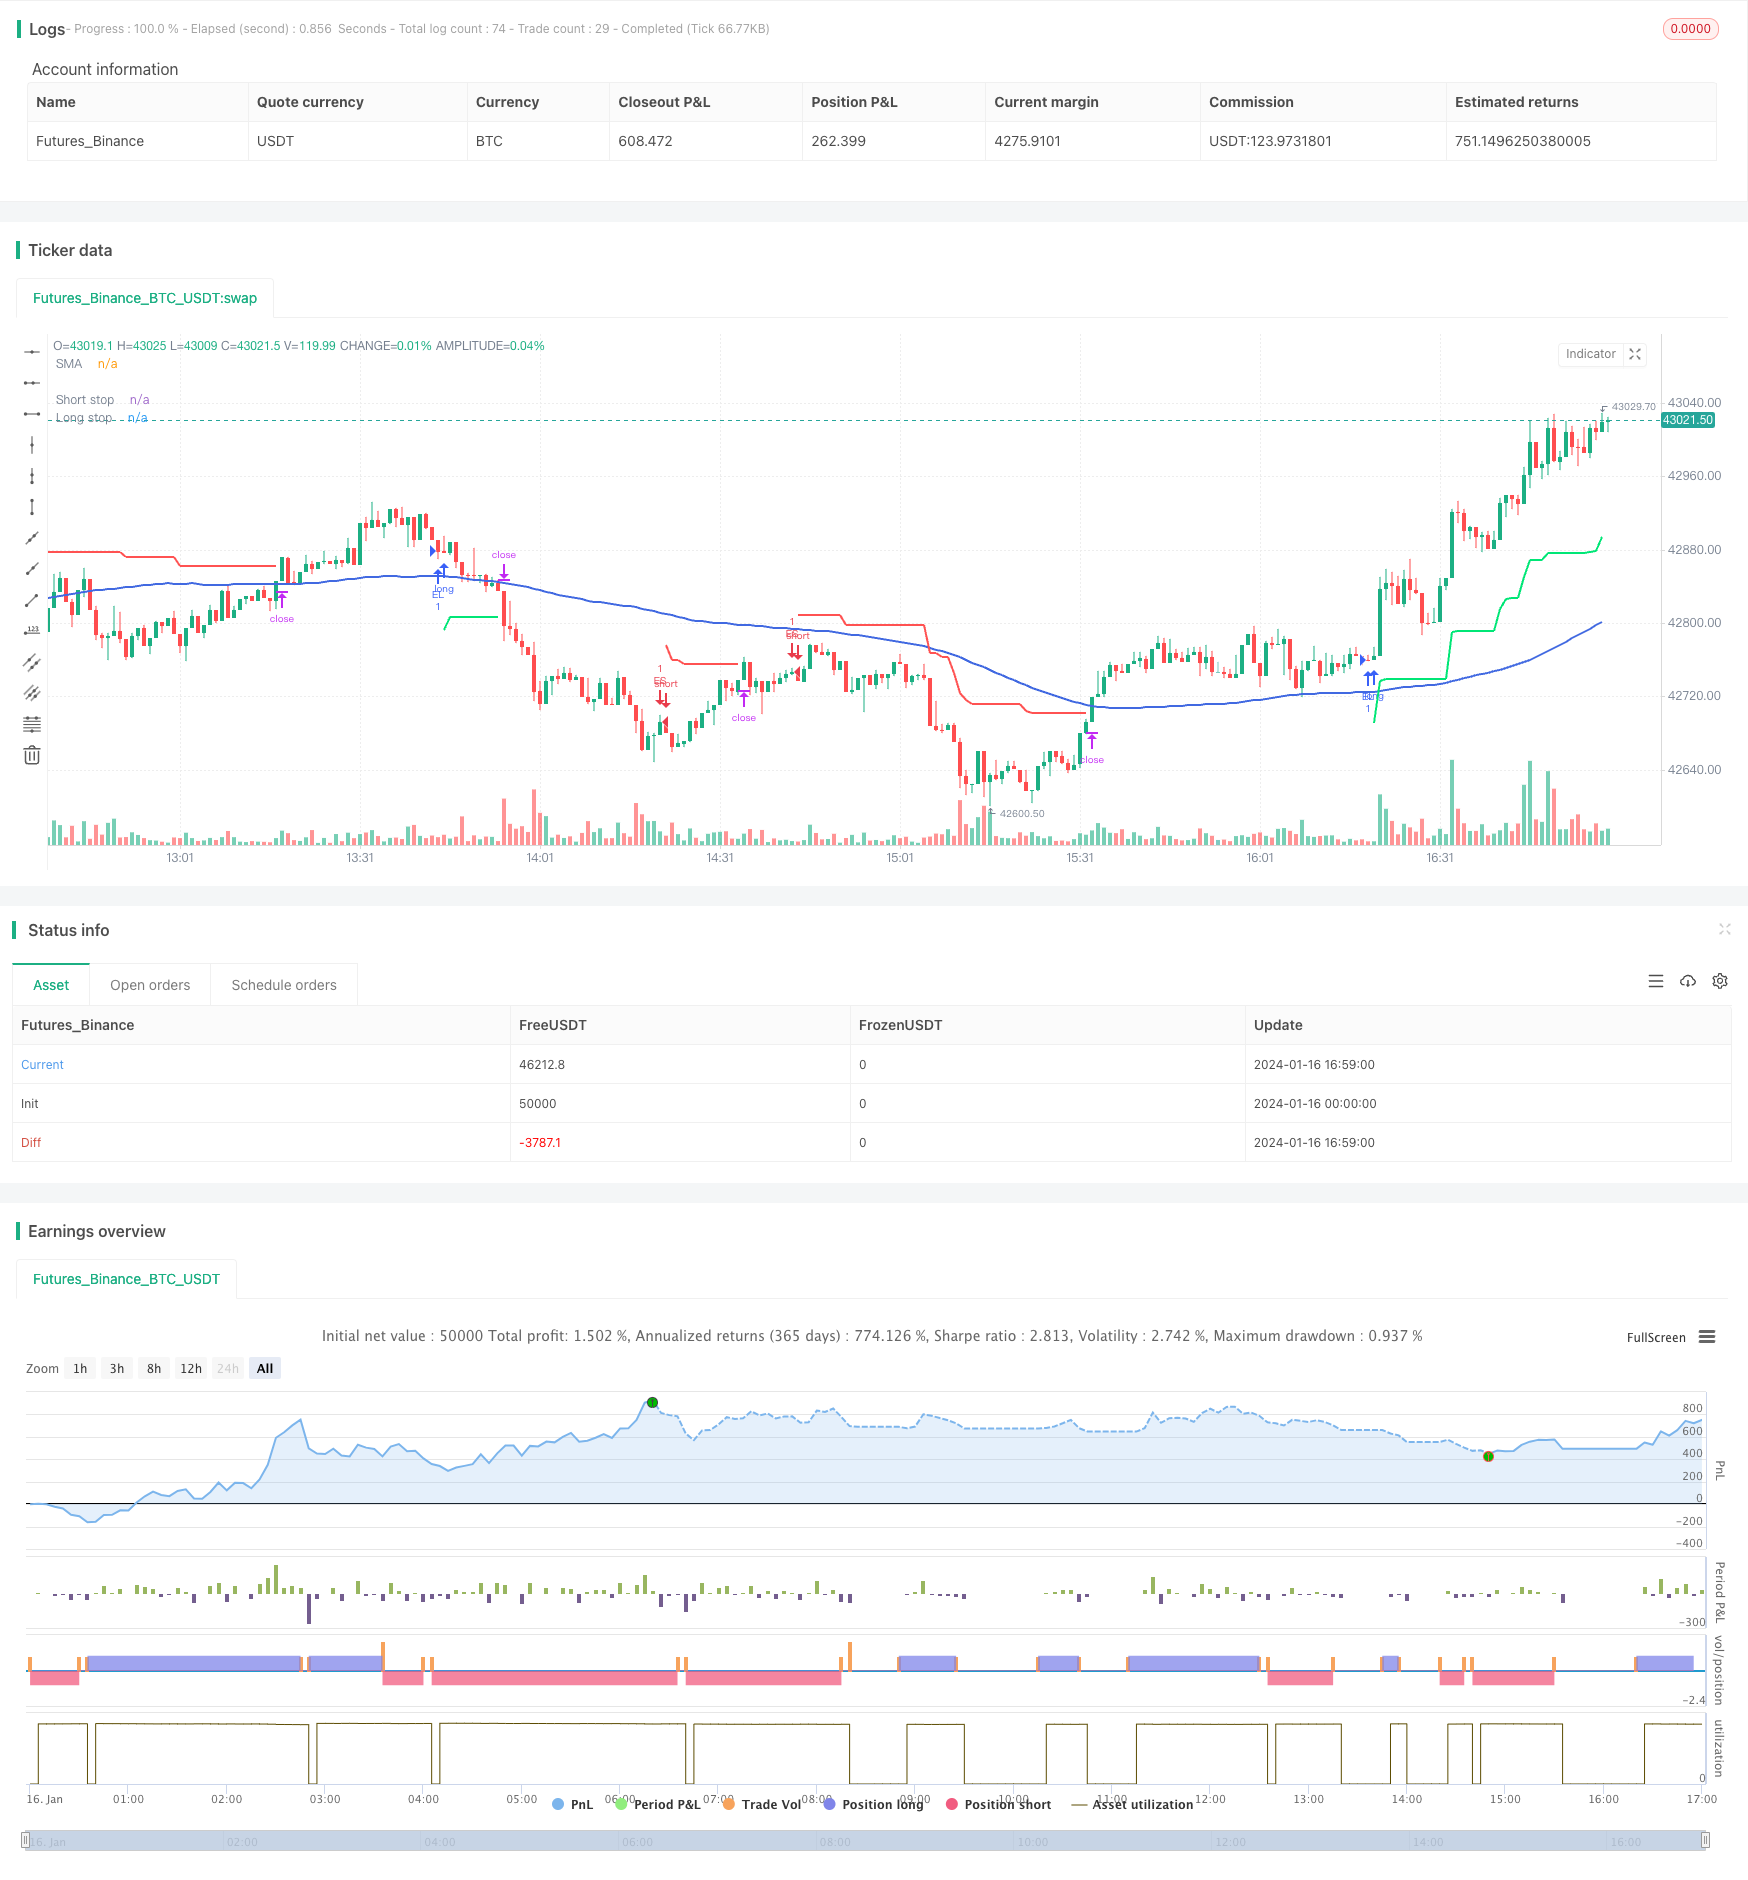
戦略の名前はSMAとATRに基づくトレンドフォロー戦略。
2 戦略概要
この戦略は,価格トレンドの方向を判断するためにSMA指数を使用し,ATR指数を使用してストップロスを設定してトレンドを追跡します.価格が上昇トレンドを破るときは空白し,価格が下降トレンドを破るときは多めにして,トレンド取引を実現します.
3つ目 戦略の原則
1. 入力信号
(1) 値上がりでSMAより上位に収束する (2) 値が下がり,SMAより下がったときに空白する
2. 止損設定
ATR指標の値を設定した止損倍数で乗算して止損位置とする.
3. 更新停止
K線が閉じるたびに,ストップ・ポジションをチェックし,現在の価格に近いストップ・値に更新する.
4. 退出信号
価格がストップラインに触れた後,積極的にストップアウトする.
4 戦略的優位性
1. トレンド追跡能力
ATR指標の動的ストップレスの設定は,トレンドの自動追跡を可能にします.
2. 撤回コントロールが良い
厳格なストップ・ロスの規則は,単一取引の最大撤退を制御するのに役立ちます.
3. パラメータ設定が簡単
簡単な調整と最適化のために,たった3つのパラメータしかありません.
5 戦略的リスク
1. ストップダメージが過度に緩やかになる可能性
止損倍数設定が大きすぎると,止損位置が過度に緩やかになり,引き戻しが増加する可能性があります.
2. 偽突破によるリスク
価格の偽突破が発生すると,トレンドの方向を間違える可能性があります.他の指標と組み合わせてフィルターシグナルを使用する必要があります.
3. パラメータ最適化リスク
過剰に依存するパラメータ最適化は曲線最適化につながる可能性がある.パラメータの安定性を慎重に評価すべきである.
6 戦略の最適化方向
1. ストップ・ローズ・アルゴリズムの最適化
移動止損,比率止損などの他の種類の止損アルゴリズムをテストできます.
2. フィルター信号を増やす
偽突破をフィルタリングする他の指標を追加できます.例えば,取引量条件の増加など.
3. パラメータの安定性を評価
歴史的追溯によって,異なる品種と周期に対するパラメータの適応性を評価する.
VII. 結論
この戦略の全体的な考え方は明確で,SMAによってトレンド方向を判断し,ATRを使用してトレンド追跡し,逆戻り制御能力は良好で,中長線トレンド取引に適しています.しかし,現場でパラメータを適切に調整し,過度に最適化のリスクを防ぎます.
/*backtest
start: 2024-01-16 00:00:00
end: 2024-01-16 17:00:00
period: 1m
basePeriod: 1m
exchanges: [{"eid":"Futures_Binance","currency":"BTC_USDT"}]
*/

// This Pine Script™ code is subject to the terms of the Mozilla Public License 2.0 at https://mozilla.org/MPL/2.0/
// © omererkan

//@version=5
strategy(title="SMA with ATR", overlay=true)

smaLen = input.int(100, title="SMA Length")

atrLen     = input.int(10, title="ATR Length")
stopOffset = input.float(4, title="Stop Offset Multiple", step=0.25)


smaValue  = ta.sma(close, smaLen)
stopValue = ta.atr(atrLen) * stopOffset


lowerCloses = close < close[1] and
     close[1] < close[2] and
     close[2] < close[3]

enterLong = close > smaValue and
     lowerCloses


longStop = 0.0
longStop := if enterLong and strategy.position_size < 1
    close - stopValue
else
    math.max(close - stopValue, longStop[1])


higherCloses = close > close[1] and
     close[1] > close[2] and
     close[2] > close[3]

enterShort = close < smaValue and
     higherCloses


shortStop = 0.0
shortStop := if enterShort and strategy.position_size > -1
    close + stopValue
else
    math.min(close + stopValue, shortStop[1])


plot(smaValue, color=#4169e1, linewidth=2, title="SMA")

plot(strategy.position_size > 0 ? longStop : na, color=color.lime,
     style=plot.style_linebr, title="Long stop", linewidth=2)

plot(strategy.position_size < 0 ? shortStop : na, color=color.red,
     style=plot.style_linebr, title="Short stop", linewidth=2)


if enterLong
    strategy.entry("EL", strategy.long)

if enterShort
    strategy.entry("ES", strategy.short)


if strategy.position_size > 0
    strategy.exit("SL Long", from_entry="EL", stop=longStop)

if strategy.position_size < 0
    strategy.exit("SL Short", from_entry="ES", stop=shortStop)


if enterLong
    strategy.cancel("Exit Short")

if enterShort
    strategy.cancel("Exit Long")