RSIインジケーターと平滑移動平均反転戦略の計算
作成日:
2024-01-19 14:24:09
最終変更日:
2024-01-19 14:24:09
コピー:
3
クリック数:
872
1
フォロー
1750
フォロワー
概要
RSI反転策は,RSI指数と滑動平均を計算して,株式が過買または過売状態にあるかどうかを判断して,買入と売却のシグナルを生成する.この策は,RSI指数の反転特性を利用して,株式価格が反転するときに利益を得る.
戦略原則
この戦略は,まず14周期のRSI値を計算し,0-100の正規化処理を行います. 次に,5周期のRSIの加重移動平均を計算し,それを反正切数関数で-1から1の間の値にマッピングします. マッピングされたRSIが上を0.8を突破すると買い信号を生じ,下を1を突破すると売り信号を生じます. ここで,マッピングと値判断の方法により,RSI指標の反転信号を検出します.
このポリシーは,指定された月と日付のみで動作するように,動作する月と日付の範囲を設定します.
利点
- RSI指標の反転特性を利用し,株価の反転ポイントで取引シグナルを生成し,反転の機会を捉えます.
- RSIをマッピングし,値下げを判断し,信号をより明確にする.
- 稼働する月と日付を設定し,柔軟に使用できます.
リスク
- RSI反転シグナルには誤報が発生し,取引シグナルに誤報を起こす可能性があります. RSIパラメータを調整したり,他の指標のフィルターを追加することによって誤報を減らすことができます.
- RSIの単一の指標にのみ依存し,他の指標または因子構築機構を導入して,戦略の安定性を向上させることができます.
- 固定された月と日付の範囲は,他の時間帯の取引機会を逃す可能性があり,より柔軟な稼働時間を設定できます.
最適化の方向
- RSIと移動平均の周期に最適なマッチを見つけるために,より多くの組み合わせのパラメータをテストします.
- 逆転信号を確認するために取引量や変動率などの指標を増やして誤報を減らす.
- 取引機会を拡大するために,月や日付の範囲を最適化して調整する.
- リスク管理のための止損メカニズムの追加
要約する
RSI反転戦略は,RSI指標の反転取引ルールを構築することによって,価格反転の機会を簡単に効果的に捕捉します.この戦略は,実行しやすいですが,パラメータの最適化,リスク管理機構の強化などによって最適化され,安定した収益性の定量化取引戦略にすることができます.
ストラテジーソースコード
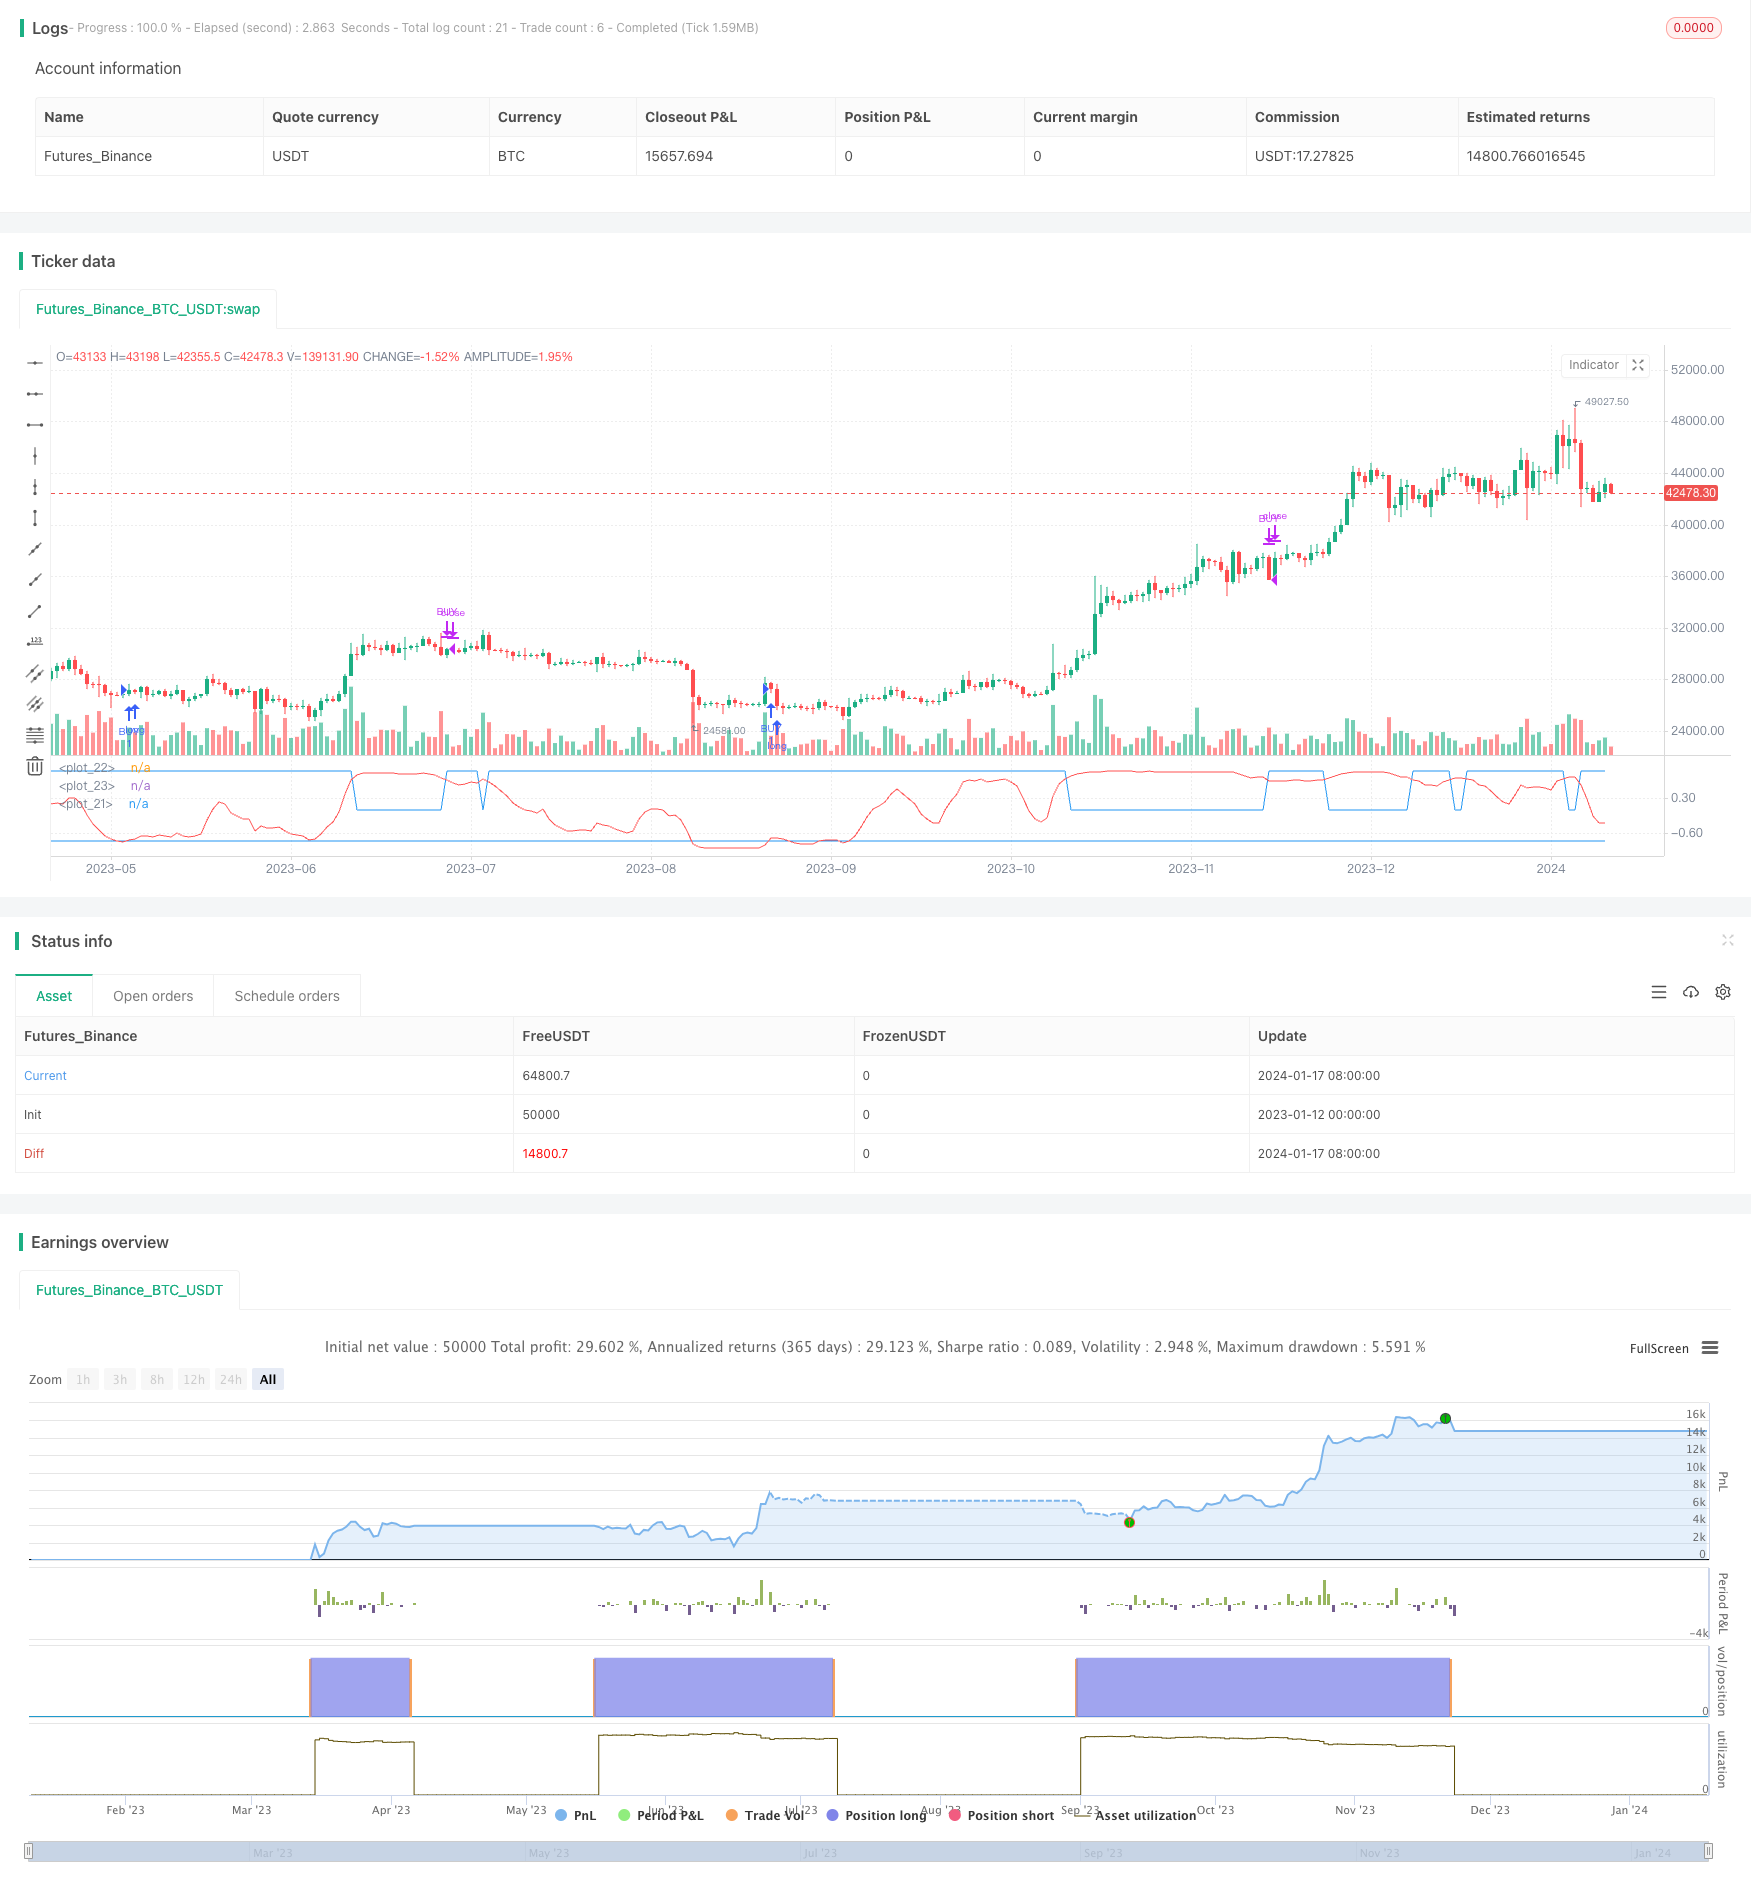
/*backtest
start: 2023-01-12 00:00:00
end: 2024-01-18 00:00:00
period: 1d
basePeriod: 1h
exchanges: [{"eid":"Futures_Binance","currency":"BTC_USDT"}]
*/

//@version=3
strategy(title="RSI Reverse", shorttitle="RSI Reverse")


RSI_main = input(14, title="RSI Main Period")
RSI_smooth = input(5, title="RSI Smooth Period")

//Functions
RVS(input) => (exp(2*input)-1) / (exp(2*input)+1)

//RSI Calculation
raw_RSI=0.1*(rsi(close,RSI_main)-50)
wma_RSI=wma(raw_RSI,RSI_smooth)
RVS_RSI = RVS(wma_RSI)


threshold1 = RVS_RSI < 0.8? 1 : 0
threshold2 = -0.8


plot(RVS_RSI,color=red)
plot(threshold1,color=blue)
plot(threshold2,color=blue)

buycon = crossover(RVS_RSI,threshold2)
sellcon = crossunder(RVS_RSI , threshold1)

monthfrom =input(6)
monthuntil =input(12)
dayfrom=input(1)
dayuntil=input(31)


if (  buycon  )
    strategy.entry("BUY", strategy.long, stop=close, oca_name="TREND", comment="BUY")

else
    strategy.cancel(id="BUY")


if ( sellcon)

    strategy.close("BUY")