# カモメ指標に基づく暗号通貨トレンド追跡戦略

概要
本戦略は、カモメ指標に基づく暗号通貨のトレンドフォロー戦略です。異なる期間の指数平滑移動平均(EMA)とカモメ指標を組み合わせ、複数の条件を用いて取引シグナルを生成します。本戦略は中長期的な価格トレンドを識別し、トレンドが転換した時点で適切にエントリーすることを目的としています。
戦略の原理
本戦略では、50期間と100期間のEMAを使用します。同時に、市場ノイズをフィルタリングする特別なローソク足であるカモメ線を計算します。戦略では、カモメ線の始値、終値、高値、安値を100期間のEMAに適用することで、より正確な取引シグナルを生成します。
具体的には、100期間のカモメ線の始値が終値よりも高く、かつ前のローソク足の始値が終値よりも低い場合、買いシグナルとなります。逆に、100期間のカモメ線の始値が終値よりも低く、かつ前のローソク足の始値が終値よりも高い場合、売りシグナルとなります。
本戦略はデュアルEMAシステムとカモメ指標を組み合わせることで、中長期的なトレンドが形成された時点で素早く機会を捉えることを目的としています。カモメ指標を使用して短期的な市場ノイズを取り除くことで、取引シグナルの信頼性を高めています。
戦略の利点
- カモメ指標を使用することでノイズを効果的に除去し、取引シグナルをより明確で信頼性のあるものにします。
- マルチ期間EMAとカモメ指標の組み合わせにより、強い中長期的なトレンドを識別できます。
- 複数の条件判断により、好機を逃すリスクを低減します。
- 特にボラティリティの高い暗号通貨市場に適しています。
- 買い専用戦略として設定可能で、運用リスクを低減できます。
戦略のリスク
- ストップロスが過度に緩やかに設定される場合、損失リスクが大きくなる可能性があります。
- レンジ相場では、多くの無効な取引が発生する可能性があります。
- カモメ指標には依然としてある程度の価格遅延があり、リスクを完全に回避することはできません。
- トレンド反転ポイントを判断できず、損失が拡大するリスクがあります。
リスクを低減するには、ストップロスの幅を適切に狭めたり、他の指標を組み合わせてトレンド反転を判断することを検討してください。市場がレンジ相場に入った場合、本戦略を一時停止し、新たなトレンドの発生を待つことも選択肢です。
戦略の最適化方向性
本戦略は以下の方向で最適化が可能です。
- EMAのパラメータを最適化し、最適なパラメータ組み合わせを見つける。
- カモメ指標の代わりにKDJやMACDなどの他の指標を試す。
- 価格のブレイクアウトをエントリーの確認条件として追加する。
- ボラティリティ指標を組み合わせてトレンド反転を判断する。
- 機械学習手法を用いてパラメータを動的に最適化する。
まとめ
カモメ指標に基づく暗号通貨トレンドフォロー戦略は、トレンド判断、エントリータイミング、ストップロス管理の複数の側面を総合的に考慮しており、ボラティリティの高い暗号通貨という資産クラスに優れた適応性を示します。本戦略はカモメ指標を用いてノイズをフィルタリングし、堅実なリスク管理手法を採用することで、中長期的な価格トレンドがもたらす取引機会を効果的に捉えることができます。さらにパラメータ設定、指標選択、リスク管理方法を最適化することで、本戦略のパフォーマンスには大きな向上の余地があります。
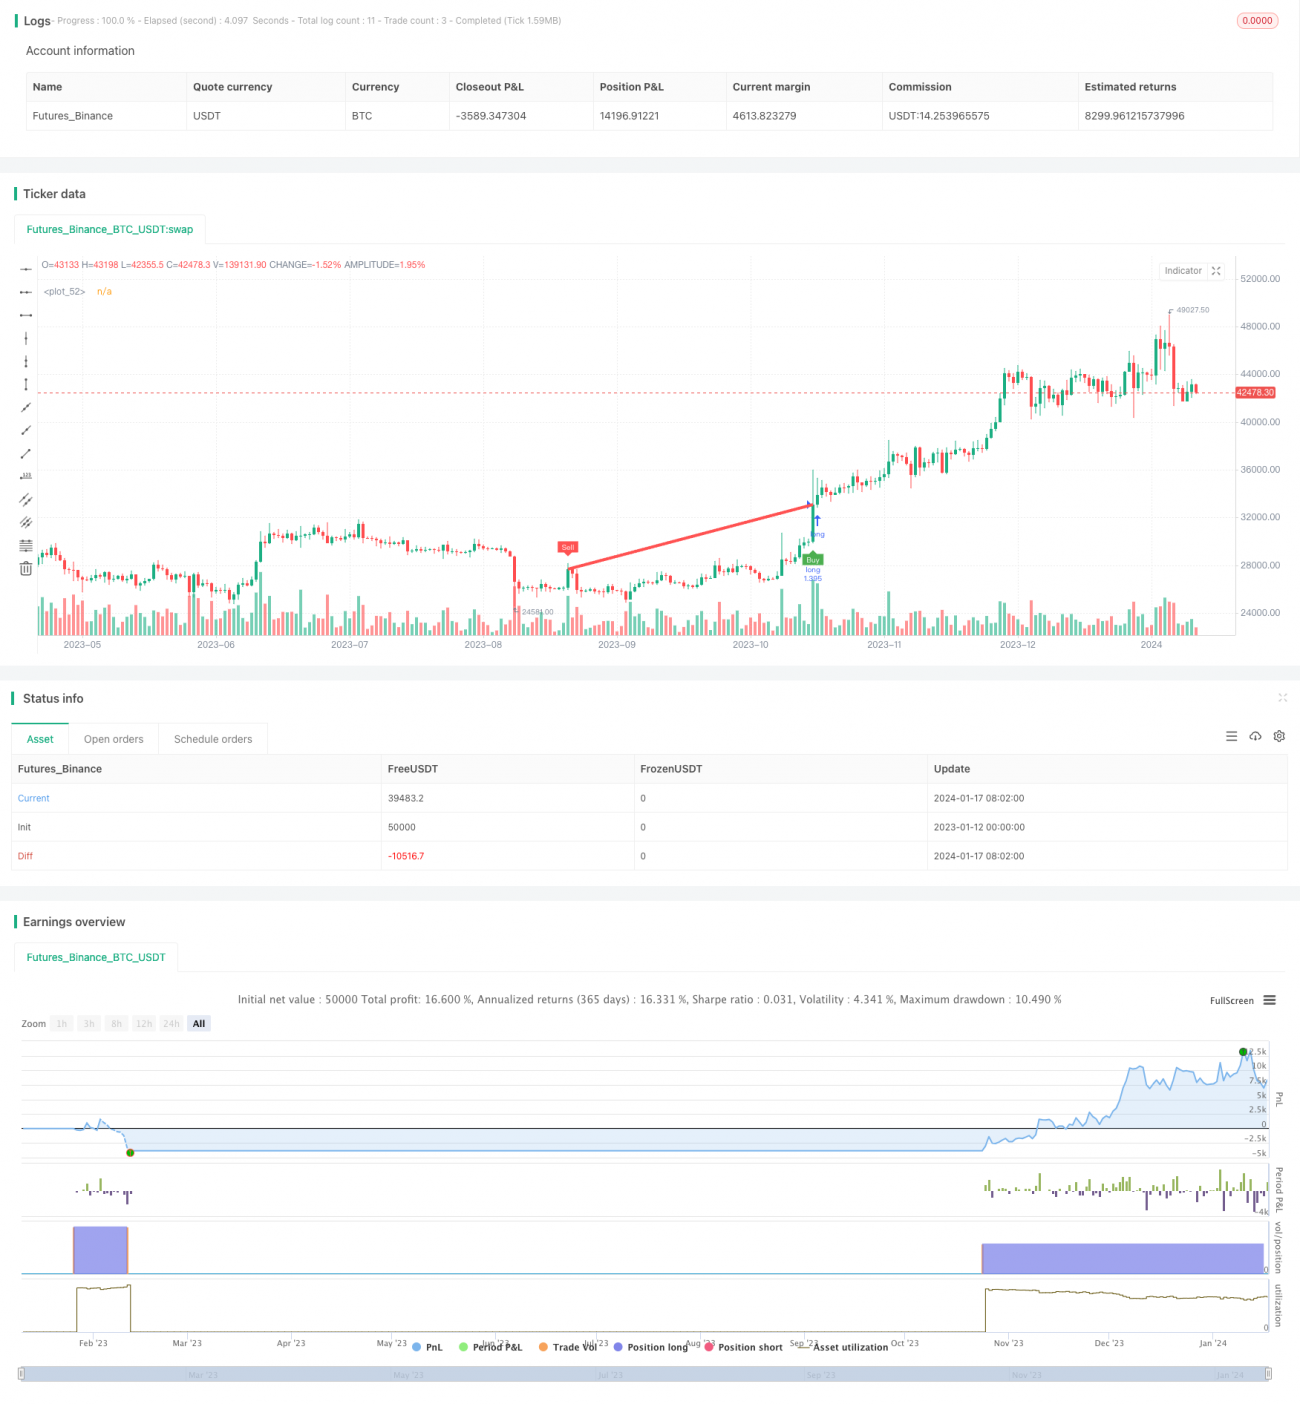
/*backtest
start: 2023-01-12 00:00:00
end: 2024-01-18 00:00:00
period: 1d
basePeriod: 1h
exchanges: [{"eid":"Futures_Binance","currency":"BTC_USDT"}]
*/

//@version=4
//@SoftKill21
strategy(title="CRYPTO HA Strategy", shorttitle="CRYPTO HA Strategy", overlay=true , default_qty_type =strategy.percent_of_equity, default_qty_value =100, commission_type= strategy.commission.percent,commission_value =0.1 )
- 1