RSI指標に基づく短期取引戦略
作成日:
2024-01-22 09:59:42
最終変更日:
2024-01-22 09:59:42
コピー:
9
クリック数:
1031
1
フォロー
1751
フォロワー
概要
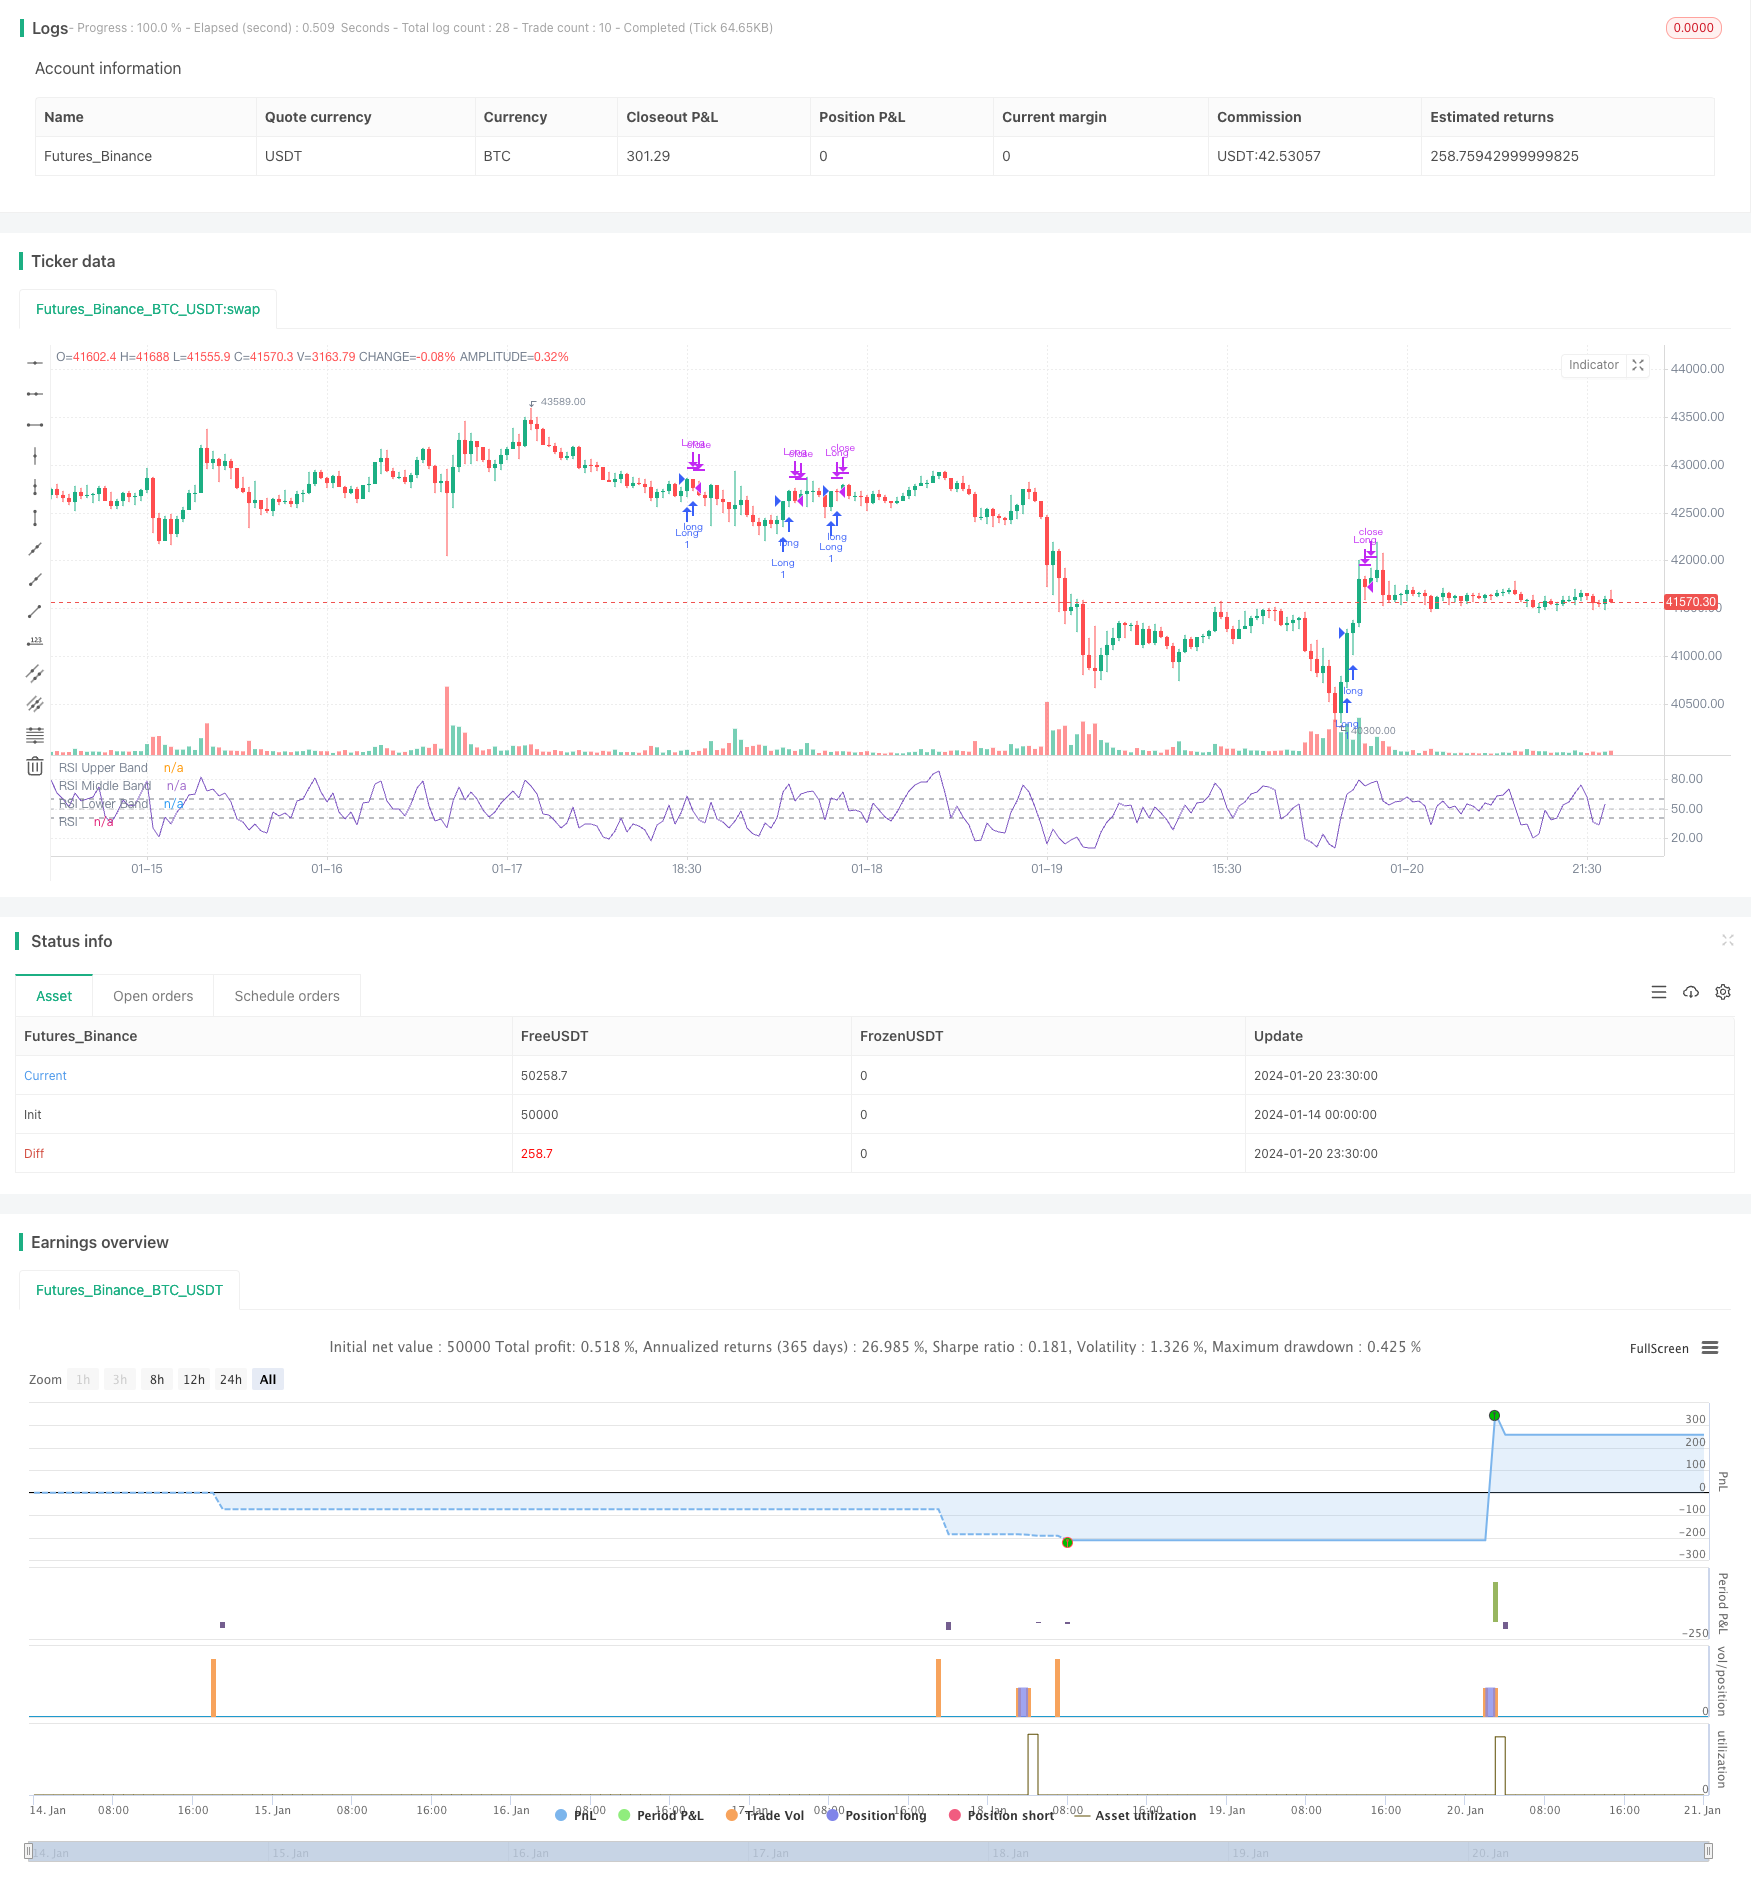
この戦略は,RSI ((相対的に強い指標) に基づくショートライン取引戦略である. RSI指標を使用して,市場の潜在的に強い弱い状態を識別し,取引決定を補助する.
この戦略は5周期のRSI指標を使用して,ショートラインの価格動力を捉えます. RSI曲線の高点と低点に基づいて,入場と停止のタイミングを判断します.
戦略原則
マルチヘッドポジションへの入場条件は,前KラインのRSI値が50未満であり,現在のKラインのRSI値が60以上である.
平準ポジション条件は,RSI曲線より低い低点が発生すると,トレンドが弱くなったことを示す,この時点で多頭ポジションを平準化する.
優位分析
- RSI指標を使用すると,市場の価格の逆転点を効果的に識別できます. RSIの高低の組み合わせの曲線は,強力な指示作用を持っています.
- 5周期RSIは,ショートライン価格の急速な変化を捉えることができ,ショートライン取引に適しています.
- 戦略的意思決定のルールは明確でシンプルで,実行しやすい.
リスク分析
- RSIは誤信号を誘発し,ストップダウンの原因となる.
- ショートライン操作は取引頻度やスライドポイントコストを増加させる可能性があります.
- 実際の取引では,RSI周期数,高低点値などのパラメータを合理的に調整する必要があります.
改善方法:
- 他の指標のフィルタリング信号と組み合わせて,誤差率を下げます.例えばMACD,KDなど.
- ストップラインを適切に緩め,過度に敏感な状態を避ける.
- RSIパラメータを調整し,最適なパラメータの組み合わせを探します.
要約する
この戦略は,RSI指標の高低点反転特性を利用し,明確な多頭入場と停止ルールを設定しています. シンプルで実用的な取引考え方ですが,一定の不安定性もあります. 戦略の安定性を向上させるには,パラメータの最適化と指標の組み合わせを使用できます.
ストラテジーソースコード
/*backtest
start: 2024-01-14 00:00:00
end: 2024-01-21 00:00:00
period: 30m
basePeriod: 15m
exchanges: [{"eid":"Futures_Binance","currency":"BTC_USDT"}]
*/

//@version=5
strategy("*RSI 5 - Long only- Daily charts & above*", overlay = false)

// Define inputs
rsi_length = input(5, "RSI Length")

// Calculate indicators
rsi = ta.rsi(close, rsi_length)

// Entry conditions
long = rsi[1] < 50 and rsi > 60

// Exit conditions
longExit = rsi < rsi[1]


// Execute trade with adjusted position size
if (long)
    strategy.entry("Long", strategy.long)


if  (longExit)
	strategy.close("LongExit")


// Close long position if long exit condition is met
if (longExit)
    strategy.close("Long", comment="Long exit")

rsiPlot = plot(rsi, "RSI", color=#7E57C2)
rsiUpperBand = hline(60, "RSI Upper Band", color=#787B86)
midline = hline(50, "RSI Middle Band", color=color.new(#787B86, 50))
rsiLowerBand = hline(40, "RSI Lower Band", color=#787B86)
fill(rsiUpperBand, rsiLowerBand, color=color.rgb(126, 87, 194, 90), title="RSI Background Fill")