週次トレンドに影響を与える取引戦略
作成日:
2024-01-22 10:56:49
最終変更日:
2024-01-22 10:56:49
コピー:
2
クリック数:
575
1
フォロー
1750
フォロワー
概要
この戦略は,市場内の潜在的な取引機会を識別するために,双指数移動平均の交差と比較的強い指標の組み合わせを使用しています.これは,価格の動きと変動を大きく追跡するトレーダーに適しています.
戦略原則
基本的な考えは,速い9週間の指数移動平均が,より遅い21週間の指数移動平均を突破するときに,市場傾向が強くなっている可能性を示しているので,買いなさいということです. そして,RSIが50より大きい場合は,買い信号を確認してください.
具体的には,9週間のEMAで21週間のEMAを穿い,14週間のRSIが50より大きいとき,買入シグナルを発する.その後,2%の口座リスクで開設し,5%のストップ,10%のストップを使用する.また,3%の追跡ストップで利益をロックする.
売出シグナルは逆の論理に基づいています. 9週間のEMAが21週間のEMAを下落させ,RSIが50を下回ると,短期的なトレンドが下落に転向したことを示します.
戦略的優位性
- 双重技術指標を用いて潜在的機会を特定し,信号の質を向上させる
- RSIはトレンドを確認し,偽のブレイクをフィルターするのに役立ちます.
- 価格の大きな変動を追跡するのに適しています
- リスクマネジメントは,ストップとストップを設定します.
- ストップ・ロスを追跡することで,利益の保護を最適化できます.
戦略リスク
- 急速な平均線交差は取引の騒音を増やす可能性があります.
- RSIが誤った信号を発している可能性
- 利回りは2:1に制限されています.
- 取引コストを考慮していない
- 移動平均周期長さ,RSIパラメータなどの多くのパラメータを最適化する必要があります.
これらのパラメータの組み合わせを体系的にテストすることで最適化することができる。また,条件論理にフィルターを追加してノイズ取引を減らすことができる。基本的な要素を考慮すると,より多くの確認が得られる。
最適化の方向
- EMA周期パラメータをテストし,最適な組み合わせを探します.
- RSIパラメータを最適化して誤信号を減らす
- ボリンジャー・バンド幅などの追加確認指標
- 基本的分析と組み合わせた信号の質の向上
- 策略は,日内取引などの時間帯に拡張できます.
要約する
この戦略は,EMAとRSIの力を利用して,中長期のトレンドにおける潜在的な機会を識別する.それは,取引ごとにリスクを効果的に制御する明確なリスク管理のルールを提供する.さらにテストし,パラメータを最適化することによって,戦略のパフォーマンスを向上させ続けることができる.それは,市場における大きな周期的な変動を追跡する効果的な方法を提供します.
ストラテジーソースコード
/*backtest
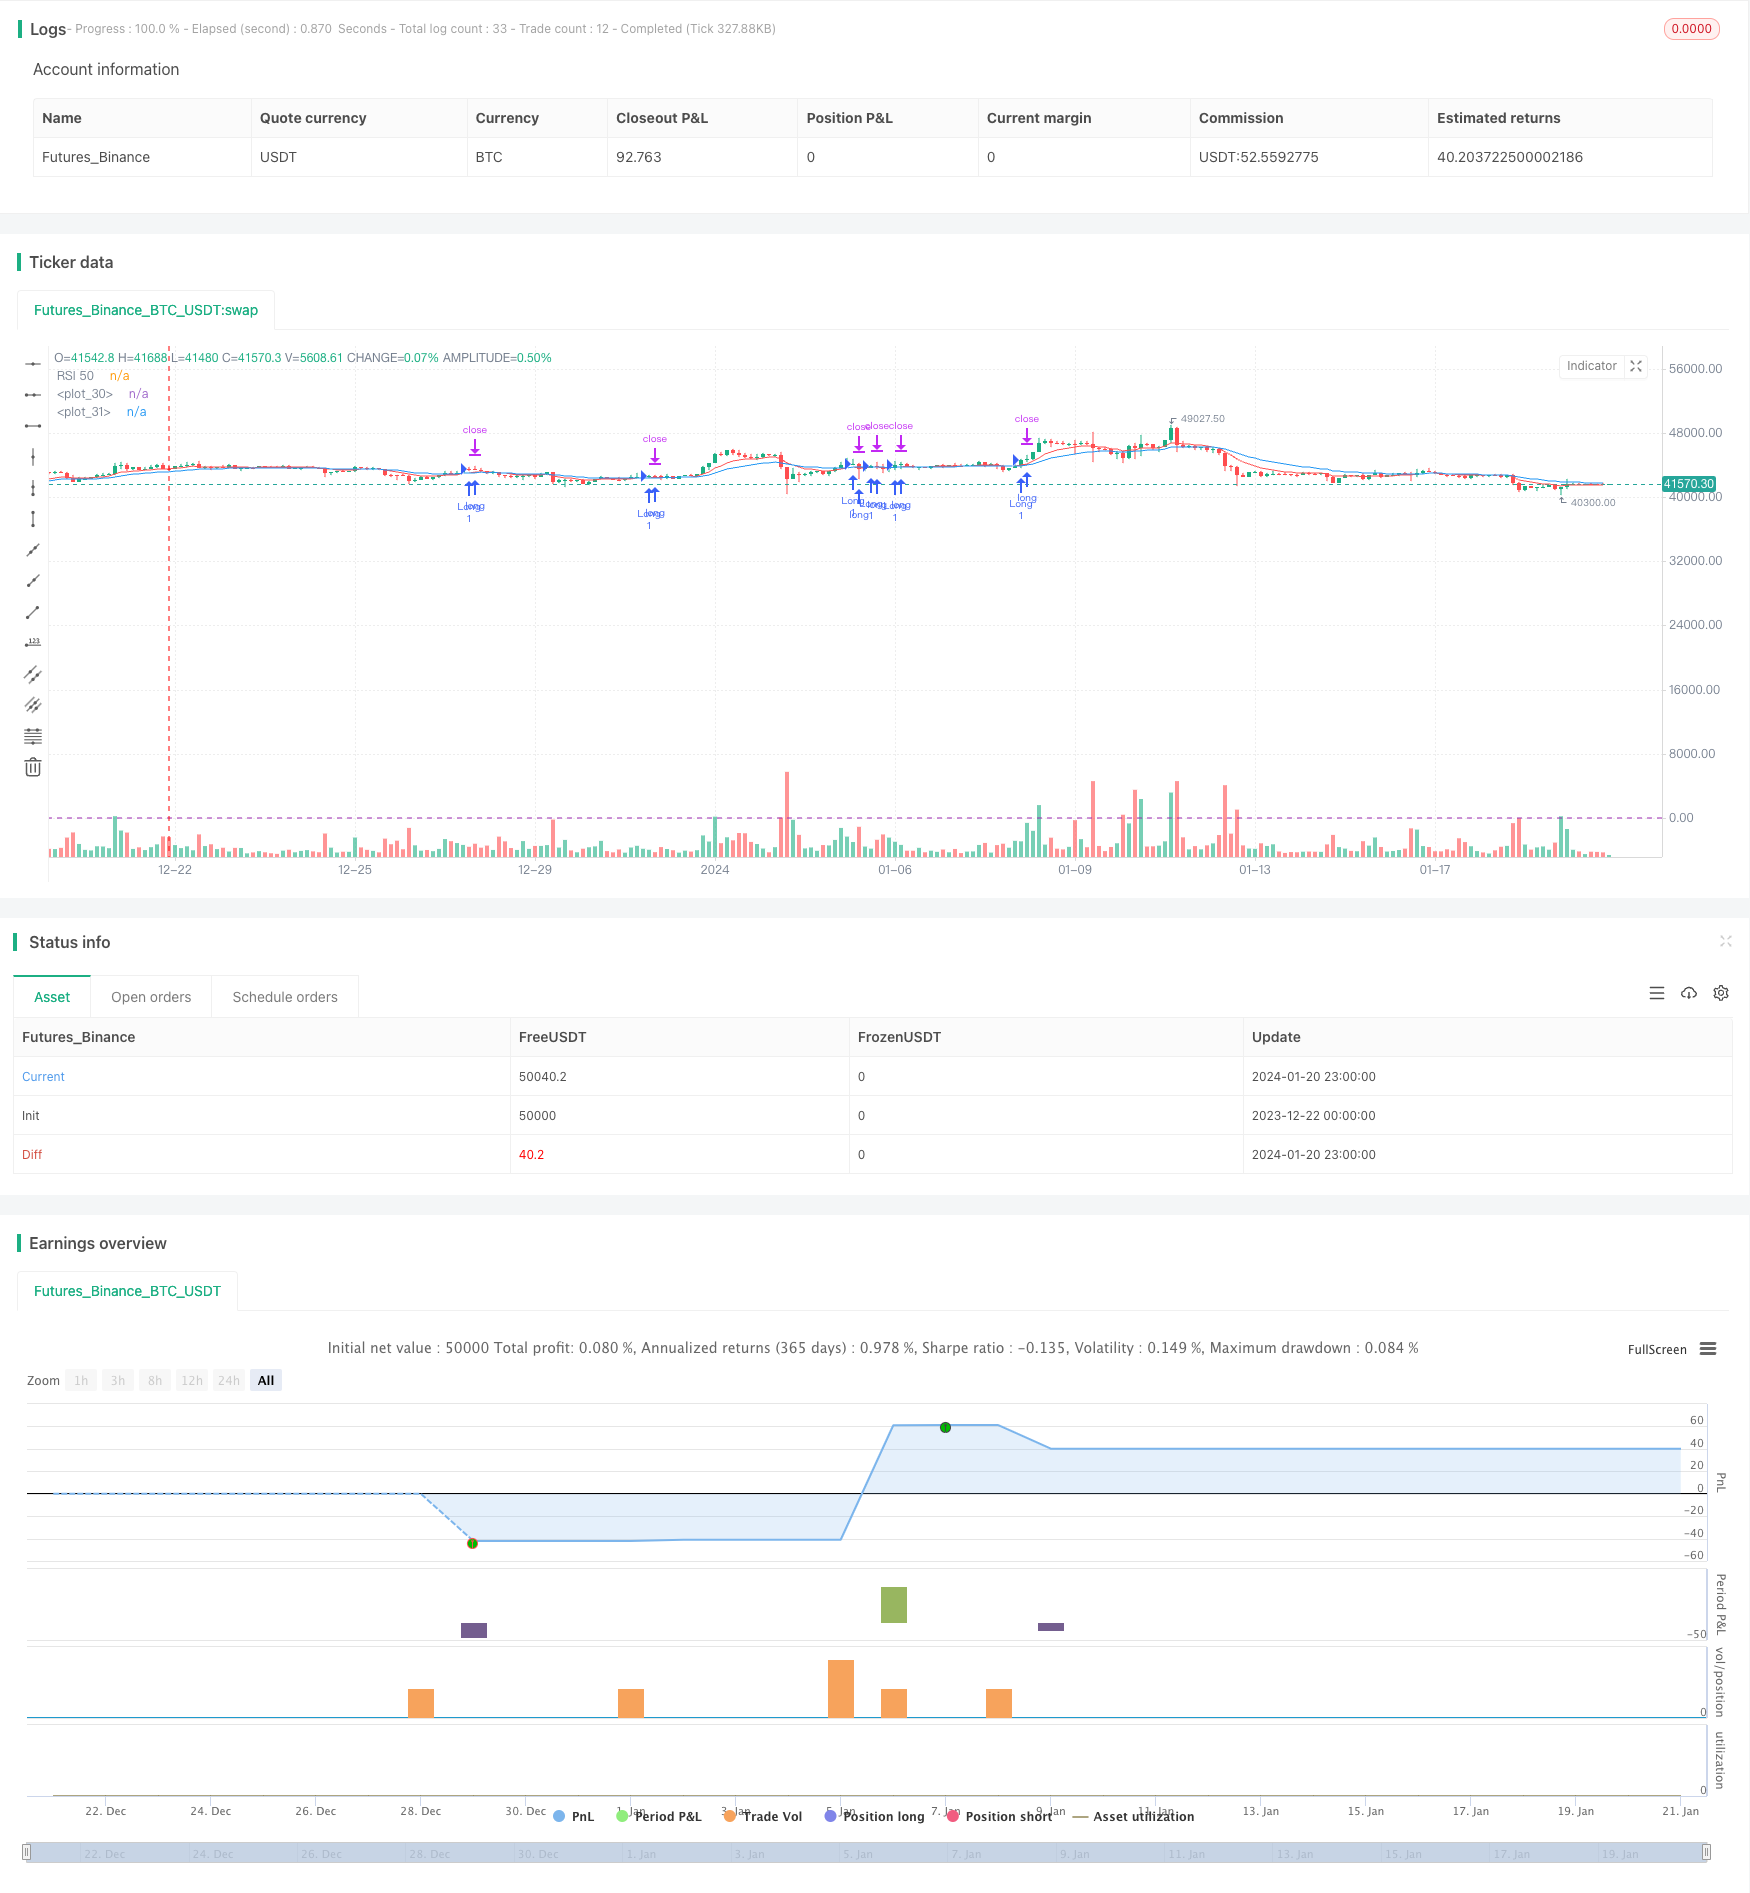
start: 2023-12-22 00:00:00
end: 2024-01-21 00:00:00
period: 3h
basePeriod: 15m
exchanges: [{"eid":"Futures_Binance","currency":"BTC_USDT"}]
*/
//@version=4
strategy("Weekly Swing Trading Strategy", overlay=true)
// Entry Indicators
shortEma = ema(close, 9)
longEma = ema(close, 21)
rsiValue = rsi(close, 14)
// Entry Condition
longCondition = crossover(shortEma, longEma) and rsiValue > 50
if (longCondition)
strategy.entry("Long", strategy.long)
// Position Sizing (2% risk per trade)
riskPerTrade = 0.02
stopLossPercent = 0.05 // 5% stop loss
stopLossPrice = close * (1 - stopLossPercent)
strategy.exit("Stop Loss", "Long", stop=stopLossPrice)
// Profit Target and Trailing Stop
profitTargetPercent = 0.10 // 10% profit target
profitTargetPrice = close * (1 + profitTargetPercent)
trailStopPercent = 0.03 // 3% trailing stop
strategy.exit("Take Profit", "Long", limit=profitTargetPrice, trail_price=trailStopPercent, trail_offset=trailStopPercent)
// Exit Strategy
exitCondition = crossunder(shortEma, longEma) or rsiValue < 50 // Exit when EMAs cross or RSI drops below 50
strategy.close("Long", when=exitCondition)
plot(shortEma, color=color.red)
plot(longEma, color=color.blue)
hline(50, "RSI 50", color=color.purple)