RSIと移動平均に基づくマルチタイムフレーム取引戦略
概要
この戦略は,ランダムな指標であるRSI,移動平均SMA,および加重移動平均WMAを組み合わせて,買入/売却のシグナルを探している.これは,5分と1時間のタイムフレームで同時にトレンドの方向を判断している.安定したトレンドでは,速線RSIが遅線を横切るときまたは横切るとき,取引シグナルが生成される.
戦略原則
この戦略は,最初に1時間5分間の2つの時間枠で144周期重引移動平均WMAと5周期簡易移動平均SMAを計算する. 5分間のSMAがWMAの上にあるときのみ,多頭市場とみなされる. その後,戦略は,RSIの多空指標,および対応するK線とD線を計算する.K線が超買区の下からD線を通過すると,売り信号が生じ,K線が超買区上からD線を通過すると,買い信号が生じます.
優位分析
これは非常に効果的なトレンド追跡戦略である. それは同時に2つの時間枠の判断トレンドを組み合わせて,誤った信号を非常に効果的に減らす. さらに,それはRSI,SMA,WMAを含む複数の指標を組み合わせて,信号をより信頼性のあるものにします. RSIがKDJを駆動させることで,それは通常のKDJ戦略で容易に発生する偽信号の問題を修正します.
リスク分析
この策略の最大のリスクは,トレンド判断の誤りである.市場の転換点では,短期平均と長期平均が同時に上下する可能性があるため,誤ったシグナルを生成する.さらに,振動的な市場では,RSIは,より多くの不透明な取引シグナルを生成する可能性がある.しかし,これらのリスクは,SMAとWMAの周期とRSIパラメータを適切に調整することで軽減することができます.
最適化の方向
この戦略は以下の点で最適化できます. 1) 異なる長さのSMA,WMA,RSIをテストし,最適なパラメータの組み合わせを見つける 2) 信号信頼性を検証するために MACD,ブリンラインなどの他の指標判断を追加する 3) ストップ・ストップ戦略を最適化し,固定比率ストップ,余剰滑点ストップ,ストップ・トラッキングなどの方法をテストする 4) 資金管理モジュールへの加入,単一の投資規模と全体的なリスクの口を制御する 5) 機械学習のアルゴリズムを拡張し,大量の反省で最高のパフォーマンスを示すパラメータを見つけます.
要約する
この戦略は,移動平均とランダムな指標の優位性を十分に利用し,より信頼性の高いトレンド追跡システムを構築しています.複数の時間枠と指標の検証により,中長期トレンドの方向をうまく捉えることができます.また,ストップ・ストップの設定は,市場変動を一定程度に耐えるようにします.しかし,より多くの指標の組み合わせをテストし,最適のパラメータを探すために機械学習方法を導入するなど,改善の余地があります.全体的に,これは非常に有望な取引戦略です.
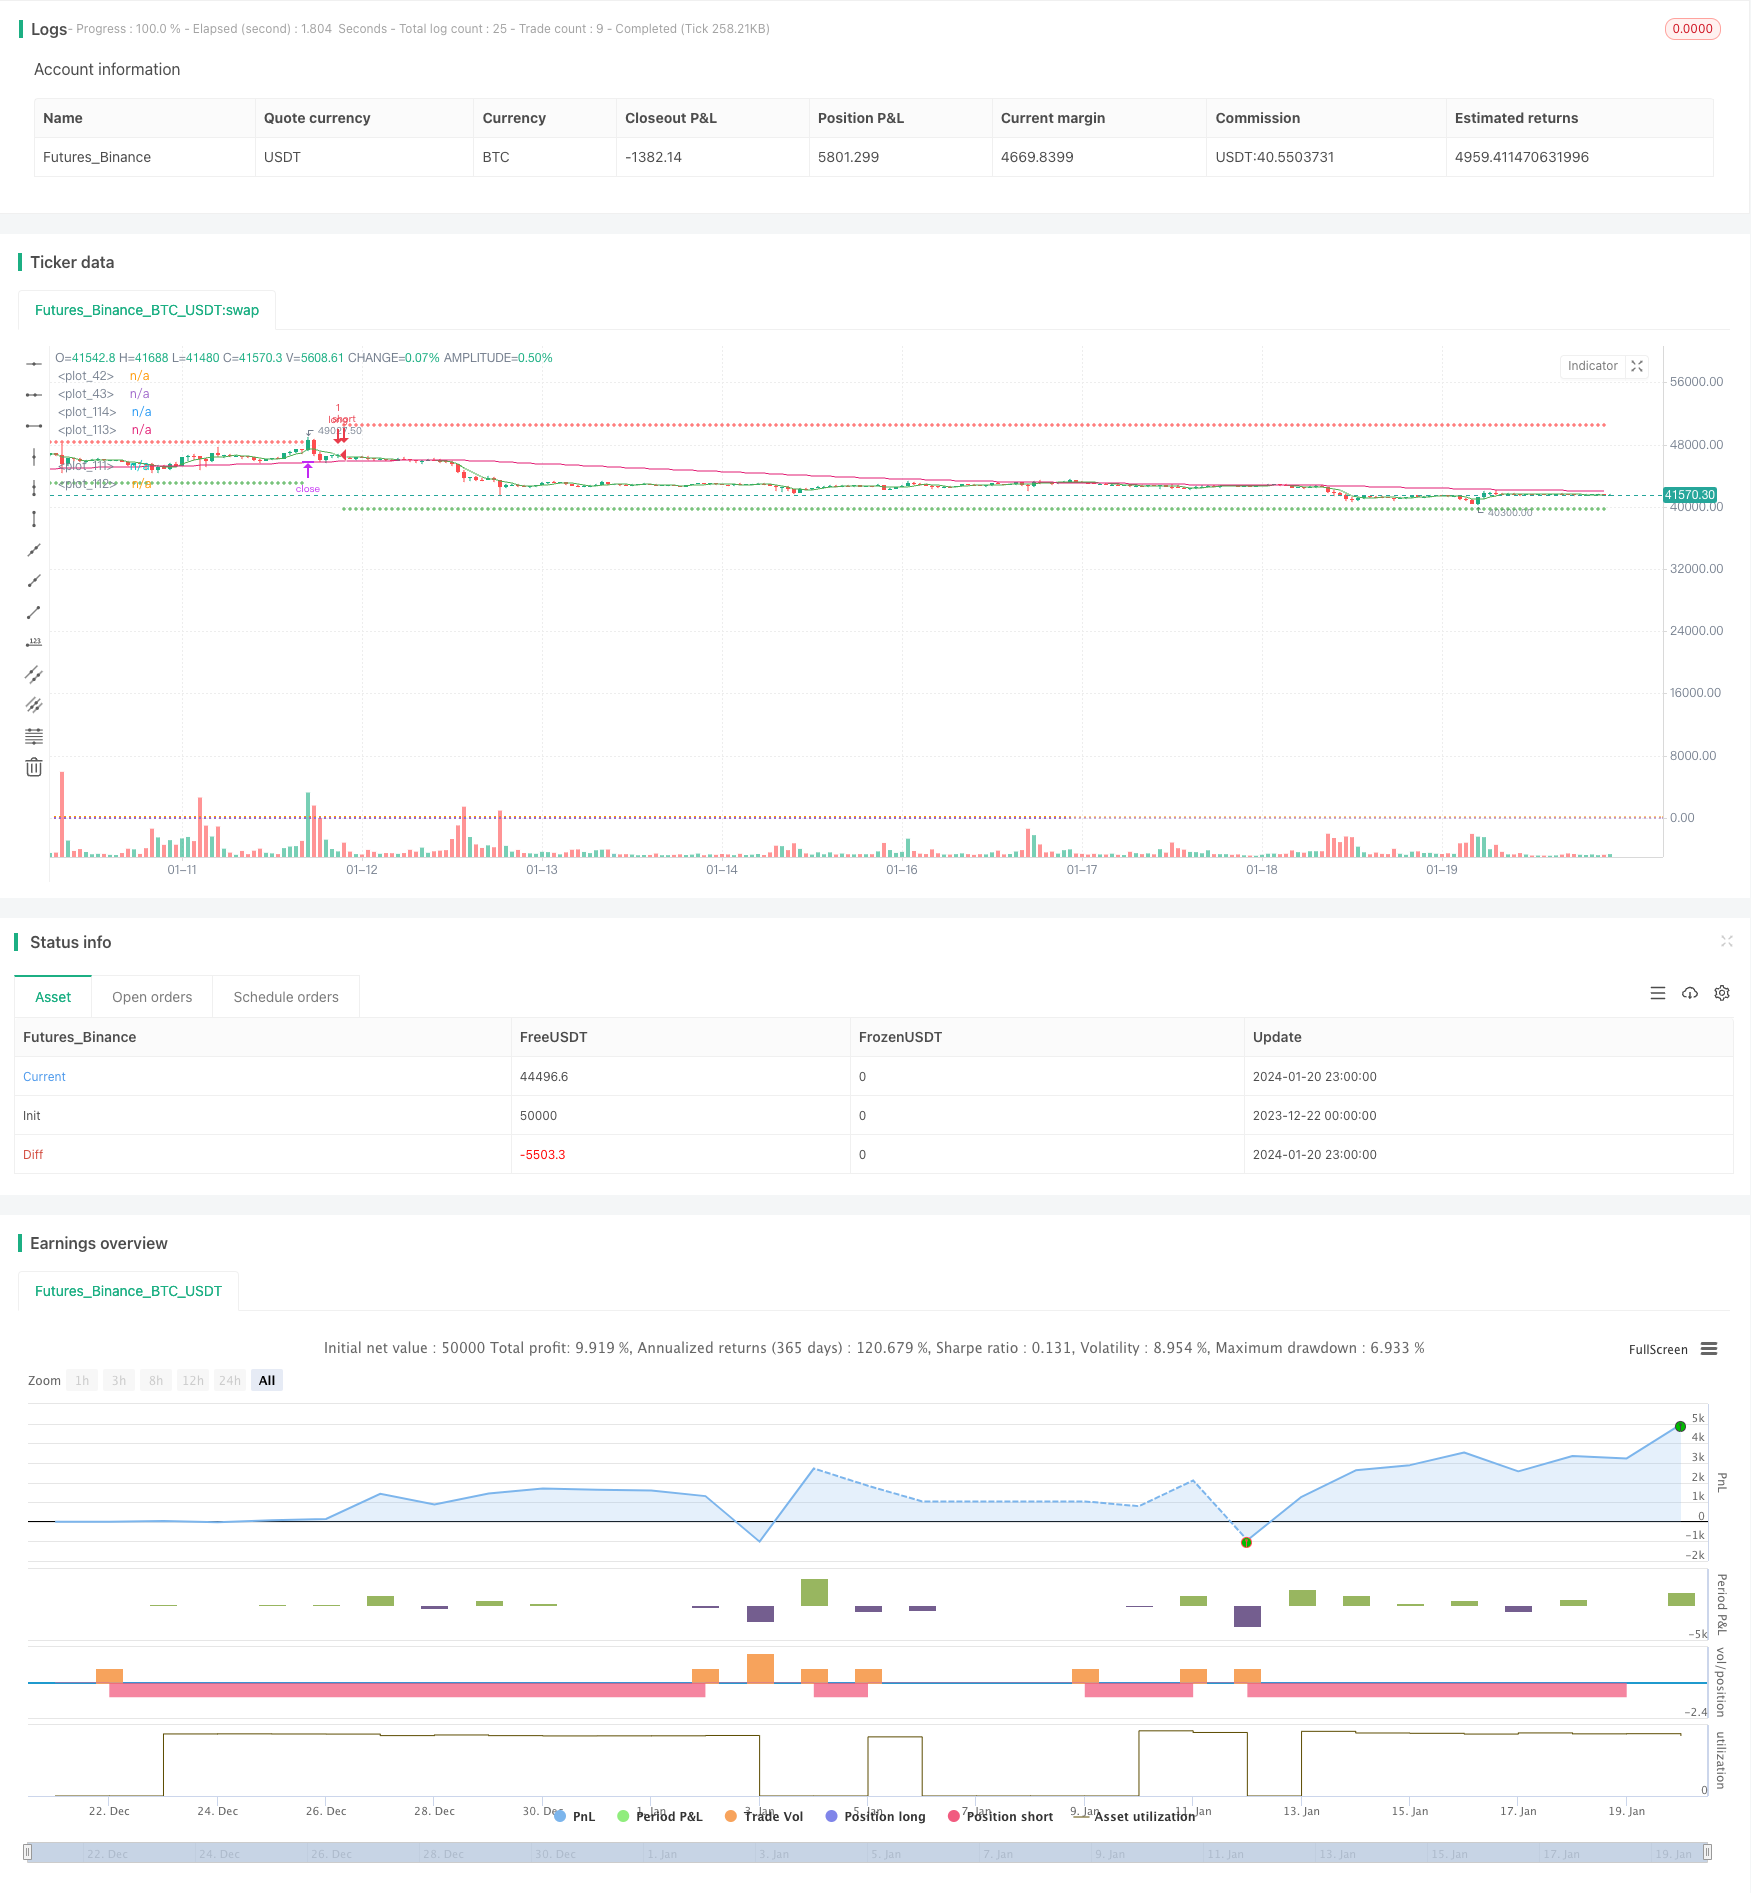
/*backtest
start: 2023-12-22 00:00:00
end: 2024-01-21 00:00:00
period: 1h
basePeriod: 15m
exchanges: [{"eid":"Futures_Binance","currency":"BTC_USDT"}]
*/

// This source code is subject to the terms of the Mozilla Public License 2.0 at https://mozilla.org/MPL/2.0/
// © bufirolas

// Works well with a wide stop with 20 bars lookback
// for the SL level and a 2:1 reward ratio Take Profit .
// These parameters can be modified in the Inputs section of the strategy panel.

// "an entry signal it's a cross down or up on
// the stochastics. if you're in a downtrend
// on the hourly time frame you
// must also be in a downtrend on the five
// minute so the five period has to be below the 144
// as long as the five period is still trading below
// the 144 period on both the hourly and the five minutes
// we are looking for these short signals crosses down
// in the overbought region of the stochastic. Viceversa for longs"

//@version=4
strategy("Stoch + WMA + SMA strat", overlay=true)

//SL & TP Inputs
i_SL=input(true, title="Use Swing Lo/Hi Stop Loss & Take Profit")
i_SwingLookback=input(20, title="Swing Lo/Hi Lookback")
i_SLExpander=input(defval=10, step=1, title="SL Expander")
i_TPExpander=input(defval=30, step=1, title="TP Expander")
i_reverse=input(false, title="Reverse Trades")
i_TStop =input(false, title="Use Trailing Stop")

//Strategy Inputs
src4 = input(close, title="RSI Source")
stochOS=input(defval=20, step=5, title="Stochastics Oversold Level")
stochOB=input(defval=80, step=5, title="Stochastics Overbought Level")

//Stoch rsi Calculations
smoothK = input(3, minval=1)
smoothD = input(3, minval=1)
lengthRSI = input(14, minval=1)
lengthStoch = input(14, minval=1)
rsi1 = rsi(src4, lengthRSI)
k = sma(stoch(rsi1, rsi1, rsi1, lengthStoch), smoothK)
d = sma(k, smoothD)
h0 = hline(80, linestyle=hline.style_dotted)
h1 = hline(20, linestyle=hline.style_dotted)

//MA
wmalen=input(defval=144, title="WMA Length")
WMA = security(syminfo.tickerid, "60", wma(close, wmalen))
SMA = security(syminfo.tickerid, "60", sma(close, 5))
minWMA = wma(close, wmalen)
minSMA = sma(close, 5)

//Entry Logic
stobuy = crossover(k, d) and k < stochOS
stosell = crossunder(k, d) and k > stochOB
mabuy = minSMA > minWMA
daymabuy = SMA > WMA

//SL & TP Calculations
SwingLow=lowest(i_SwingLookback)
SwingHigh=highest(i_SwingLookback)
bought=strategy.position_size != strategy.position_size[1]
LSL=valuewhen(bought, SwingLow, 0)-((valuewhen(bought, atr(14), 0)/5)*i_SLExpander)
SSL=valuewhen(bought, SwingHigh, 0)+((valuewhen(bought, atr(14), 0)/5)*i_SLExpander)
lTP=(strategy.position_avg_price + (strategy.position_avg_price-(valuewhen(bought, SwingLow, 0)))+((valuewhen(bought, atr(14), 0)/5)*i_TPExpander))
sTP=(strategy.position_avg_price - (valuewhen(bought, SwingHigh, 0) - strategy.position_avg_price))-((valuewhen(bought, atr(14), 0)/5)*i_TPExpander)
islong=strategy.position_size > 0
isshort=strategy.position_size < 0

//TrailingStop
dif=(valuewhen(strategy.position_size>0 and strategy.position_size[1]<=0, high,0))
 -strategy.position_avg_price
trailOffset     = strategy.position_avg_price - LSL
var tstop = float(na)
if strategy.position_size > 0
    tstop := high- trailOffset - dif
    if tstop<tstop[1]
        tstop:=tstop[1]
else
    tstop := na
StrailOffset     = SSL - strategy.position_avg_price
var Ststop = float(na)
Sdif=strategy.position_avg_price-(valuewhen(strategy.position_size<0
 and strategy.position_size[1]>=0, low,0))
if strategy.position_size < 0
    Ststop := low+ StrailOffset + Sdif
    if Ststop>Ststop[1]
        Ststop:=Ststop[1]
else
    Ststop := na

//Stop Selector
SL= islong ? LSL : isshort ? SSL : na
if i_TStop
    SL:= islong ? tstop : isshort ? Ststop : na
TP= islong ? lTP : isshort ? sTP : na


//Entries
if stobuy and mabuy and daymabuy
    strategy.entry("long", long=not i_reverse?true:false)
if stosell and not mabuy and not daymabuy
    strategy.entry("short", long=not i_reverse?false:true)


//Exit
if i_SL
    strategy.exit("longexit", "long", stop=SL, limit=TP)
    strategy.exit("shortexit", "short", stop=SL, limit=TP)

//Plots
plot(i_SL ? SL : na, color=color.red, style=plot.style_cross)
plot(i_SL ? TP : na, color=color.green, style=plot.style_cross)
plot(minWMA)
plot(minSMA, color=color.green)