リバーサルベクトルRSIトレンドフォローETF取引戦略
概要
この戦略は,比較的強い指数 ((RSI)) に基づく反転トレンドを追跡するETF取引戦略である.これは,RSI指標によって短期的な超買い超売り現象を判断し,反転エントリーとエクジットを実行し,同時に200日移動平均を組み合わせて,全体的なトレンド方向を判断する.
戦略原則
この戦略の核心的な論理は,RSI指標の反転原理に基づいています. RSI指標は,期間中の平均の上昇幅を計算することによって,取引品が過買または過売状態にあるかどうかを判断します. RSIが70を超えると過買を意味し,RSIが30を下回ると過売を意味します.
この策略は,この原理を利用して,その日のRSIを調整可能なパラメータより低い値に設定します.TodaysMinRSI3日前 RSIは調整可能なパラメータよりも低かったDay3RSIMax価格が短期的な超売り領域にあり,反発の可能性があることを意味する.また,3日間のRSIが下降傾向を示すことを要求する.つまり,RSIが継続的に下降するから購入する.偽反発を避ける.
戦略の退出メカニズムは,RSI指標が再び調整可能なパラメータを超えるとです.Exit RSI逆転が終わったと判断し,平仓退出を行う.
この戦略はまた,全体的なトレンド判断として200日移動平均を導入した. 価格が200日線以上である場合にのみ買い取りを行うことができる. これは,逆転取引のリスクを避けるために,トレンドの上昇段階でのみ買い取りを保証するのに役立ちます.
戦略的優位分析
- RSIで判断すると, 超買いと超売りの領域は, ベルリオンになる可能性が高い.
- 200日線と組み合わせて,大トレンドの方向を判断することで,逆向きの取引を避けるのに役立ちます.
- RSIの逆転取引は古典的で信頼性があり,成功率も高い.
- 調整可能なパラメータは,異なる品種に対して最適化できる柔軟性を提供します.
リスクと解決策
- RSI指標に偽突破の可能性があり,損失を完全に回避することはできません. 損失を制御するためにストップを設定できます.
- 逆転の失敗は,損失の拡大につながる可能性がある. 持仓時間を短縮し,損失を早期に止めて退出することができる.
- パラメータ設定が不適切である場合,過剰な激進性や過剰な保守性によって取引機会が逃れることがあります.品種に対してパラメータ最適化テストを行う必要があります.
最適化の方向
- KDJ,ブリン帯など他の指標の結合を加え,指標の組み合わせを形成し,信号の正確性を向上させる.
- モバイル・ストップ・ストラトジーを追加し,ストップ・レベルを変化させ,損失を減らす.
- 取引量または資金管理モジュールを追加し,各取引のリスクのエッジを制御します.
- 異なる品種のパラメータを最適化して反テストし,適切な品種に適したパラメータの組み合わせを策定する.
要約する
この戦略は,RSI指標の古典的な買出点原理を利用して,超買超売り領域を判断することによって逆転エントリーとエクジットを行う.大きなトレンド判断とパラメータ最適化スペースを考慮しながら,高い信頼性の短期逆転ETF戦略である.さらなる最適化により,実戦効果のある定量化戦略となる.
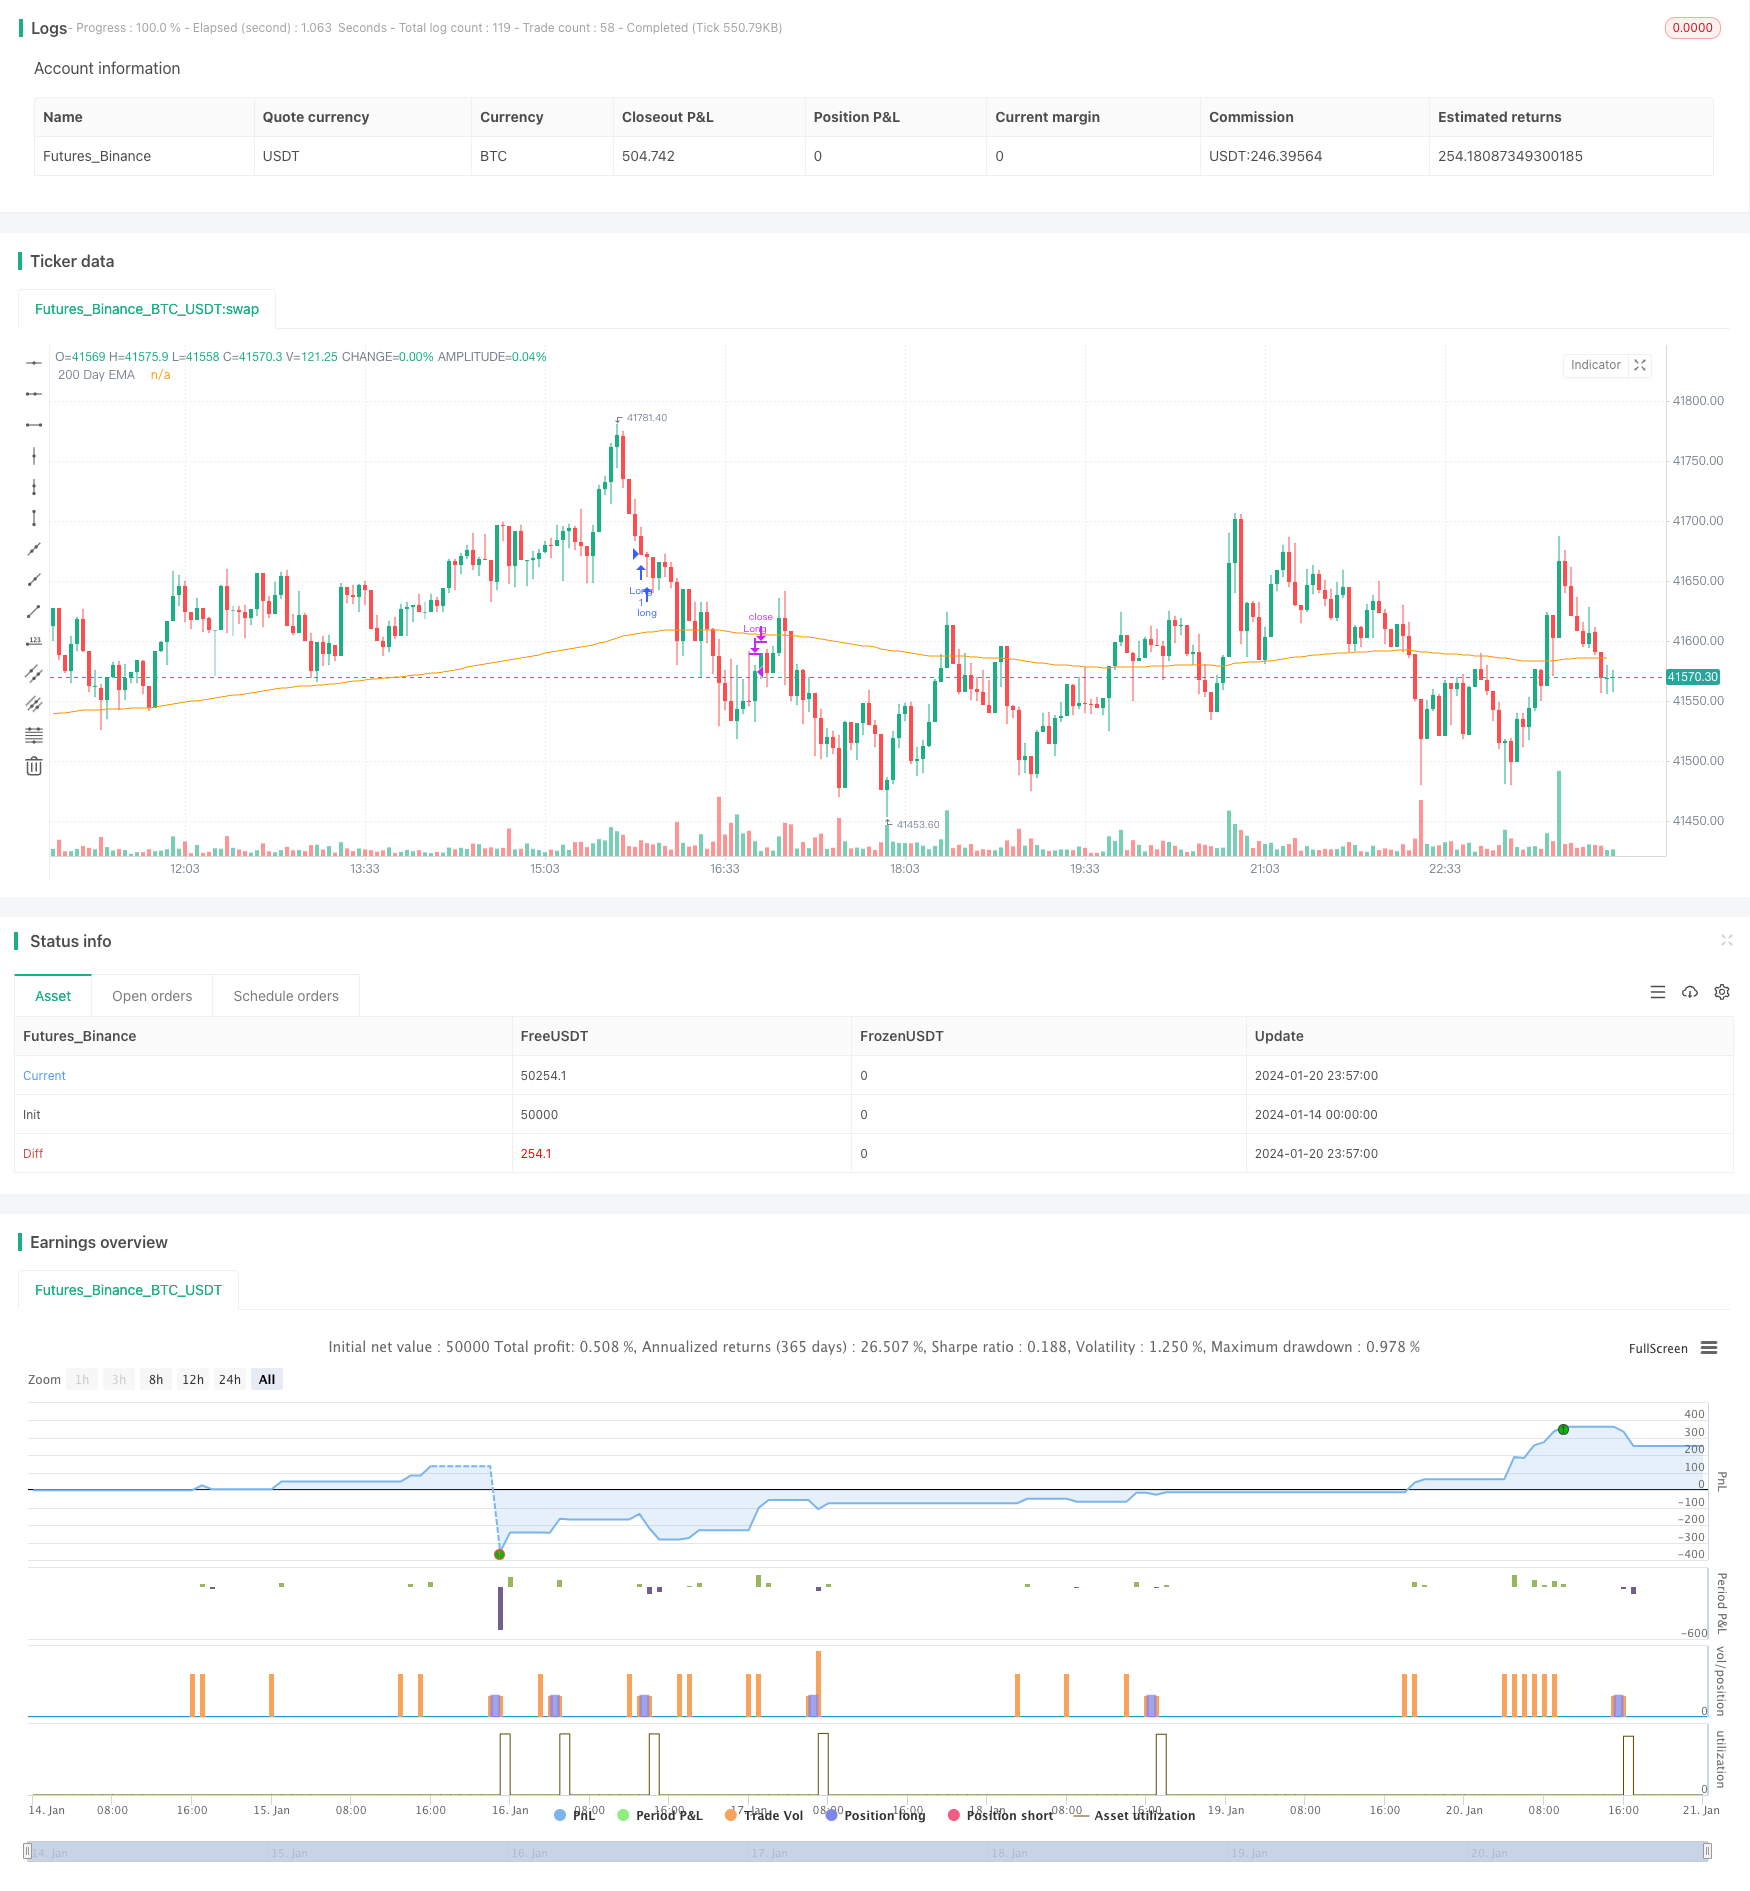
/*backtest
start: 2024-01-14 00:00:00
end: 2024-01-21 00:00:00
period: 3m
basePeriod: 1m
exchanges: [{"eid":"Futures_Binance","currency":"BTC_USDT"}]
*/

// This source code is subject to the terms of the Mozilla Public License 2.0 at https://mozilla.org/MPL/2.0/
// @version = 5
// Author = TradeAutomation


strategy(title="R3 ETF Strategy", shorttitle="R3 ETF Strategy", overlay=true)


// Backtest Date Range Inputs //
StartTime = input(defval=timestamp('01 Jan 2012 05:00 +0000'), title='Start Time')
EndTime = input(defval=timestamp('01 Jan 2099 00:00 +0000'), title='End Time')
InDateRange = true

// Calculations and Inputs //
RSILen = input.int(2, "RSI Length")
RSI = ta.rsi(close, RSILen)
TodaysMinRSI = input.int(10, "Today's Min RSI for Entry", tooltip = "The RSI must be below this number today to qualify for trade entry")
Day3RSIMax = input.int(60, "Max RSI 3 Days Ago for Entry", tooltip = "The RSI must be below this number 3 days ago to qualify for trade entry")
EMA = ta.ema(close, 200)

// Strategy Rules //
Rule1 = close>ta.ema(close, 200)
Rule2 = RSI[3]<Day3RSIMax and RSI<TodaysMinRSI
Rule3 = RSI<RSI[1] and RSI[1]<RSI[2] and RSI[2]<RSI[3]
Exit = ta.crossover(RSI, input.int(70, "Exit RSI", tooltip = "The strategy will sell when the RSI crosses over this number"))

// Plot //
plot(EMA, "200 Day EMA")

// Entry & Exit Functions //
if (InDateRange)
    strategy.entry("Long", strategy.long, when = Rule1 and Rule2 and Rule3)
//    strategy.close("Long", when = ta.crossunder(close, ATRTrailingStop))
    strategy.close("Long", when = Exit)
if (not InDateRange)
    strategy.close_all()