ダイナミック モメンタム オシレーター取引戦略
概要
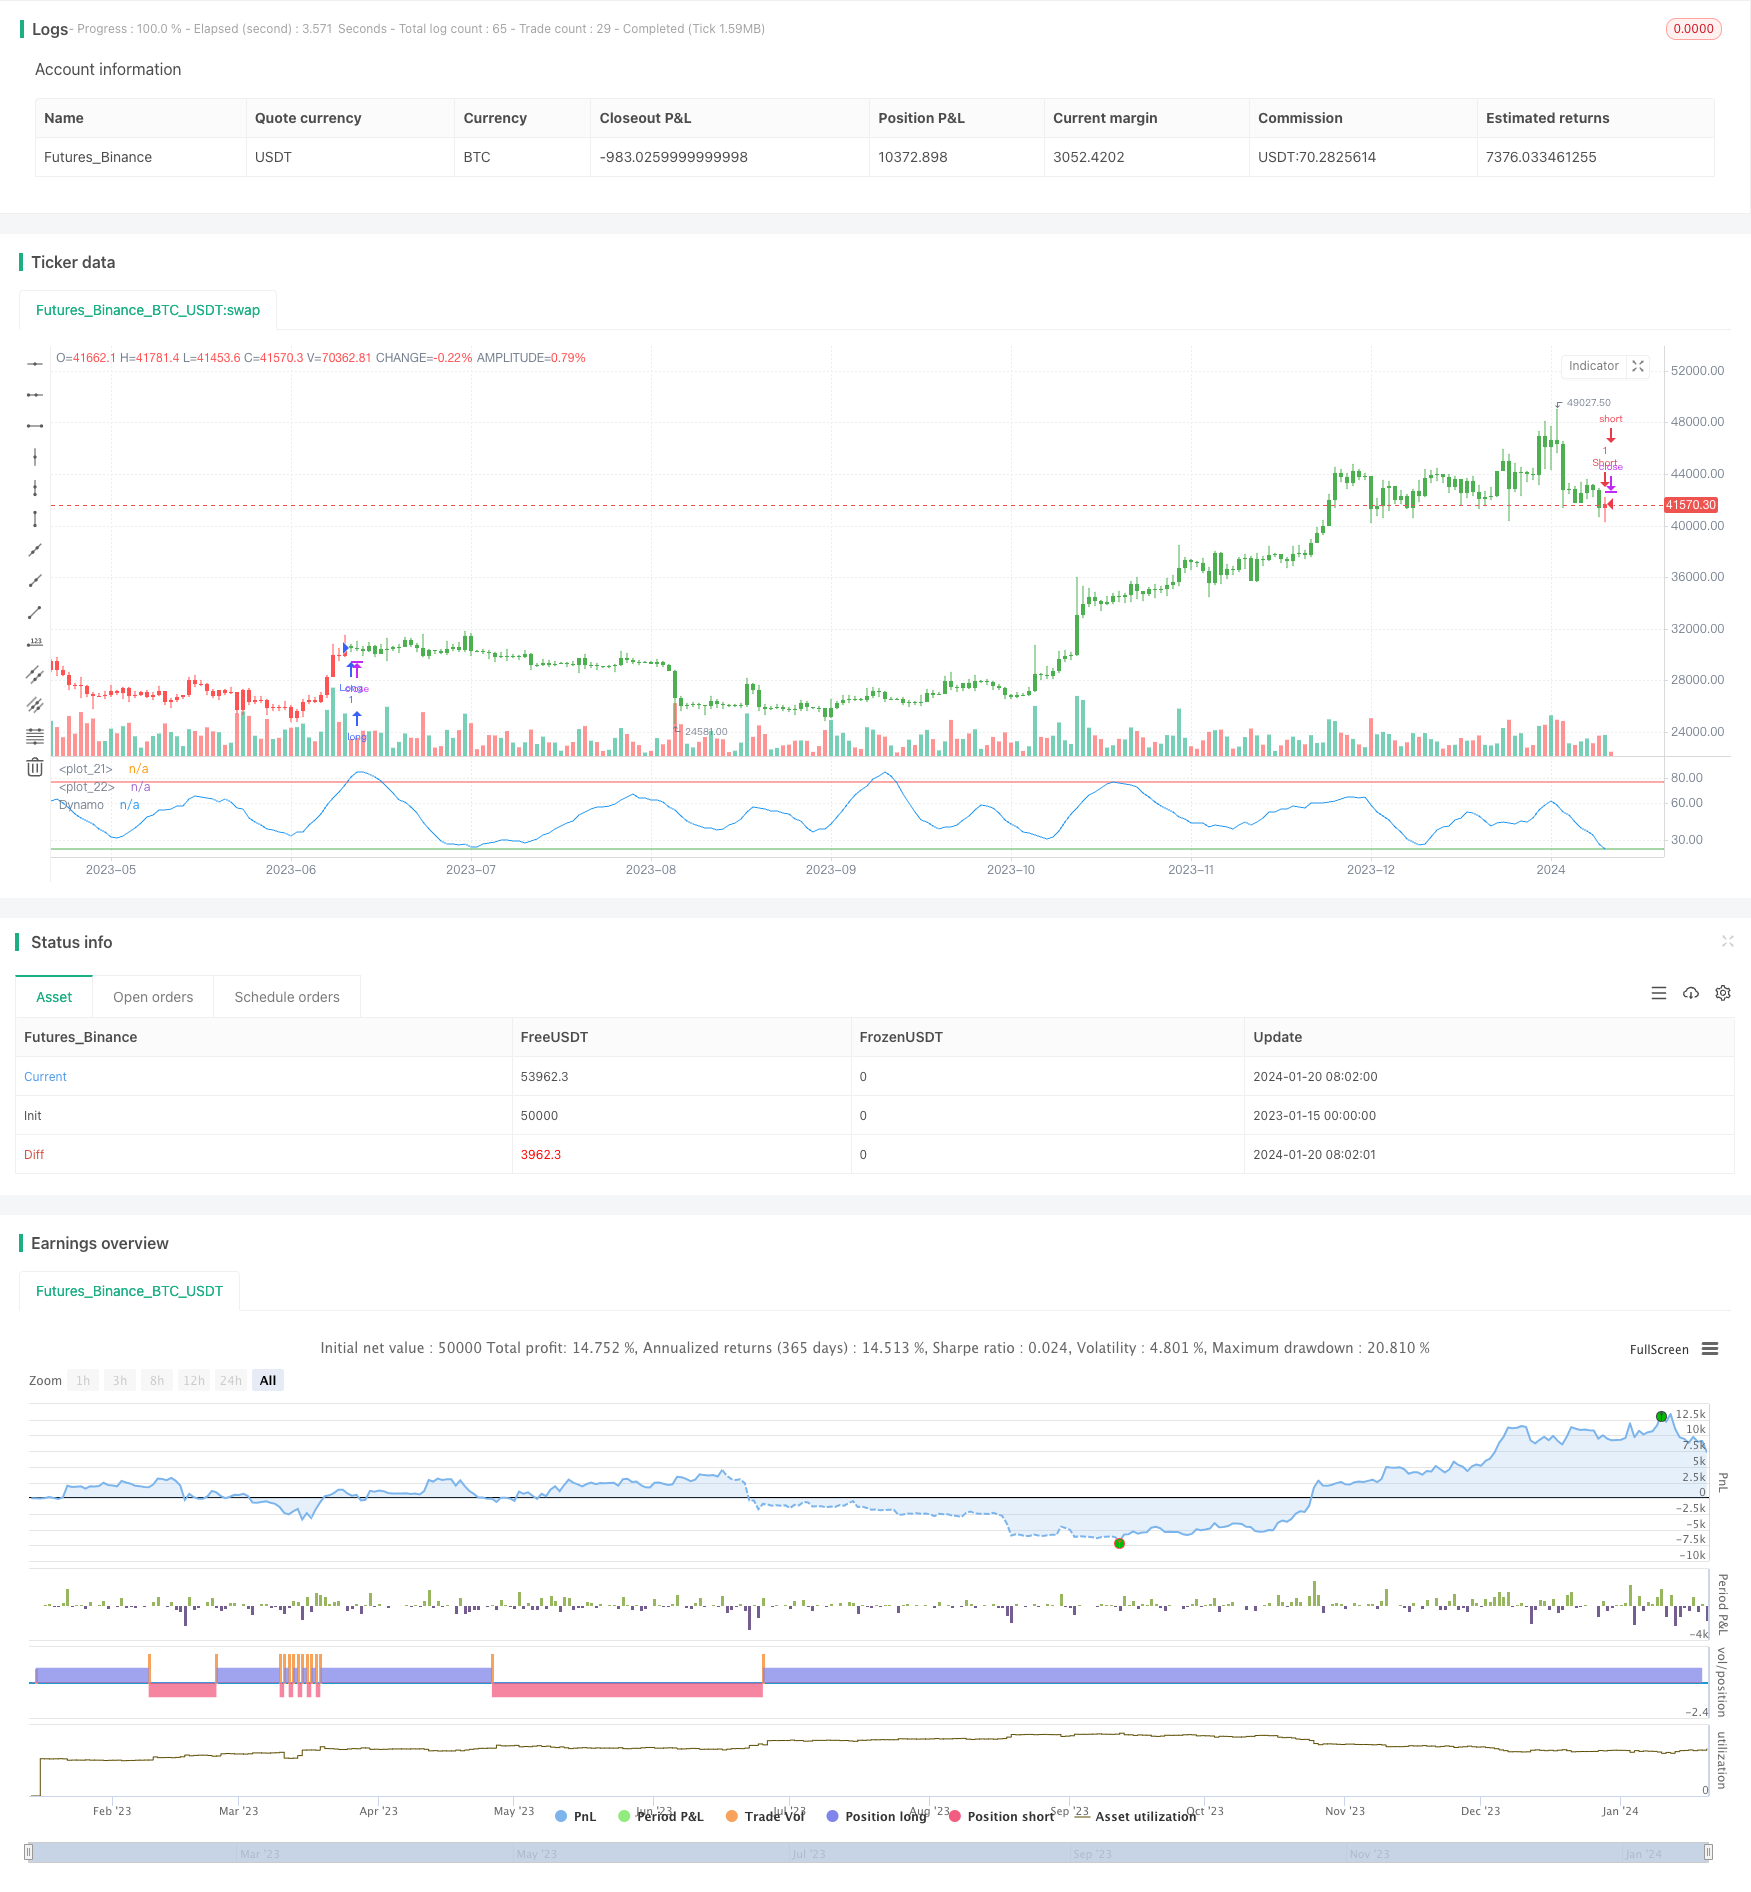
ダイナミック・モメンタム・オシレータ・トレーディング・ストラテジー (Dynamic Momentum Oscillator Trading Strategy) は,E.マーシャル・ウォールが1996年7月に期貨誌に掲載した記事で提唱したダイナミック・モメンタム・オシレータ・インジケータ (Dynamo) に基づき,標準オシレータの正常化処理を行って,トレンドの影響を排除する.
戦略原則
この戦略は,まず10日間のランダムな指数 (ストキャスティック・オシレータ) を計算し,その指数の10日間の単純移動平均を計算し,その移動平均に基づいて20日間の移動平均を計算する.この平均は,ダイナミック・ダイナミック・オシレータの計算基盤を形成する.
Strategyは次に指数の最高値と最低値を計算し,それから中間値を計算する. 20日平均線を原指数と差分し,中間値からこの差分を減算し,標準化された振動器を形成する.この標準化された値が77以上であるときは多し,23未満であるときは空にする.
優位分析
この戦略の主な利点は
ダイナミック・ダイナミック・オシブラー・インディケーターは,トレンドの影響を排除し,取引シグナルをより信頼性のあるものにする.
オーバーバイオーバーセールゾーンと組み合わせると,ターニングポイントでより正確な取引シグナルを生成することができる.
規則はシンプルでわかりやすく,実行しやすい.
リスク分析
この戦略の主なリスクは
市場が暴動する時には,指標が誤信号を発する確率は高くなります. リスクを管理するためにストップダストを設定できます.
振動市場では,しばしば偽信号が生じます。パラメータを適切に調整して,いくつかのノイズをフィルターすることができます。
取引の頻度が高く,取引コストが収益に一定影響を及ぼします.
最適化の方向
この戦略は以下の点で最適化できます.
異なる市場のデータをテストし,最適の契約と最適のパラメータの組み合わせを探します.
フィルタリング条件を追加し,信号を発信する前にトレンドの強さを判定し,震動の状況で捕まるのを避ける.
価格が不利な方向に突破したときに,ストップ・アウトを選択する.
この戦略に基づいて,より複雑な取引システムを開発し,複数の他の指標と組み合わせて意思決定を行うことができます.
要約する
動的動的振動器取引戦略は,トレンドの影響を取り除き,オーバーバイオーバーセール領域でより正確な取引シグナルを発信する.この戦略はシンプルで使いやすいが,ある程度のリスクも伴う.パラメータとルールの最適化により,システムの安定性と収益性をさらに改善することができる.
/*backtest
start: 2023-01-15 00:00:00
end: 2024-01-21 00:00:00
period: 1d
basePeriod: 1h
exchanges: [{"eid":"Futures_Binance","currency":"BTC_USDT"}]
*/

//@version=2
////////////////////////////////////////////////////////////
//  Copyright by HPotter v1.0 10/04/2017
// In July 1996 Futures magazine, E. Marshall Wall introduces the
// Dynamic Momentum Oscillator (Dynamo). Please refer to this article
// for interpretation.
// The Dynamo oscillator is a normalizing function which adjusts the
// values of a standard oscillator for trendiness by taking the difference
// between the value of the oscillator and a moving average of the oscillator
// and then subtracting that value from the oscillator midpoint.
//
// You can change long to short in the Input Settings
// Please, use it only for learning or paper trading. Do not for real trading
////////////////////////////////////////////////////////////
strategy(title="Dynamo", shorttitle="Dynamo")
OscLen = input(10, minval=1)
MALen = input(20, minval=1)
HiBand = input(77, minval=1)
LowBand = input(23)
reverse = input(false, title="Trade reverse")
hline(HiBand, color=red, linestyle=line)
hline(LowBand, color=green, linestyle=line)
xOscK = stoch(close, high, low, OscLen)
xOscAvg = sma(xOscK, OscLen)
xMAVal = sma(xOscAvg, MALen)
maxNum = 9999999
LowestSoFar = iff(xOscAvg < nz(LowestSoFar[1], maxNum), xOscAvg, nz(LowestSoFar[1], maxNum))
HighestSoFar = iff(xOscAvg > nz(HighestSoFar[1]), xOscAvg, nz(HighestSoFar[1]))
MidPnt = (LowestSoFar + HighestSoFar) / 2
nRes = MidPnt - (xMAVal - xOscAvg)
pos = iff(nRes > HiBand, 1,
	     iff(nRes < LowBand, -1, nz(pos[1], 0)))
possig = iff(reverse and pos == 1, -1,
          iff(reverse and pos == -1, 1, pos))
if (possig == 1)
    strategy.entry("Long", strategy.long)
if (possig == -1)
    strategy.entry("Short", strategy.short)
barcolor(possig == -1 ? red: possig == 1 ? green : blue )
plot(nRes, color=blue, title="Dynamo")