ダブル移動平均クロスオーバー MACD トレンドフォロー戦略
概要
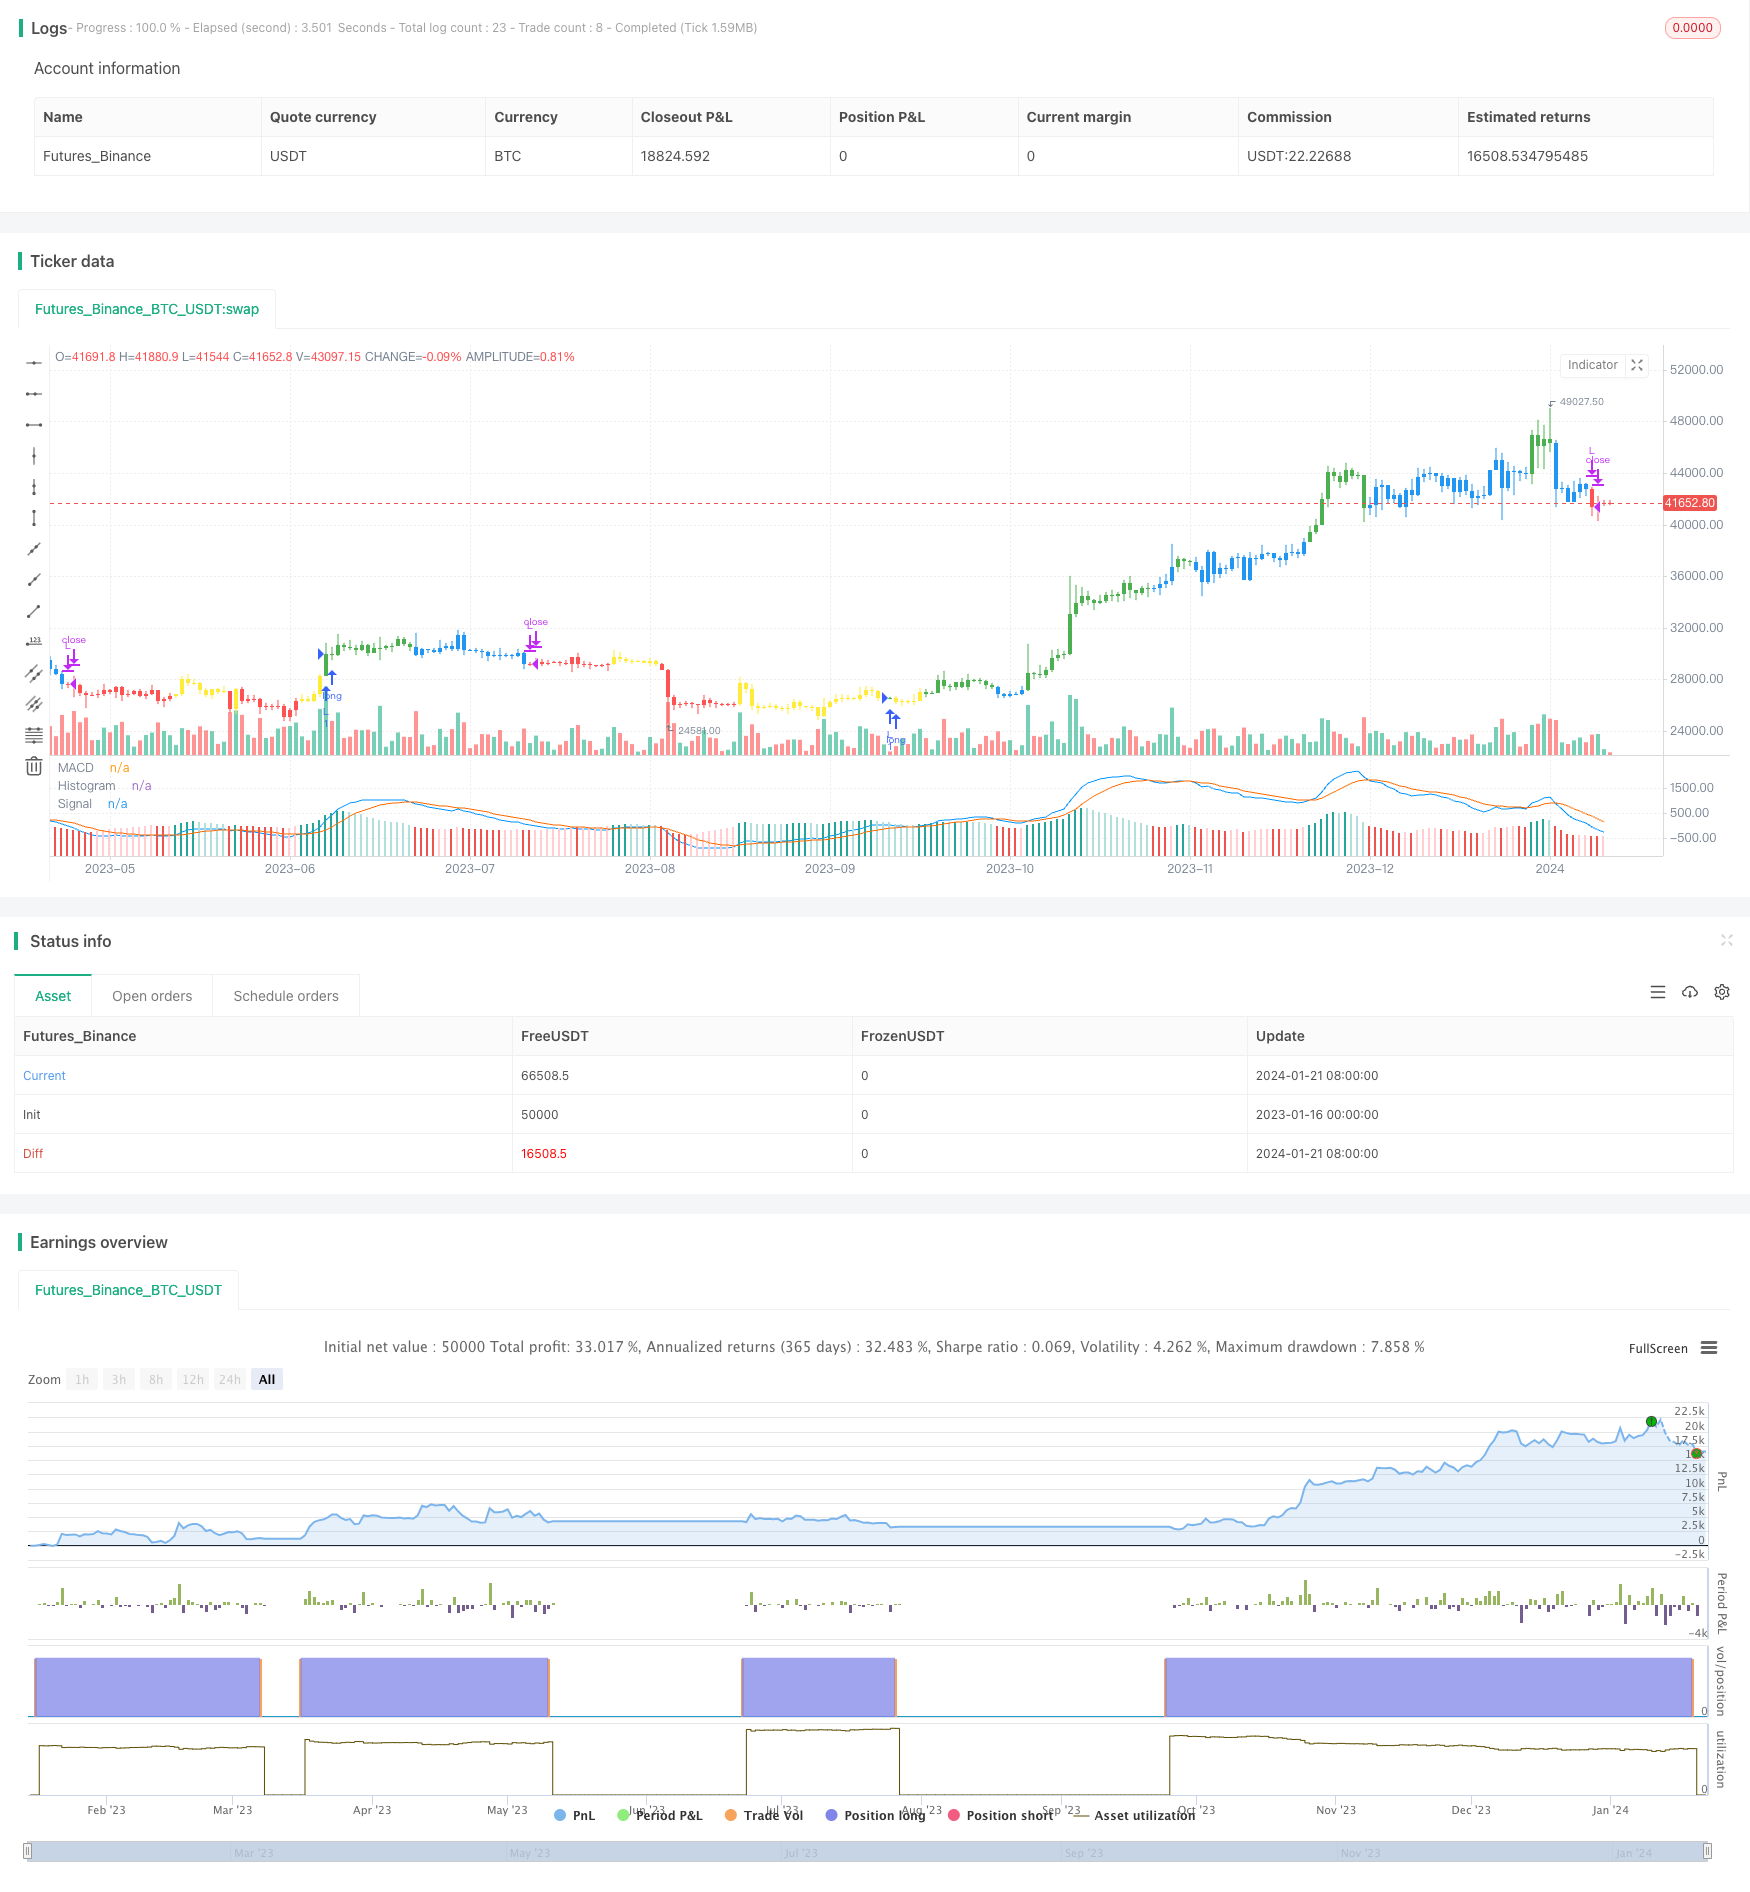
この戦略は,双移動平均の交差したMACDの技術指標に基づいて実現される自動取引戦略である. MACDの指標の快慢な線交差信号を使用して,トレンドの方向を判断し,トレンド追跡を実現する.
戦略原則
この策略はまず,MACD指標の3つの曲線を計算する.快線,慢線,離散線.快線は,一定の周期でより速い移動平均であり,慢線はより長い周期の移動平均である.離散線は,快線と慢線の差である.快線上を通過すると金叉信号で,買入信号を示し,短線下を通過すると死叉信号で,売り信号を示している.
この戦略は,この原理を利用して,金叉時に多し,死叉時に平仓する;または,死叉時に空き,金叉時に平仓する,自動追跡トレンドを実現する.同時に,戦略は,MACD線の絶対値を正負と判断し,偽信号を回避し,トレンド転換点を真に捕捉することを保証する.
戦略的優位性
- 双動平均を交差してトレンドの方向を判断し,トレンドの転換を正確に捉える
- MACD技術指標は偽信号を減らし,信号の質を向上させる
- 選択する際の柔軟性 余分な空き時間または空き時間だけ
- パラメータは,異なる市場環境に対応して調整できます.
戦略リスク
- 双動平均の交差が遅れているため,転向開始時の利益の一部を逃す可能性があります.
- MACD指数は,波動する市場において偽信号を発生させる傾向にある.
- パラメータを適切に調整し,過度に敏感または鈍感にならないようにする
リスク対策:
- 他の指標と組み合わせたフィルター信号
- パラメータを調整し,取引頻度を下げる
- この戦略は,トレンドがはっきりしたときにのみ実行されます.
戦略最適化の方向性
この戦略は以下の点で最適化できます.
他の指標確認信号,例えばKDJ指標,ブリン帯指標などと組み合わせて,偽信号をフィルターする
突破フィルターなど,予期せぬ早すぎ,遅すぎの入場を避けるための入場メカニズムの変更
パラメータ設定を最適化し,異なる周期と市場環境に応じて快線・慢線周期を調整し,市場に対応する
単一損失をコントロールするストップ・ローズ戦略
外貨,デジタル通貨などに拡張できます.
要約する
この双動平均交差MACDトレンド追跡策略は,MACD指標を使用してトレンドの方向を判断し,快慢線交差フィルター信号と組み合わせて,トレンドの転換を効果的に捕捉し,トレンドを自動で追跡する.戦略の優点は,トレンドを正確に判断し,パラメータを柔軟に調整し,市場環境に応じて最適化することができる.リスク管理に注意する必要がある.偽信号を生じないようにする.他の技術指標とパラメータの調整と組み合わせれば,この戦略の効果はより優れている.
/*backtest
start: 2023-01-16 00:00:00
end: 2024-01-22 00:00:00
period: 1d
basePeriod: 1h
exchanges: [{"eid":"Futures_Binance","currency":"BTC_USDT"}]
*/

// This source code is subject to the terms of the Mozilla Public License 2.0 at https://mozilla.org/MPL/2.0/
// © DeMindSET

//@version=4
strategy("MACD Trend Follow Strategy", overlay=false)
// Getting inputs
LSB = input(title="Long/Short", defval="Long only", options=["Long only", "Short only" , "Both"])
fast_length = input(title="Fast Length", type=input.integer, defval=12)
slow_length = input(title="Slow Length", type=input.integer, defval=26)
src = input(title="Source", type=input.source, defval=close)
signal_length = input(title="Signal Smoothing", type=input.integer, minval = 1, maxval = 50, defval = 9)
sma_source = input(title="Simple MA(Oscillator)", type=input.bool, defval=false)
sma_signal = input(title="Simple MA(Signal Line)", type=input.bool, defval=false)

// Plot colors
col_grow_above = #26A69A
col_grow_below = #FFCDD2
col_fall_above = #B2DFDB
col_fall_below = #EF5350
col_macd = #0094ff
col_signal = #ff6a00

// Calculating
fast_ma = sma_source ? sma(src, fast_length) : ema(src, fast_length)
slow_ma = sma_source ? sma(src, slow_length) : ema(src, slow_length)
macd = fast_ma - slow_ma
signal = sma_signal ? sma(macd, signal_length) : ema(macd, signal_length)
hist = macd - signal

plot(hist, title="Histogram", style=plot.style_columns, color=(hist>=0 ? (hist[1] < hist ? col_grow_above : col_fall_above) : (hist[1] < hist ? col_grow_below : col_fall_below) ), transp=0 )
plot(macd, title="MACD", color=col_macd, transp=0)
plot(signal, title="Signal", color=col_signal, transp=0)
//
Bull= macd > signal
Bear= macd < signal
ConBull=macd>0
ConBear=macd<0
//
Green= Bull and ConBull
Red= Bear and ConBear
Yellow= Bull and ConBear
Blue= Bear and ConBull
//
bcolor = Green ? color.green : Red ? color.red : Yellow ? color.yellow : Blue ? color.blue : na
barcolor(color=bcolor)
// === INPUT BACKTEST RANGE ===
FromYear  = input(defval = 2019, title = "From Year", minval = 1920)
FromMonth = input(defval = 1, title = "From Month", minval = 1, maxval = 12)
FromDay   = input(defval = 1, title = "From Day", minval = 1, maxval = 31)
ToYear    = input(defval = 9999, title = "To Year", minval = 2009)
ToMonth   = input(defval = 12, title = "To Month", minval = 1, maxval = 12)
ToDay     = input(defval = 31, title = "To Day", minval = 1, maxval = 31)

// === FUNCTION EXAMPLE ===
start     = timestamp(FromYear, FromMonth, FromDay, 00, 00)  // backtest start window
finish    = timestamp(ToYear, ToMonth, ToDay, 23, 59)        // backtest finish window
window()  => true // create function "within window of time"

if LSB == "Long only" and Green
    strategy.entry("L",true)
if LSB == "Long only" and Red
    strategy.close("L",qty_percent=100,comment="TP Long")
if LSB == "Both" and Green
    strategy.entry("L",true)
if LSB == "Both" and Red
    strategy.entry("S",false)
if LSB == "Short only" and Red
    strategy.entry("S",false)
if LSB == "Short only" and Green
    strategy.close("S",qty_percent=100,comment="TP Short")