ATRとRSIに基づく適応型トレーリングストップトレンドフォロー戦略
概要
この戦略は,平均実際の波動範囲 ((ATR),相対的に強い指数 ((RSI) と移動ストップを組み合わせて,自己適応的なトレンド追跡を実現する.ATRを介してダイナミックストップを計算し,市場トレンドの方向を判断するためにRSIを使用し,移動ストップをトラッキングする.価格の波動により利益を最大化する.これは非常に典型的なトレンド追跡戦略である.
戦略原則
ATRを計算する.ATRは市場の波動性とリスクレベルを反映する.この戦略はATRを計算してダイナミックストロップを計算し,自律的なストロップを実現する.
RSIを計算する。 RSIは市場の超買い超売り現象を判断する。 RSIが50より大きいときは看板であり,50より小さいときは下落である。この戦略は価格の傾向方向を判断するためにRSIを使用する。
移動ストップトラッキング. この戦略は,ATRの計算されたストップポイントとRSIの判断によるトレンドの方向に基づいて,移動ストップを実現するために,価格の変動を継続的に追跡し,ストップを保証しながら徐々にストップを拡大し,利益を最大化します.
具体的には,RSIが50より大きい時に多仓を開き,50より小さい時に空仓を開く.その後ATR計算によるストップ・プライスを使って移動ストップを,価格変動を追跡する.
優位分析
ATRを利用して自律的なストップを実現し,市場の変動動向に応じてストップ幅を調整し,ストップが大きすぎすぎないデメリットを避ける.
RSIはトレンドの方向を正確に判断し,波動的な市場の中で取引を避けることができます.
モバイルストップは価格の変動を追跡し,ストップを拡大してトレンドを十分に追跡できます.
リスク分析
ATRとRSIのパラメータの設定は,反テストで最適化する必要があります.そうでなければ,戦略の効果に影響を与えるでしょう.
止損保護があるが,大幅な空飛ぶことは避けられないので止損が突破されるリスクがある.リスクを制御するためにポジションを適切に縮小することができる.
戦略は取引品種パラメータの最適化に依存し,異なる品種に合わせてパラメータを調整する必要がある.
最適化の方向
機械学習のアルゴリズムを組み込み,パラメータの自己適応最適化を実現することも考えられます.
ポジション制御モジュールを追加し,市場状況に応じてポジションのサイズを動的に調整し,破損の確率を低下させる.
トレンド判断の指標を増やして,最下位の転換点を逃すことで損失を回避する.
要約する
この戦略は,ATR,RSI,移動ストップなどのモジュールを統合して,典型的な自己適応トレンド追跡戦略を形成する.パラメータ最適化により,異なる取引品種に非常に柔軟に適応することが可能であり,一般的なトレンド追跡戦略として推奨される.より多くの指標判断と機械学習アルゴリズムの最適化を加えると,この戦略の効果はさらに向上する.
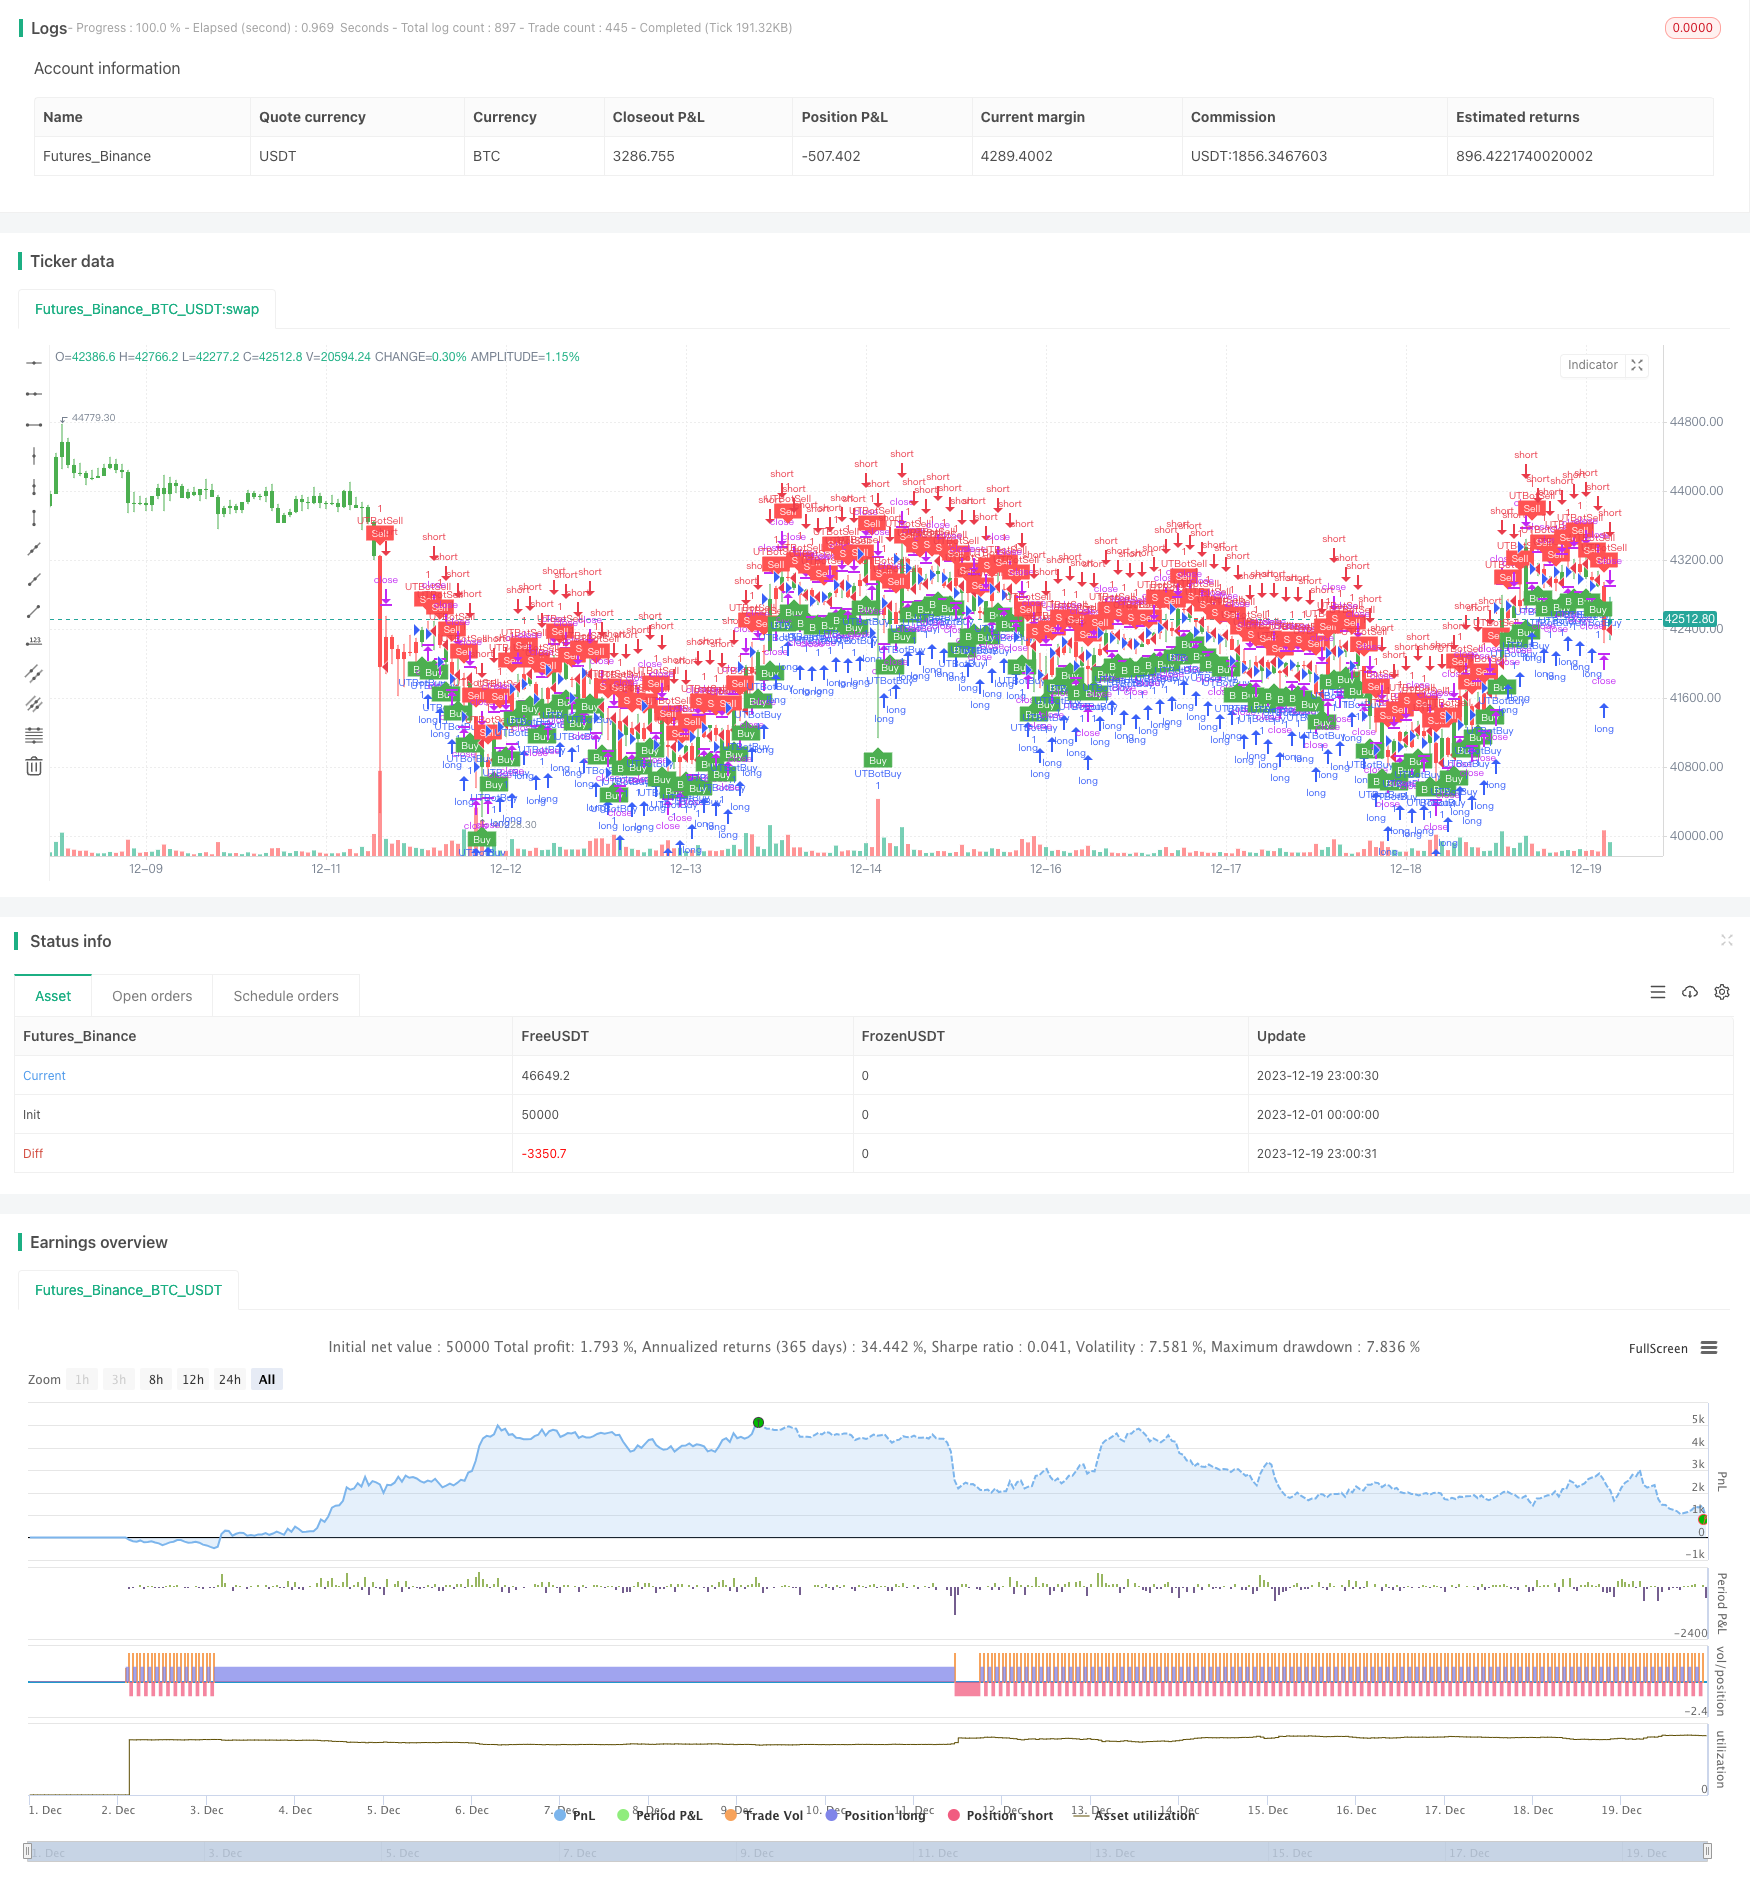
/*backtest
start: 2023-12-01 00:00:00
end: 2023-12-19 23:59:59
period: 1h
basePeriod: 15m
exchanges: [{"eid":"Futures_Binance","currency":"BTC_USDT"}]
*/

//@version=2
strategy(title="UTBot Strategy", overlay = true )

// CREDITS to @HPotter for the orginal code.
// CREDITS to @Yo_adriiiiaan for recently publishing the UT Bot study based on the original code -
// CREDITS to @TradersAITradingPlans for making this Strategy.
// Strategy fixed with Time period by Kirk65.
// I am using this UT bot with 2 hours time frame with god resultss. Alert with "Once per bar" and stoploss 1.5%. If Alerts triggered and price goes against Alert. Stoploss will catch it. Wait until next Alert.
// While @Yo_adriiiiaan mentions it works best on a 4-hour timeframe or above, witch is a lot less risky, but less profitable.

testStartYear = input(2019, "BACKTEST START YEAR", minval = 1980, maxval = 2222)
testStartMonth = input(01, "BACKTEST START MONTH", minval = 1, maxval = 12)
testStartDay = input(01, "BACKTEST START DAY", minval = 1, maxval = 31)
testPeriodStart = timestamp(testStartYear,testStartMonth,testStartDay,0,0)
testStopYear = input(2222, "BACKTEST STOP YEAR", minval=1980, maxval = 2222)
testStopMonth = input(12, "BACKTEST STOP MONTH", minval=1, maxval=12)
testStopDay = input(31, "BACKTEST STOP DAY", minval=1, maxval=31)
testPeriodStop = timestamp(testStopYear, testStopMonth, testStopDay, 0, 0)

testPeriod = true

SOURCE = input(hlc3)
RSILENGTH = input(14, title = "RSI LENGTH")
RSICENTERLINE = input(52, title = "RSI CENTER LINE")
MACDFASTLENGTH = input(7, title = "MACD FAST LENGTH")
MACDSLOWLENGTH = input(12, title = "MACD SLOW LENGTH")
MACDSIGNALSMOOTHING = input(12, title = "MACD SIGNAL SMOOTHING")
a = input(10, title = "Key Vaule. 'This changes the sensitivity'")
SmoothK = input(3)
SmoothD = input(3)
LengthRSI = input(14)
LengthStoch = input(14)
RSISource = input(close)
c = input(10, title="ATR Period")
xATR = atr(c)
nLoss = a * xATR
xATRTrailingStop = iff(close > nz(xATRTrailingStop[1], 0) and close[1] > nz(xATRTrailingStop[1], 0), max(nz(xATRTrailingStop[1]), close - nLoss),
     iff(close < nz(xATRTrailingStop[1], 0) and close[1] < nz(xATRTrailingStop[1], 0), min(nz(xATRTrailingStop[1]), close + nLoss),
     iff(close > nz(xATRTrailingStop[1], 0), close - nLoss, close + nLoss)))
pos =	iff(close[1] < nz(xATRTrailingStop[1], 0) and close > nz(xATRTrailingStop[1], 0), 1,
     iff(close[1] > nz(xATRTrailingStop[1], 0) and close < nz(xATRTrailingStop[1], 0), -1, nz(pos[1], 0)))
color = pos == -1 ? red: pos == 1 ? green : blue
ema= ema(close,1)
above = crossover(ema,xATRTrailingStop )
below = crossover(xATRTrailingStop,ema)
buy = close > xATRTrailingStop and above
sell = close < xATRTrailingStop and below
barbuy = close > xATRTrailingStop
barsell = close < xATRTrailingStop
plotshape(buy, title = "Buy", text = 'Buy', style = shape.labelup, location = location.belowbar, color= green,textcolor = white, transp = 0, size = size.tiny)
plotshape(sell, title = "Sell", text = 'Sell', style = shape.labeldown, location = location.abovebar, color= red,textcolor = white, transp = 0, size = size.tiny)
barcolor(barbuy? green:na)
barcolor(barsell? red:na)
//alertcondition(buy, title='Buy', message='Buy')
//alertcondition(sell, title='Sell', message='Sell')

if (buy)
    strategy.entry("UTBotBuy",strategy.long, when=testPeriod)
if (sell)
    strategy.entry("UTBotSell",strategy.short, when=testPeriod)