モメンタム移動平均クロスオーバー戦略
作成日:
2024-01-23 14:18:26
最終変更日:
2024-01-23 14:18:26
コピー:
1
クリック数:
605
1
フォロー
1750
フォロワー
概要
この戦略は,異なる周期のEMA平均線の交差を基にトレンドの方向を判断し,それに基づいて多空信号を構築する.主に2つの平均線,分別10日線と20日線を使用する. 10日線が上から下に20日線を横切るとき,空き; 10日線が上から上に20日線を横切るとき,多空する.この戦略は,中線ショート取引戦略の属である.
戦略原則
この戦略は,2つのEMA平均線を使用し,10日線と20日線を含む.EMA平均線は,価格の傾向の方向をよく反映します.短期EMA線が下から上に向かって長期EMA線を横切るとき,価格の動きが上昇から上昇することを示す,多信号であり,短期EMA線が上から下に向かって長期EMA線を横切るとき,価格の動きが上昇から減少することを示す,空白信号である.
この戦略は,波動の極小値と極大値を組み合わせて,取引信号の一部をフィルターします.価格の波動が一定の幅に達した後でのみ取引信号を発信します.これは,偽の信号の一部を一定程度にフィルターすることができます.
具体的には,この戦略は,価格の極限値と極限値の到達時間を追跡して,価格トレンドが形成されているかどうかを判断します. 極限値または極限値が一定の時間に達した後で,真の取引信号が送信されます.
戦略的優位分析
この戦略には以下の利点があります.
- EMA平均線を使ってトレンドの方向を判断し,市場動向を効果的に追跡できます.
- EMAの平均線を異なる周期と組み合わせることで,中短線で取引の機会を捉える
- 極限フィルタリングにより,部分的なノイズをフィルタリングして,取引の機会を逃さないようにします.
- 戦略の論理はシンプルで明快で,理解し,変更しやすい.
- 異なる品種と取引の好みに合わせてパラメータを調整できる,適応性強
戦略的リスク分析
この戦略にはいくつかのリスクがあります.
- EMA平均線は遅滞しており,短期的な価格逆転を逃す可能性があります.
- 雑音信号のフィルタリングが不完全で,取引の誤りがある可能性があります.
- 異なる市場環境に対応するためにパラメータを適切に調整する必要があります.
リスクは以下の方法で軽減できます.
- 他の指標と組み合わせた信号確認で,EMA平均線遅れの問題を回避
- 極限フィルタリング条件を最適化し,信号の信頼性を向上させる
- 回測結果に応じてパラメータを調整し,最適化戦略
戦略最適化の方向性
この戦略は,以下の方向からさらに最適化できます.
- 他の技術指標のポートフォリオを追加し,取引信号の正確性を向上させる.例えばMACD,KDなど.
- EMA平均線のパラメータを最適化し,特定の品種に適したものにしました.
- 価格の変動に関する判断を改善するために,最大最小のパラメータを最適化します.
- 単一取引の最大損失を制御するために,ストップ・ロスの戦略を追加します.
- この戦略を様々な品種でテストし,適性評価を行います.
要約する
EMA交差策略は,全体としてシンプルで実用的なトレンド追跡策略である. EMA平均線を使用して大トレンドの方向を判断し,価格変動フィルター信号と組み合わせて取引決定を形成する. この策略は,簡単に理解し,パラメータを調整し,中短線取引に適応することができます.
ストラテジーソースコード
/*backtest
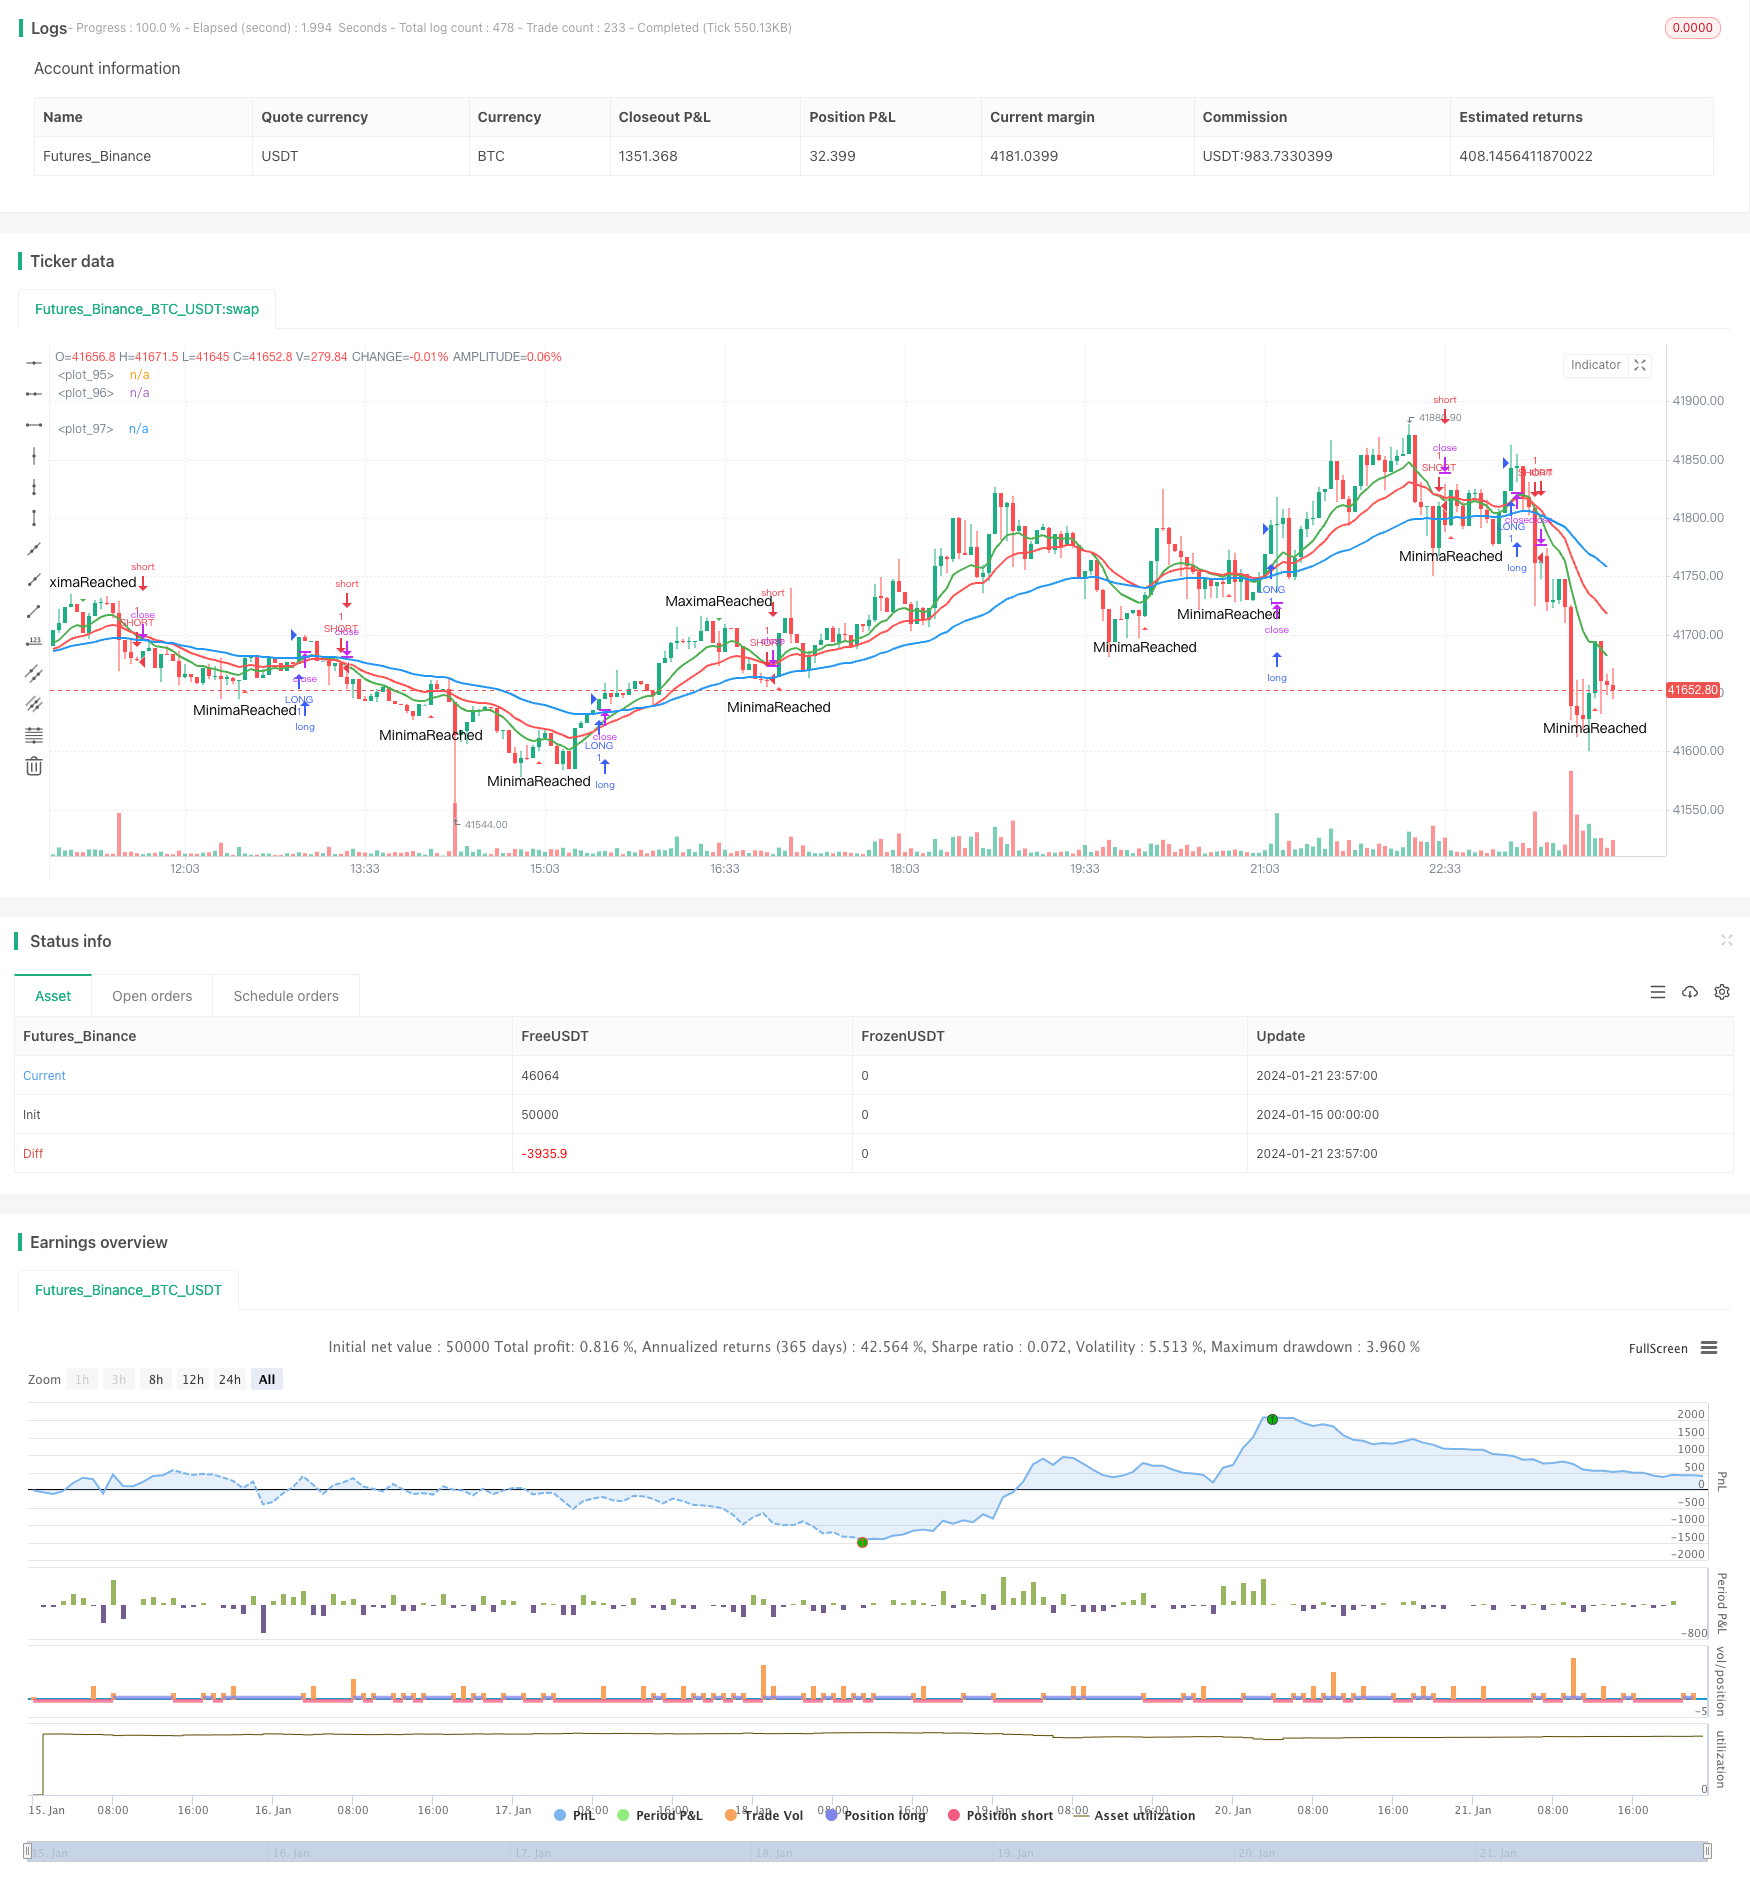
start: 2024-01-15 00:00:00
end: 2024-01-22 00:00:00
period: 3m
basePeriod: 1m
exchanges: [{"eid":"Futures_Binance","currency":"BTC_USDT"}]
*/
//@version=2
strategy("PierceMAStrat", overlay=true)
lenMA0 = input(title="Length 0",defval=2)
lenMA1=input(title="Length 1",defval=10)
lenMA2=input(title="Length 2", defval=20)
lenMA3 = input(title = "Length3", defval =50)
emaLen0 = ema(close, lenMA0)
emaLen1 = ema(close, lenMA1)
emaLen2 = ema(close, lenMA2)
emaLen3 = ema(close, lenMA3)
ascent = if emaLen1[1] < emaLen1[0]
true
else
false
descent = if emaLen1[1] > emaLen1[0]
true
else
false
TimeSinceAscensionStart = if ascent == true
barssince(descent == true)
else
0
StartUp = if TimeSinceAscensionStart < 1
true
else
false
StartDown = if TimeSinceAscensionStart < 1
false
else
true
AscentBarCounter = barssince(StartUp == true)
DescentBarCounter = barssince(StartDown == true)
MaxAscent = if AscentBarCounter[1] > AscentBarCounter[0] and AscentBarCounter[1] > 10
true
else
false
MaxDescent = if DescentBarCounter[1] > DescentBarCounter[0] and DescentBarCounter[1] > 5
true
else
false
longCond = if crossover(emaLen1, emaLen2) and barssince(MaxDescent == true) > 3
true
else
false
shortCond = if crossunder(emaLen1, emaLen2) and barssince(MaxAscent == true) > 3
true
else
false
//longCond = (crossover(emaLen1, emaLen2) and (emaLen2 > emaLen3))
//shortCond = crossunder(emaLen1, emaLen2) and (emaLen2 < emaLen3)
if longCond == true
strategy.entry("LONG", strategy.long)
if shortCond == true
strategy.entry("SHORT", strategy.short)
plotshape(series=MaxAscent, title="MaximaReached", style=shape.triangledown, location=location.abovebar, color=green, text="MaximaReached", size=size.small)
plotshape(series=MaxDescent, title="MinimaReached", style=shape.triangleup, location=location.belowbar, color=red, text="MinimaReached", size=size.small)
//plotshape(series=StartUp, title="StartUp", style=shape.triangleup, location=location.belowbar, color=red, text="StartUp", size=size.tiny)
//plotshape(series=StartDown, title="StartDown", style=shape.triangleup, location=location.belowbar, color=green, text="StartDown", size=size.tiny)
//plotshape(series=(crossover(emaLen1, emaLen3)), title="GBXOVER", style=shape.triangleup, location=location.belowbar, color=green, text="GBXO", size=size.small)
//plotshape(series=(crossover(emaLen2, emaLen3)), title="RBXOVER", style=shape.triangledown, location=location.abovebar, color=orange, text="RBXO", size=size.small)
//plotshape(series=(crossover(emaLen1, emaLen2)), title="GRXOVER", style=shape.triangledown, location=location.abovebar, color=teal, text="GRXO", size=size.small)
//plotshape(series=(crossunder(emaLen1, emaLen2)), title="GRXUNDER", style=shape.triangledown, location=location.abovebar, color=purple, text="GRXU", size=size.small)
//plotshape(series=(crossunder(emaLen1, emaLen3)), title="GBXOVER", style=shape.triangleup, location=location.belowbar, color=yellow, text="GBXU", size=size.small)
//plotshape(series=(crossunder(emaLen2, emaLen3)), title="RBXOVER", style=shape.triangledown, location=location.abovebar, color=yellow, text="RBXU", size=size.small)
//plotshape(convergence, color=lime, style=shape.arrowup, text="CROSS")
plot(emaLen1, color=green, transp=0, linewidth=2)
plot(emaLen2, color=red, transp=30, linewidth=2)
plot(emaLen3, color=blue, transp=30, linewidth=2)