EMAチャネルとMACDに基づく短期取引戦略
概要
この戦略は,EMAチャネルとMACDをベースにしたショートライン取引戦略と呼ばれる.これは,EMAチャネルとMACD指標を組み合わせてトレンドを識別し,取引信号を与える.
戦略原則
この戦略は,5日EMAと21日EMAを使ってEMAチャネルを形成する. 5日EMAが21日EMAを突破すると,トレードが多頭に入ると考えられ,5日EMAが21日EMAを突破すると,トレードが空頭に入ると考えられる. MACD指標の直線図は,偽の信号をフィルターするために使用することができる. MACD直線図が0より大きい場合にのみ,買入シグナルが送信される. MACD直線図が0より小さい場合にのみ,売り出シグナルが送信される.
優位分析
この戦略は,トレンド識別と指標フィルタリングを組み合わせて,ショートラインの動きの方向を効果的に識別できます.EMAチャネルを使用して,主要なトレンドの方向を判断し,MACD指標フィルタリングで偽の信号をフィルタリングすることで,利益の確率を大幅に高めることができます.固定された止損停止メカニズムはまた,利益のリスクと利益の比率を保証します.全体的に,この戦略はショートラインの取引に適しており,特に強い動力の株式や外貨品種では,より効果的です.
リスク分析
この戦略は,主に短線取引に適用され,長線と振動の状況下では効果が悪い.長線横軸の市場では,EMAチャネルの交差信号は頻繁だが,ほとんどが偽信号であり,この時点でMACD直線図は,ある種のフィルタリング作用をうけても,効果は依然として限られている.さらに,固定した止損制止機構は,長線トレンドがもたらす増益利益を掴むことを困難にする.だからこの戦略の主なリスクである.解決方法は,市場の状況に応じてパラメータを柔軟に調整するか,または現在の市場状況に適した他の戦略を改めることである.
最適化の方向
この戦略は以下の点で最適化できます.
- EMAのパラメータを最適化し,特定の取引品種の収益性を最大化するためのパラメータの組み合わせを探します.
- MACDのパラメータを最適化し,フィルタリングの効果を向上させる.
- 波動率指標と組み合わせて,市場の波動が大きくなると,ストップ範囲を拡大する.
- ストップ・トラッキングのメカニズムを導入し,ストップ・損失を価格に近いものにし,利潤を保証する前提で不必要なストップ・損失が引き起こす確率を減らす.
要約する
この戦略は,全体的に高収益性があり,特にショートライン取引に適しており,高周波取引を追求する量化取引戦略において良い選択である.しかし,取引者は,市場動向に応じて合理的にパラメータを調整して,戦略の収益を最大化すると同時に,取引リスクを制御するように注意してください.
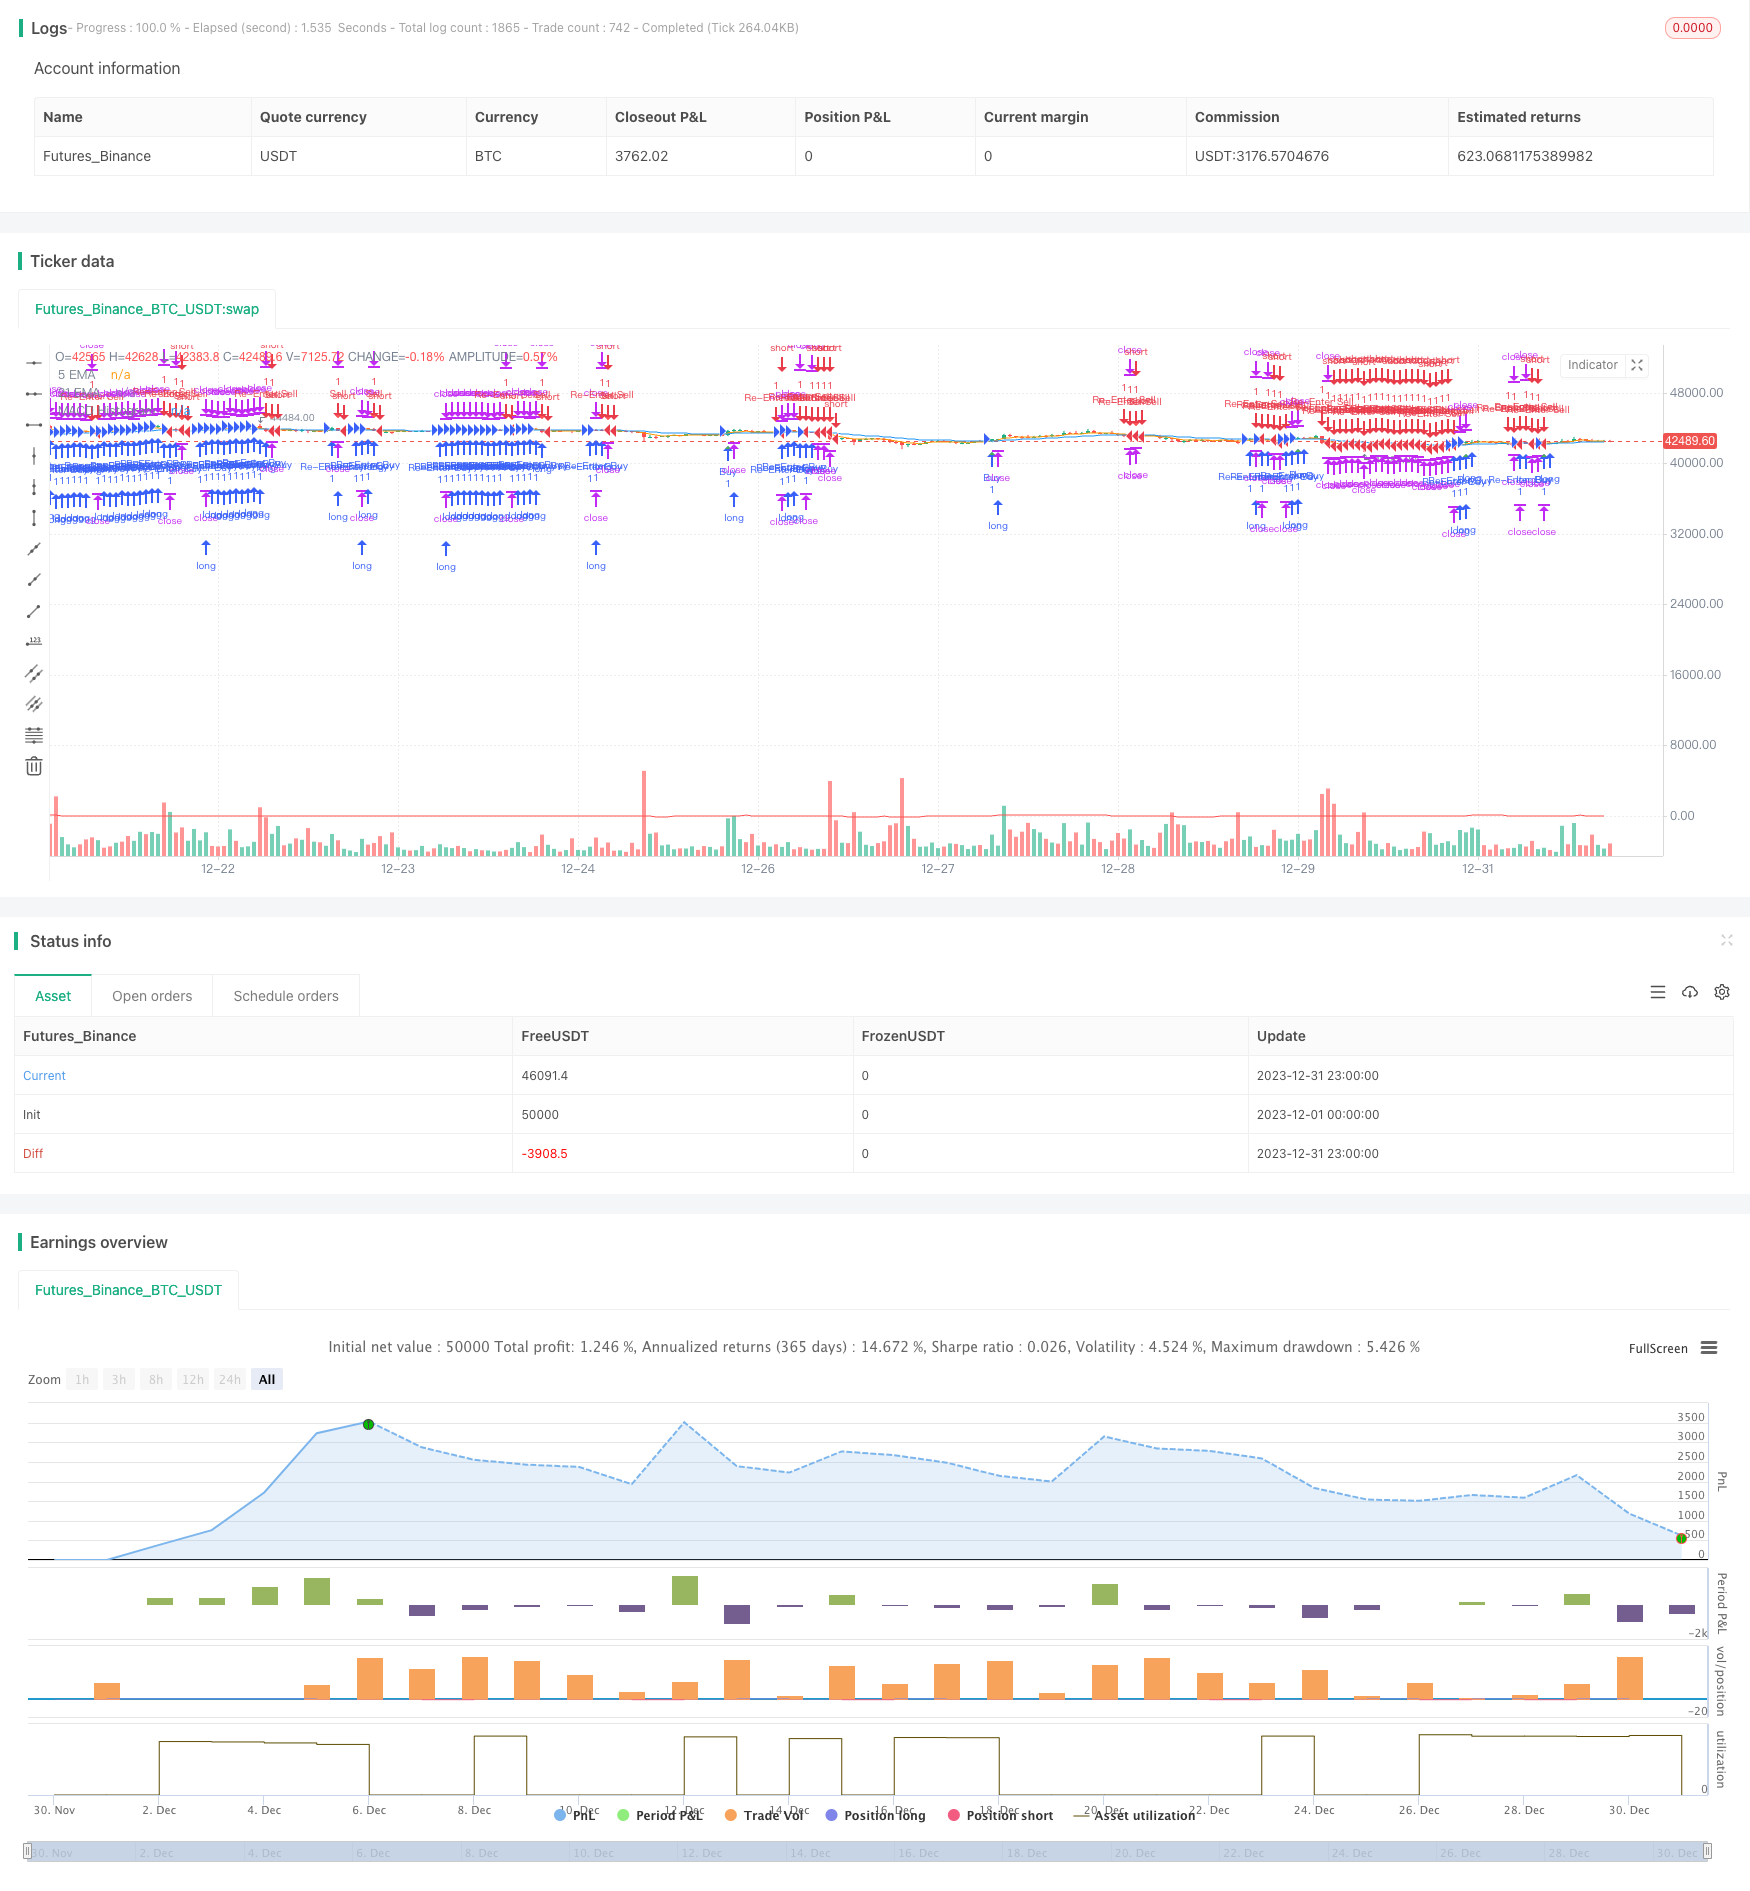
/*backtest
start: 2023-12-01 00:00:00
end: 2023-12-31 23:59:59
period: 1h
basePeriod: 15m
exchanges: [{"eid":"Futures_Binance","currency":"BTC_USDT"}]
*/

// This source code is subject to the terms of the Mozilla Public License 2.0 at https://mozilla.org/MPL/2.0/
// © moondevonyt

//@version=5
strategy("Scalping with EMA channel and MACD", overlay=true)

// Exponential moving average inputs
ema21 = ta.ema(close, 21)
ema5 = ta.ema(close, 5)

// MACD inputs
fastLength = 18
slowLength = 34
signalSmoothing = 12

[macdLine, signalLine, _] = ta.macd(close, fastLength, slowLength, signalSmoothing)
macdHistogram = macdLine - signalLine

// Buy and sell conditions
buyCondition = ta.crossover(ema5, ema21) and macdHistogram > 0
sellCondition = ta.crossunder(ema5, ema21) and macdHistogram < 0

// Re-entry conditions
reEntryBuyCondition = close > ema21
reEntrySellCondition = close < ema21

// Set stop loss and take profit
stopLoss = 8
takeProfit = 15

// Execute Strategy
if buyCondition
    strategy.entry("Buy", strategy.long)
    strategy.exit("Take Profit/Stop Loss", "Buy", stop=close - stopLoss, limit=close + takeProfit)
if reEntryBuyCondition
    strategy.entry("Re-Enter Buy", strategy.long)
    strategy.exit("Take Profit/Stop Loss", "Re-Enter Buy", stop=close - stopLoss, limit=close + takeProfit)

if sellCondition
    strategy.entry("Sell", strategy.short)
    strategy.exit("Take Profit/Stop Loss", "Sell", stop=close + stopLoss, limit=close - takeProfit)
if reEntrySellCondition
    strategy.entry("Re-Enter Sell", strategy.short)
    strategy.exit("Take Profit/Stop Loss", "Re-Enter Sell", stop=close + stopLoss, limit=close - takeProfit)

// Plotting EMAs and MACD
plot(ema21, color=color.blue, title="21 EMA")
plot(ema5, color=color.orange, title="5 EMA")
plot(macdHistogram, color=color.red, title="MACD Histogram")

// Plot buy and sell signals
plotshape(series=buyCondition, style=shape.triangleup, location=location.belowbar, color=color.green, size=size.small, title="Buy Signal")
plotshape(series=sellCondition, style=shape.triangledown, location=location.abovebar, color=color.red, size=size.small, title="Sell Signal")