二重移動平均トレンドフォロー戦略
概要
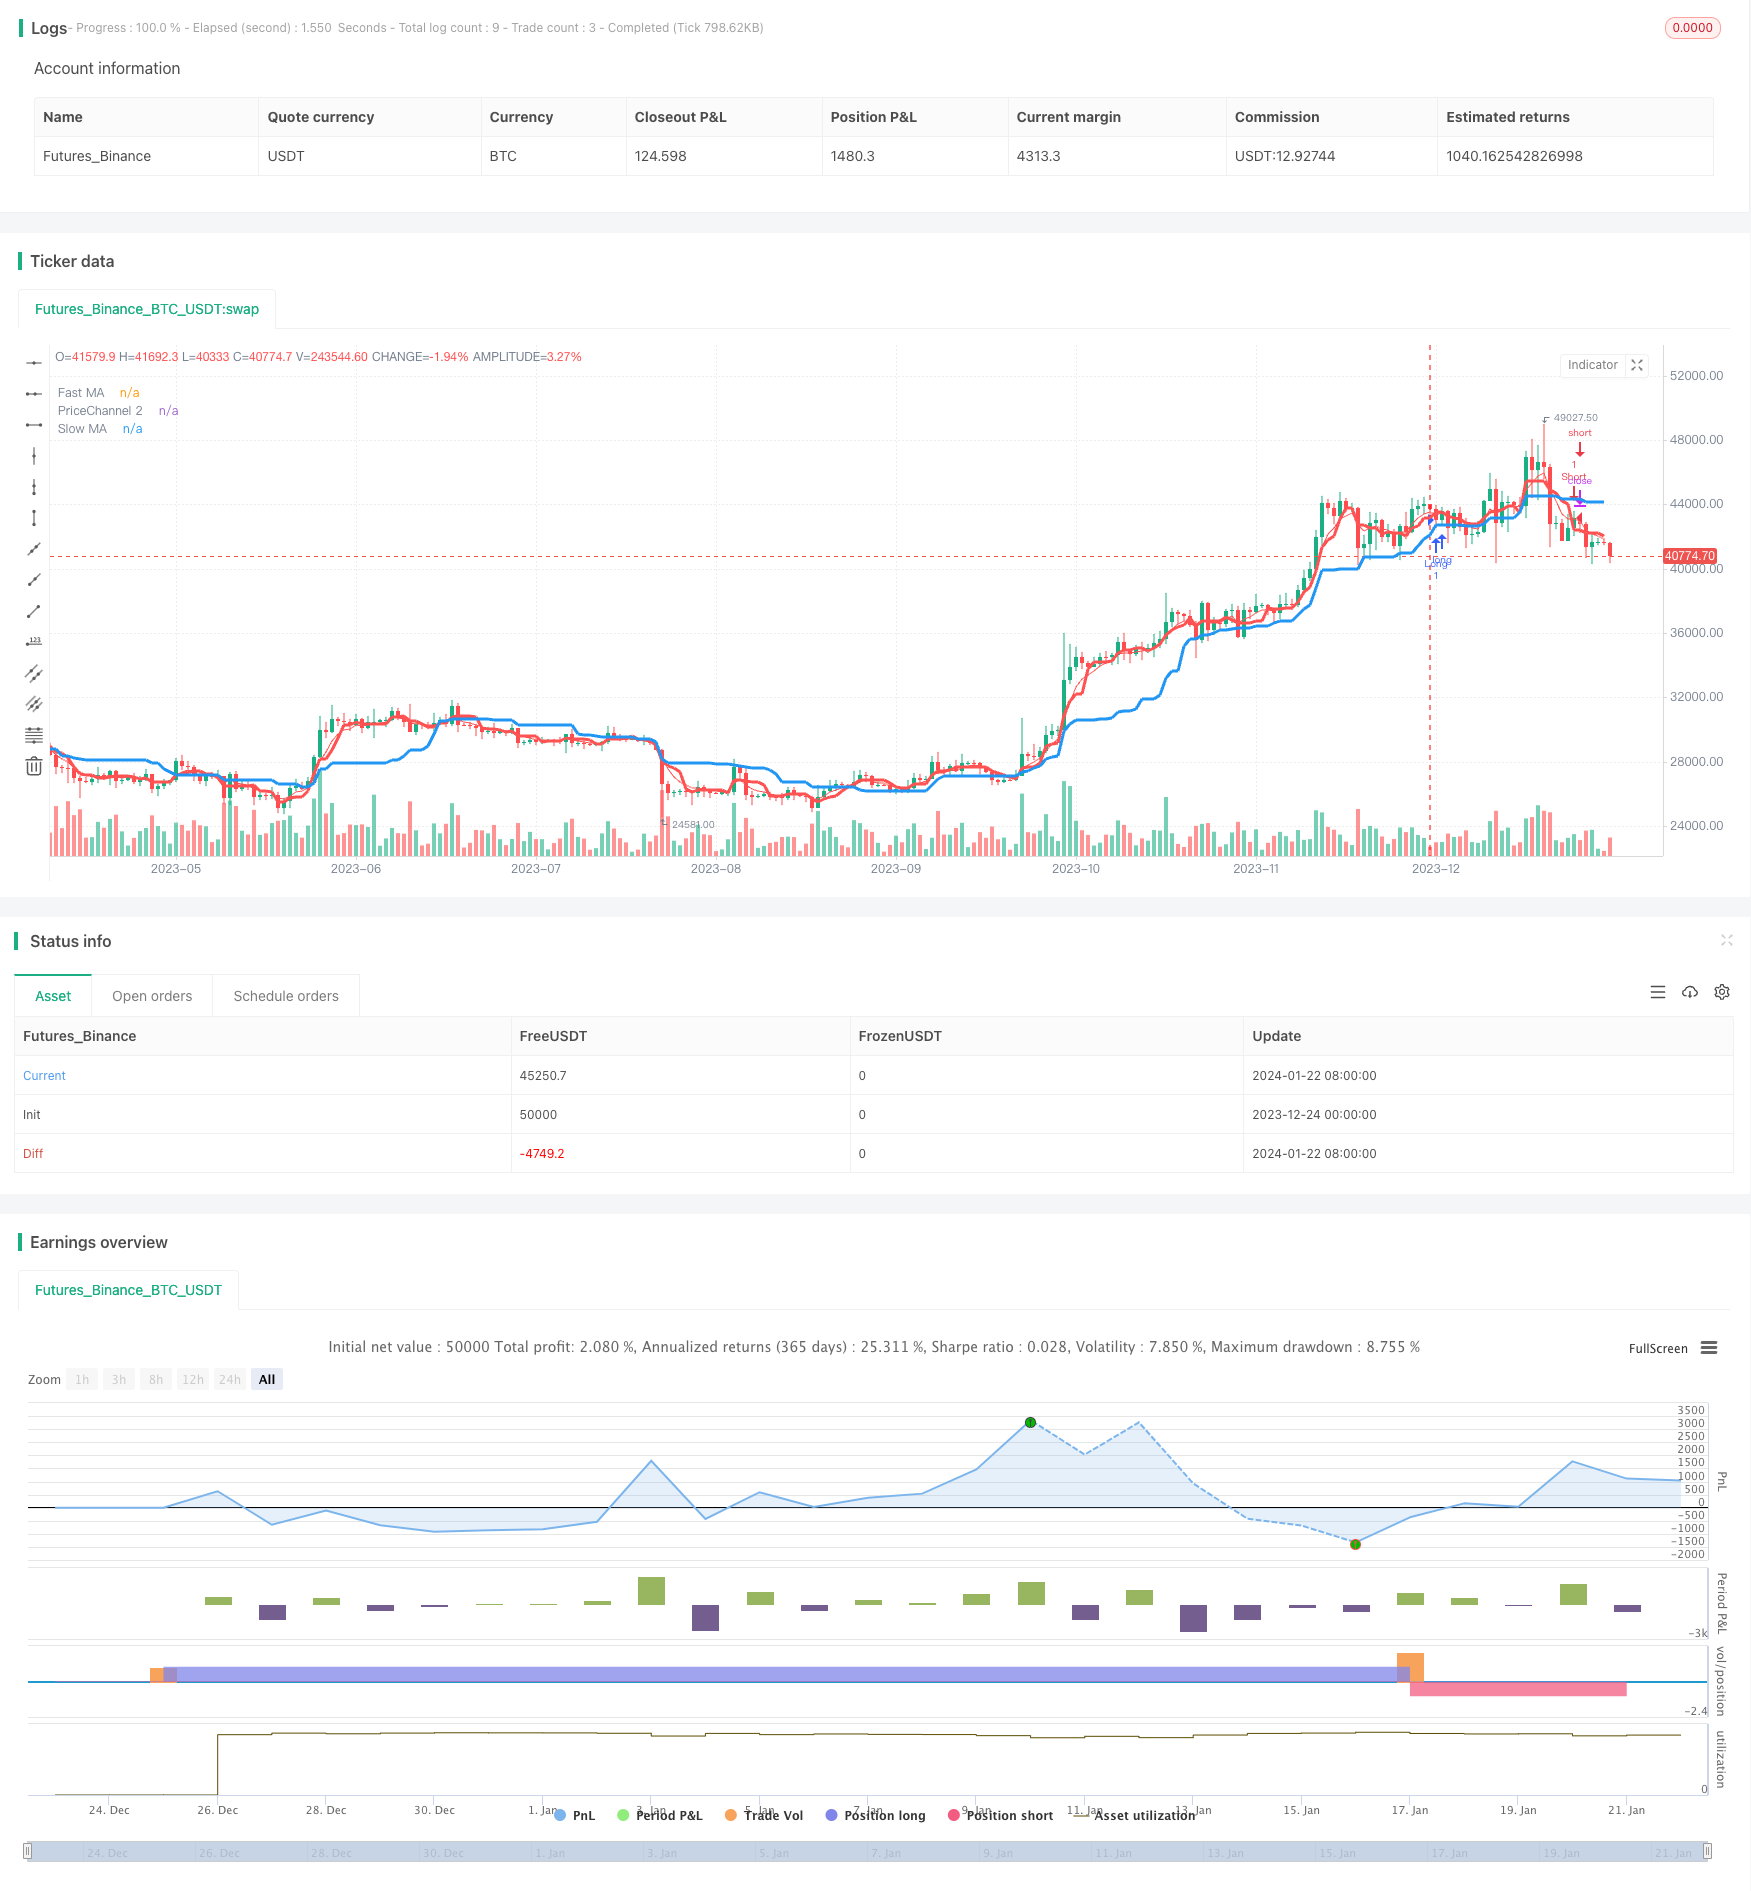
双均線トレンドトラッキング戦略は,急速移動平均と遅い移動平均の組み合わせを使用して市場のトレンドを判断し,トレンド方向の転換時に取引信号を発する戦略である. この戦略は,均線指標と価格チャネル指標を同時に組み合わせてトレンドを識別し,市場のノイズを効果的にフィルターしてトレンド方向を判断することができる.
戦略原則
双均線トレンド追跡戦略は,2つの移動平均指標である急速移動平均 ((5サイクル) と遅い移動平均 ((21サイクル) を使用する. 急速平均は取引信号を生成するために使用され,遅い平均は市場のトレンド方向を判断するために使用されます. 急速平均は,下から上へとゆっくりとした平均を横断すると,購入信号を生成します. 急速平均は,上から下へとゆっくりとした平均を横断すると,売り信号を生成します.
この策略は,価格チャネル指標を用い,同時にトレンドを判断する.価格チャネルは,最高価格と最低価格の移動平均によって決定される.価格がチャネルを突破すると,トレンドが逆転することを意味する.この策略は,2つの価格チャネルを使用し,最初の価格チャネル周期は21で,第2の価格チャネル周期は5で,平均線周期と一致する.
買入と売却の信号を判断する際に,この戦略は,赤柱が連続して出現することを要求し (ユーザが設定できる柱の数),追加のフィルタリング条件として.これは,整合区域で誤った信号を発出することを避けることができる.
概して,トレンドを判断する双対均線戦略の論理は,
- 価格チャネルを使って,大レベルのトレンドの方向を判断する
- 短期トレンドを判断し,取引シグナルを発信する.
- 追加された柱状フィルターと組み合わせて,整合時に誤信号を避ける
複数のレベルでのトレンド判断により,ノイズを効果的にフィルターし,トレンドの方向を決定できます.
優位分析
双線均等トレンド追跡戦略の利点は以下の通りです.
- 双対対のシステムを利用して,トレンドを効果的に識別し,主要トレンドの方向を判断できます.
- 急速平均線はトレンドの逆転を把握するための取引信号を発信します.
- 短期市場の騒音に惑わされないように,価格チャネルで大規模なトレンドを判断する
- 赤/緑の柱のフィルタリング条件は,整合区域で誤信号を発する確率を減らす
- 戦略パラメータは,異なる市場に対応してパラメータを調整して,戦略の安定性を向上させることができます
- ストップ・ロスの追加策により,各取引のリスクを効果的にコントロールできます.
全体的に見ると,この戦略は全体的に安定性があり,大きなトレンドの市場では優れている.
リスク分析
双線式トレンド追跡戦略にはいくつかのリスクがあります.
- 市場が長期にわたって収束するとき,誤ったシグナルが生じやすいため,小額の損失が連続して発生する可能性があります.
- 策略パラメータの設定が不適切で,取引シグナルが遅れ,最適な入場時間を逃す可能性があります.
- 効果的なストップ・ロスの策略がないと,単一取引のリスクはコントロールできない
戦略的リスクは以下のような方法で軽減できます.
- 赤/緑の柱のフィルタリング条件を調整し,整合市場での取引頻度を低下させる
- 迅速な平均線パラメータを最適化し,取引シグナルをタイムリーに確保する
- 移動ストップまたはパーセンテージストップの策略を追加し,単一損失を厳格に制御します.
最適化の方向
双対対のトレンドトラッキング戦略は,次の方向でさらに最適化できる.
- ATRのような波動率指標と組み合わせて,自動でストップ幅を調整する
- 機械学習による戦略パラメータの自動最適化
- ニューロンのネットワークがトレンドの方向を判断するモジュール
- 複数の指標とフィルタリング条件を統合し,戦略の組み合わせを構築する
これらの最適化方向は,戦略の安定性,適応性,および知性レベルをさらに高めることができます.
要約する
双均線トレンドフォロー戦略は,全体としてより堅牢なトレンドフォロー戦略である.それは,均線指標と価格チャネルを組み合わせてトレンドの方向と強さを判断し,迅速な均線で取引信号を発信する.追加の柱状フィルター条件は,誤った信号をさらに回避することができます.この戦略のパラメータは,調整可能であり,異なる市場環境にうまく適応することができます.同時に,大きな最適化余地があり,信頼性の高いスマートな自動取引戦略を生み出す可能性があります.
/*backtest
start: 2023-12-24 00:00:00
end: 2024-01-23 00:00:00
period: 1d
basePeriod: 1h
exchanges: [{"eid":"Futures_Binance","currency":"BTC_USDT"}]
*/

//@version=2
strategy(title = "Noro's Trend MAs Strategy v1.8", shorttitle = "Trend MAs str 1.8", overlay=true, default_qty_type = strategy.percent_of_equity, default_qty_value=100.0, pyramiding=0)

//Settings
needlong = input(true, "long")
needshort = input(true, "short")
needstops = input(false, "stops")
stoppercent = input(5, defval = 5, minval = 1, maxval = 50, title = "Stop, %")
useohlc4 = input(false, defval = false, title = "Use OHLC4")
usefastsma = input(true, "Use fast MA Filter")
fastlen = input(5, defval = 5, minval = 1, maxval = 50, title = "fast MA Period")
slowlen = input(21, defval = 20, minval = 2, maxval = 200, title = "slow MA Period")
bars = input(2, defval = 2, minval = 0, maxval = 3, title = "Bars Q")
needbg = input(false, defval = false, title = "Need trend Background?")
needarr = input(false, defval = false, title = "Need entry arrows?")

src = useohlc4 == true ? ohlc4 : close
fastsma = ema(src, 5)

//PriceChannel 1
lasthigh = highest(src, slowlen)
lastlow = lowest(src, slowlen)
center = (lasthigh + lastlow) / 2

//PriceChannel 2
lasthigh2 = highest(src, fastlen)
lastlow2 = lowest(src, fastlen)
center2 = (lasthigh2 + lastlow2) / 2

//Trend
//ma = type == 1 ? sma(src, len) : type == 2 ? ema(src, len) : type == 3 ? vwma(src, len) : type == 4 ? dema : type == 5 ? tema : type == 6 ? kama : type == 7 ? center : 0
//trend = low > ma and low[1] > ma[1] and low[2] > ma[2] ? 1 : high < ma and high[1] < ma[1] ? -1 : trend[1]

trend1 = low > center and low[1] > center[1] ? 1 : high < center and high[1] < center[1] ? -1 : trend1[1]
trend2 = low > center2 and low[1] > center2[1] ? 1 : high < center2 and high[1] < center2[1] ? -1 : trend1[1]
trend = trend1 == 1 and trend2 == 1 ? 1 : trend2 == -1 and trend2 == -1 ? -1 : trend[1]

//Bars
bar = close > open ? 1 : close < open ? -1 : 0
redbars = bars == 0 ? 1 : bars == 1 and bar == -1 ? 1 : bars == 2 and bar == -1 and bar[1] == -1 ? 1 : bars == 3 and bar == -1 and bar[1] == -1 and bar[2] == -1 ? 1 : 0
greenbars = bars == 0 ? 1 : bars == 1 and bar == 1 ? 1 : bars == 2 and bar == 1 and bar[1] == 1 ? 1 : bars == 3 and bar == 1 and bar[1] == 1 and bar[2] == 1 ? 1 : 0

//Signals
up = trend == 1 and (low < center2 or usefastsma == false) and (redbars == 1) ? 1 : 0
dn = trend == -1 and (high > center2 or usefastsma == false) and (greenbars == 1) ? 1 : 0

//Lines
colorfastsma = usefastsma == true ? red : na
plot(fastsma, color = colorfastsma, title = "Fast MA")
plot(center, color = blue, linewidth = 3, transp = 0, title = "Slow MA")
plot(center2, color = red, linewidth = 3, transp = 0, title = "PriceChannel 2")

//Arrows
plotarrow(up == 1 and needarr == true ? 1 : 0, colorup = black, colordown = black, transp = 0)
plotarrow(dn == 1 and needarr == true ? -1 : 0, colorup = black, colordown = black, transp = 0)

//Background
col = needbg == false ? na : trend == 1 ? lime : red
bgcolor(col, transp = 90)

//Alerts
alertcondition(up == 1, title='buy', message='Uptrend')
alertcondition(dn == 1, title='sell', message='Downtrend')

//Trading
stoplong = up == 1 and needstops == true ? close - (close / 100 * stoppercent) : stoplong[1]
stopshort = dn == 1 and needstops == true ? close + (close / 100 * stoppercent) : stopshort[1]

longCondition = up == 1
if (longCondition)
    strategy.entry("Long", strategy.long, needlong == false ? 0 : na)
    strategy.exit("Stop Long", "Long", stop = stoplong)

shortCondition = dn == 1
if (shortCondition)
    strategy.entry("Short", strategy.short, needshort == false ? 0 : na)
    strategy.exit("Stop Short", "Short", stop = stopshort)