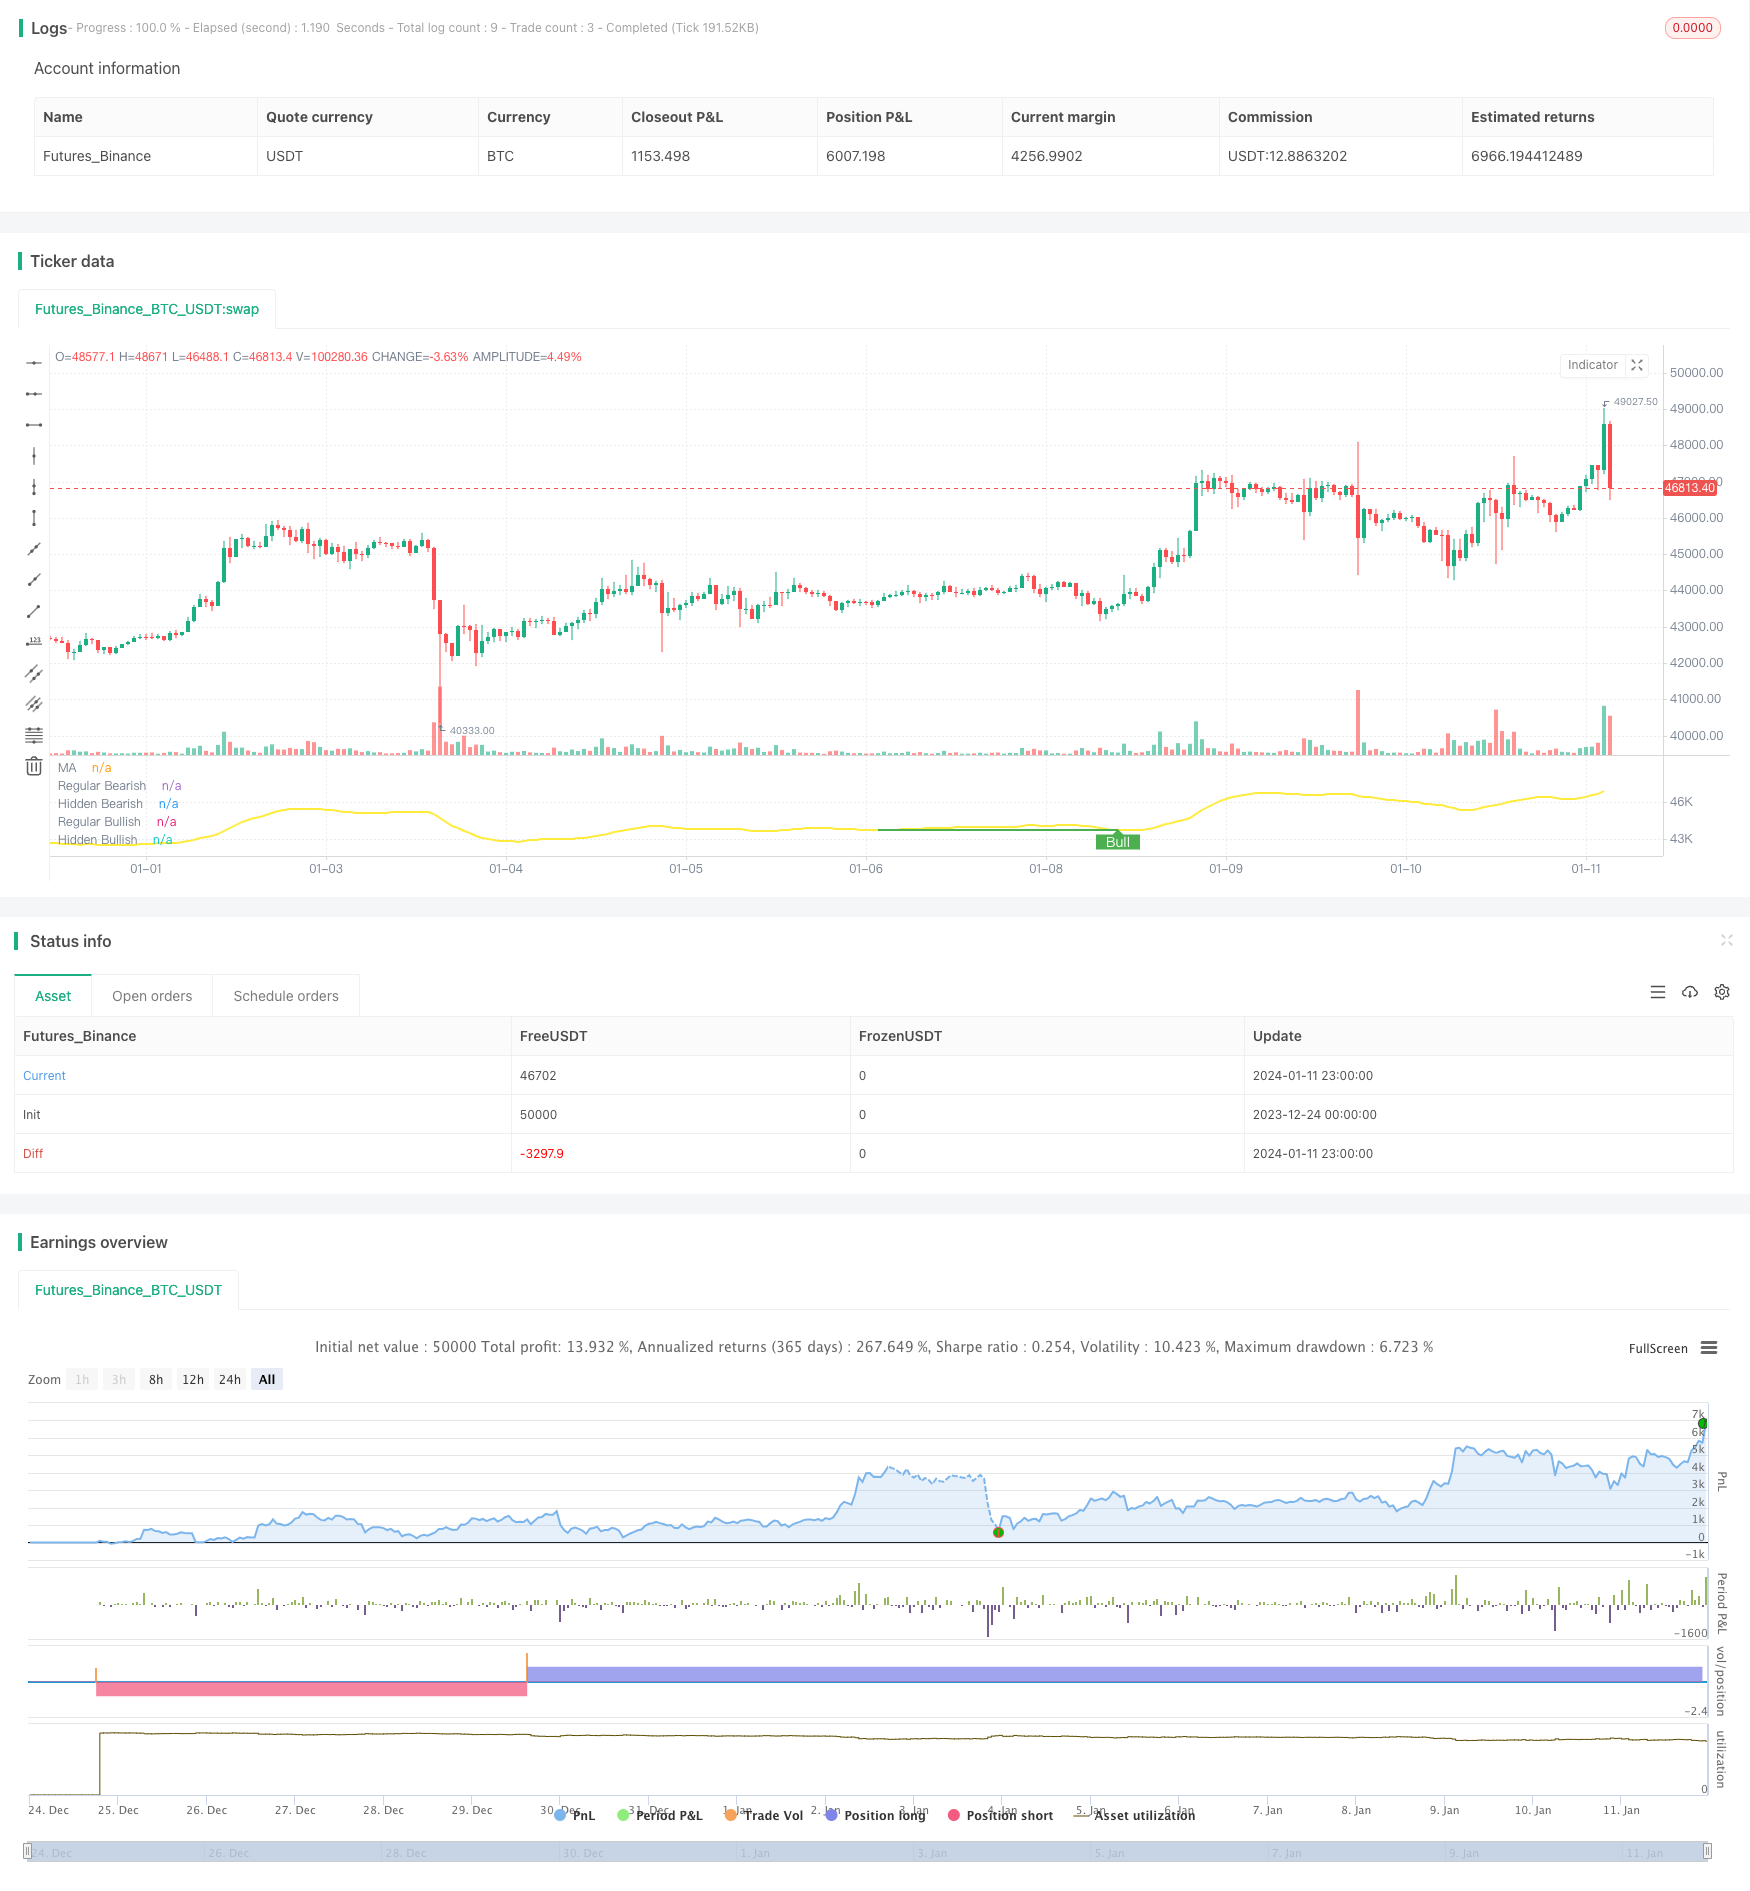
移動平均に基づくダイバージェンス戦略
作成日:
2024-01-24 11:43:41
最終変更日:
2024-01-24 11:43:41
コピー:
1
クリック数:
732
1
フォロー
1664
フォロワー

概要
この戦略は,移動平均とその枢軸点を計算し,価格と移動平均の間の偏差を発見し,購入と販売の信号として使用する.それは,偏差を見つけるために,任意の振動指数に適用することができます.これは,反測と实体取引に使用できる貴重なツールです.
戦略原則
- 移動平均をLenの長さとして計算する (MA)
- MAの枢軸低点 ((PL) と枢軸高点 ((PH) を検出する
- 正向偏差があるかどうかを判断する:価格が創新低点でMAが創新低点でないか,価格が創新低点でMAが創新低点でないか
- 逆偏差があるかどうかを判断する:価格創新高点でMAが創新高点でないか,価格創新高点でMAが創新高点でないか
- 買ったり売ったりするのは 状況から離れているからです
優位分析
- 価格とMAの誤差を自動で検出し,人工判断の誤差を回避します.
- 任意の振動指標に適用可能,拡張性強
- 戦略の収益性を裏付けるために使用できます.
- 設定可能なパラメータは,誤信号を避けるために,感度を調整する
- 異なるタイプを用意し,正確で包括的な判断を可能にします.
リスク分析
- 振動指数が正しく設定されていない場合,大量の誤信号が生成される可能性があります.
- 発生前に有効な枢軸点から離れ,信号不足が発生する可能性があります.
- 感度とフィルタリング誤差のバランスを取るためにパラメータを適切に調整する
- 他の要素と組み合わせた方が有効で,単独では信頼性が低い.
最適化の方向
- 移動平均のパラメータを最適化して,最適なパラメータの組み合わせを探します.
- 量価指標などの他の指標と組み合わせて誤信号を避ける
- 機械学習モデルの追加は 信頼性から離れている
- リスク管理の強化と単一損失の抑制
要約する
この戦略は,価格と移動平均との間の偏差を取引信号として発見することによって,判断を自動化し,主観的な誤りを回避できます.任意の振動指標に広く適用でき,強力な拡張性があります.パラメータ最適化と他の指標の組み合わせで使用され,取引信号の信頼性とシステムの安定性を大幅に向上させることができます.
ストラテジーソースコード
/*backtest
start: 2023-12-24 00:00:00
end: 2024-01-12 00:00:00
period: 1h
basePeriod: 15m
exchanges: [{"eid":"Futures_Binance","currency":"BTC_USDT"}]
*/

// This source code is subject to the terms of the Mozilla Public License 2.0 at https://mozilla.org/MPL/2.0/
// © tista
//https://www.tradingview.com/u/tista/#published-scripts

//@version=4

strategy(title="MA Divergences", format=format.price)

//* Backtesting Period Selector | Component *//
//* https://www.tradingview.com/script/eCC1cvxQ-Backtesting-Period-Selector-Component *//
//* https://www.tradingview.com/u/pbergden/ *//
//* Modifications made *//
testStartYear = input(2021, "Backtest Start Year")
testStartMonth = input(1, "Backtest Start Month")
testStartDay = input(1, "Backtest Start Day")
testPeriodStart = timestamp(testStartYear,testStartMonth,testStartDay,0,0)

testStopYear = input(999999, "Backtest Stop Year")
testStopMonth = input(9, "Backtest Stop Month")
testStopDay = input(26, "Backtest Stop Day")
testPeriodStop = timestamp(testStopYear,testStopMonth,testStopDay,0,0)

testPeriod() => true
/////////////// END - Backtesting Period Selector | Component ///////////////
len = input(title="MA Period", minval=1, defval=14)
src = input(title="MA Source", defval=close)
lbR = input(title="Pivot Lookback Right", defval=5)
lbL = input(title="Pivot Lookback Left", defval=5)
rangeUpper = input(title="Max of Lookback Range", defval=600)
rangeLower = input(title="Min of Lookback Range", defval=2)
plotBull = input(title="Plot Bullish", defval=true)
plotHiddenBull = input(title="Plot Hidden Bullish", defval=true)
plotBear = input(title="Plot Bearish", defval=true)
plotHiddenBear = input(title="Plot Hidden Bearish", defval=true)

bearColor = color.red
bullColor = color.green
hiddenBullColor = color.green
hiddenBearColor = color.red
textColor = color.white
noneColor = color.new(color.white, 100)

osc = wma(src, len)

plot(osc, title="MA", linewidth=2, color=color.yellow)

plFound = na(pivotlow(osc, lbL, lbR)) ? false : true
phFound = na(pivothigh(osc, lbL, lbR)) ? false : true

_inRange(cond) =>
    bars = barssince(cond == true)
    rangeLower <= bars and bars <= rangeUpper

alertcondition(osc[1] > 100.0 and osc[2] < 100.0, title="MA value crosses over 100.0", message="Check charts for a MA cross over 100.0")
alertcondition(osc[1] < 100.0 and osc[2] > 100.0, title="MA value crosses under 100.0", message="Check charts for a MA cross under 100.0")
alertcondition(osc[1] > -100. and osc[2] < -100.0, title="MA value crosses over -100.0", message="Check charts for a MA cross over -100.0")
alertcondition(osc[1] < -100.0 and osc[2] > -100.0, title="MA value crosses under -100.0", message="Check charts for a MA cross under -100.0")

//------------------------------------------------------------------------------
// Regular Bullish

// Osc: Higher Low
oscHL = osc[lbR] > valuewhen(plFound, osc[lbR], 1) and _inRange(plFound[1])

// Price: Lower Low
priceLL = low[lbR] < valuewhen(plFound, low[lbR], 1)

bullCond = plotBull and priceLL and oscHL and plFound

plot(
	 plFound ? osc[lbR] : na,
	 offset=-lbR,
	 title="Regular Bullish",
	 linewidth=2,
	 color=(bullCond ? bullColor : noneColor),
	 transp=0
	 )

plotshape(
	 bullCond ? osc[lbR] : na,
	 offset=-lbR,
	 title="Regular Bullish Label",
	 text=" Bull ",
	 style=shape.labelup,
	 location=location.absolute,
	 color=bullColor,
	 textcolor=textColor,
	 transp=0
	 )

alertcondition(bullCond, title="Regular bullish divergence in MA found", message="Check charts for a regular bullish divergence found with MA")

//------------------------------------------------------------------------------
// Hidden Bullish

// Osc: Lower Low
oscLL = osc[lbR] < valuewhen(plFound, osc[lbR], 1) and _inRange(plFound[1])

// Price: Higher Low
priceHL = low[lbR] > valuewhen(plFound, low[lbR], 1)

hiddenBullCond = plotHiddenBull and priceHL and oscLL and plFound

plot(
	 plFound ? osc[lbR] : na,
	 offset=-lbR,
	 title="Hidden Bullish",
	 linewidth=2,
	 color=(hiddenBullCond ? hiddenBullColor : noneColor),
	 transp=0
	 )

plotshape(
	 hiddenBullCond ? osc[lbR] : na,
	 offset=-lbR,
	 title="Hidden Bullish Label",
	 text=" H Bull ",
	 style=shape.labelup,
	 location=location.absolute,
	 color=bullColor,
	 textcolor=textColor,
	 transp=0
	 )

alertcondition(hiddenBullCond, title="Hidden bullish divergence in MA found", message="Check charts for a hidden bullish divergence found with MA")

//------------------------------------------------------------------------------
// Regular Bearish

// Osc: Lower High
oscLH = osc[lbR] < valuewhen(phFound, osc[lbR], 1) and _inRange(phFound[1])

// Price: Higher High
priceHH = high[lbR] > valuewhen(phFound, high[lbR], 1)

bearCond = plotBear and priceHH and oscLH and phFound

plot(
	 phFound ? osc[lbR] : na,
	 offset=-lbR,
	 title="Regular Bearish",
	 linewidth=2,
	 color=(bearCond ? bearColor : noneColor),
	 transp=0
	 )

plotshape(
	 bearCond ? osc[lbR] : na,
	 offset=-lbR,
	 title="Regular Bearish Label",
	 text=" Bear ",
	 style=shape.labeldown,
	 location=location.absolute,
	 color=bearColor,
	 textcolor=textColor,
	 transp=0
	 )

alertcondition(bearCond, title="Regular bearish divergence in MA found", message="Check charts for a regular bearish divergence found with MA")

//------------------------------------------------------------------------------
// Hidden Bearish

// Osc: Higher High
oscHH = osc[lbR] > valuewhen(phFound, osc[lbR], 1) and _inRange(phFound[1])

// Price: Lower High
priceLH = high[lbR] < valuewhen(phFound, high[lbR], 1)

hiddenBearCond = plotHiddenBear and priceLH and oscHH and phFound

plot(
	 phFound ? osc[lbR] : na,
	 offset=-lbR,
	 title="Hidden Bearish",
	 linewidth=2,
	 color=(hiddenBearCond ? hiddenBearColor : noneColor),
	 transp=0
	 )

plotshape(
	 hiddenBearCond ? osc[lbR] : na,
	 offset=-lbR,
	 title="Hidden Bearish Label",
	 text=" H Bear ",
	 style=shape.labeldown,
	 location=location.absolute,
	 color=bearColor,
	 textcolor=textColor,
	 transp=0
	 )

// Alerts
//alertcondition(bearCond or hiddenBearCond, title='Bear div', message='Bear div')
//alertcondition(bullCond or hiddenBullCond, title='Bull div', message='Bull div')
//alertcondition(bearCond or bullCond, title='Bull or beal div', message='Bull or bear div')
//alertcondition(hiddenBearCond or hiddenBullCond, title='Bull or beal div', message='Hidden Bull or bear div')
//alertcondition(hiddenBearCond or hiddenBullCond or bearCond or bullCond, title='Bull or beal div', message='Any Bull or bear div')

if testPeriod()
    if bullCond or hiddenBullCond
        strategy.entry("Buy", strategy.long)
    if bearCond or hiddenBearCond
        strategy.entry("Sell", strategy.short)