双方向クロスゼロ軸 Qstick インジケーターバックテスト戦略
概要
双方向交差ゼロ軸Qstick指標反測策略は,Tushar Chandeが開発したQstick技術指標に基づくトレンド追跡と取引信号生成策である.この策略は,株式の開値と閉値の移動平均差を計算することによって,市場の買取圧力と売り圧力を判断し,その差値が指標の交差ゼロ軸に交差すると取引信号を生成する.
戦略原則
双方向交差ゼロ軸Qstick戦略の核心指標はQstickである.Qstick指標は,特定の周期における閉盘価格と開盤価格の差値の移動平均を計算することによって得られる.Qstickが0より大きいときは,その周期における閉盘価格が全体的に開盤価格より高く,多頭力が優位であることを示す.Qstickが0より小さいときは,その周期における開盤価格が全体的に閉盘価格より高く,空頭力が優位であることを示す.
この戦略の取引シグナルは,Qstick指標がゼロ軸を通過する時に発生する.Qstickがゼロ軸を下から通過するときに買取シグナルが生じ,これは買取圧力が売り出圧よりも高くなっていることを示すため,多頭ポジションを確立することができる.逆に,Qstickがゼロ軸を上から通過するときに売り出圧力が増加し,清算が必要であることを示すために売り出圧信号が生じる.さらに,この戦略は,Qstick値の移動平均線をシグナルラインとして描くこともできる.Qstick指標がシグナルラインを横切る時,取引シグナルが生まれる.
この戦略は,反転取引の選択を許します。つまり,買い信号が生じるべき時,実際に売る操作をすること;買い信号が生じるべき時,実際に買う操作をすること。これは,市場イデオロギーに従うメインストリームの投資家に反転するために使用できます。
優位分析
双方向交差ゼロ軸Qstick戦略には以下の利点がある.
- シンプルで直感的な指標を使用して,市場での買取・販売圧力を判断し,信号は明確に生成されます.
- 移動平均差値指標を用いて,市場騒音を効果的に排除する
- 誤信号を回避するために信号線を描画できます
- 主流投資家を追跡するための反転取引をサポートします.
- 異なる株と市場環境に対応するカスタマイズ可能なパラメータ
リスク分析
Qstickの戦略にはいくつかのリスクがあります.
- Qstickの指標はトレンドの転換点を認識するのに遅れており,ベストエントリーポイントを逃している可能性があります.
- 信号が頻繁で取引コストが高くなる
- 逆転取引はリスクがあり,慎重に扱わなければなりません.
リスクは以下の方法で軽減できます.
- Qstick周期パラメータを最適化して,指標の遅延を減らす
- 信号線周期パラメータを拡大して誤信号を減らす
- 特定の段階での反転取引のみを行い,ポジションの規模を制御する
最適化の方向
双方向交差ゼロ軸Qstick戦略は,以下のいくつかの点で最適化できます.
- 取引量指標,波動率指標などの他の指標のフィルター信号と組み合わせて,非トレンド環境で誤信号を避ける
- 損失の一定比率に達したときに止まる.
- Qstickとシグナルライン周期パラメータの最適な組み合わせを決定するさらなる研究
- 機械学習による最適パラメータの自動決定
- 特定の業界や株で戦略の効果をテストする
要約する
双方向交差ゼロ軸Qstick戦略は,簡単な指標を使用して,買賣圧力の変化を判断し,Qstick指標が交差ゼロ軸を交差するときに取引信号を生成し,価格トレンドを効果的に捉えることができる.この戦略は,直観的に分かりやすい,初心者のために適しています.また,複数の手段によって最適化され,高度なトレーダーのニーズに適応することができます.しかし,この戦略には一定の欠陥があり,慎重に使用する必要があります.全体的に,これは非常に実用的なトレンド追跡と信号生成戦略です.
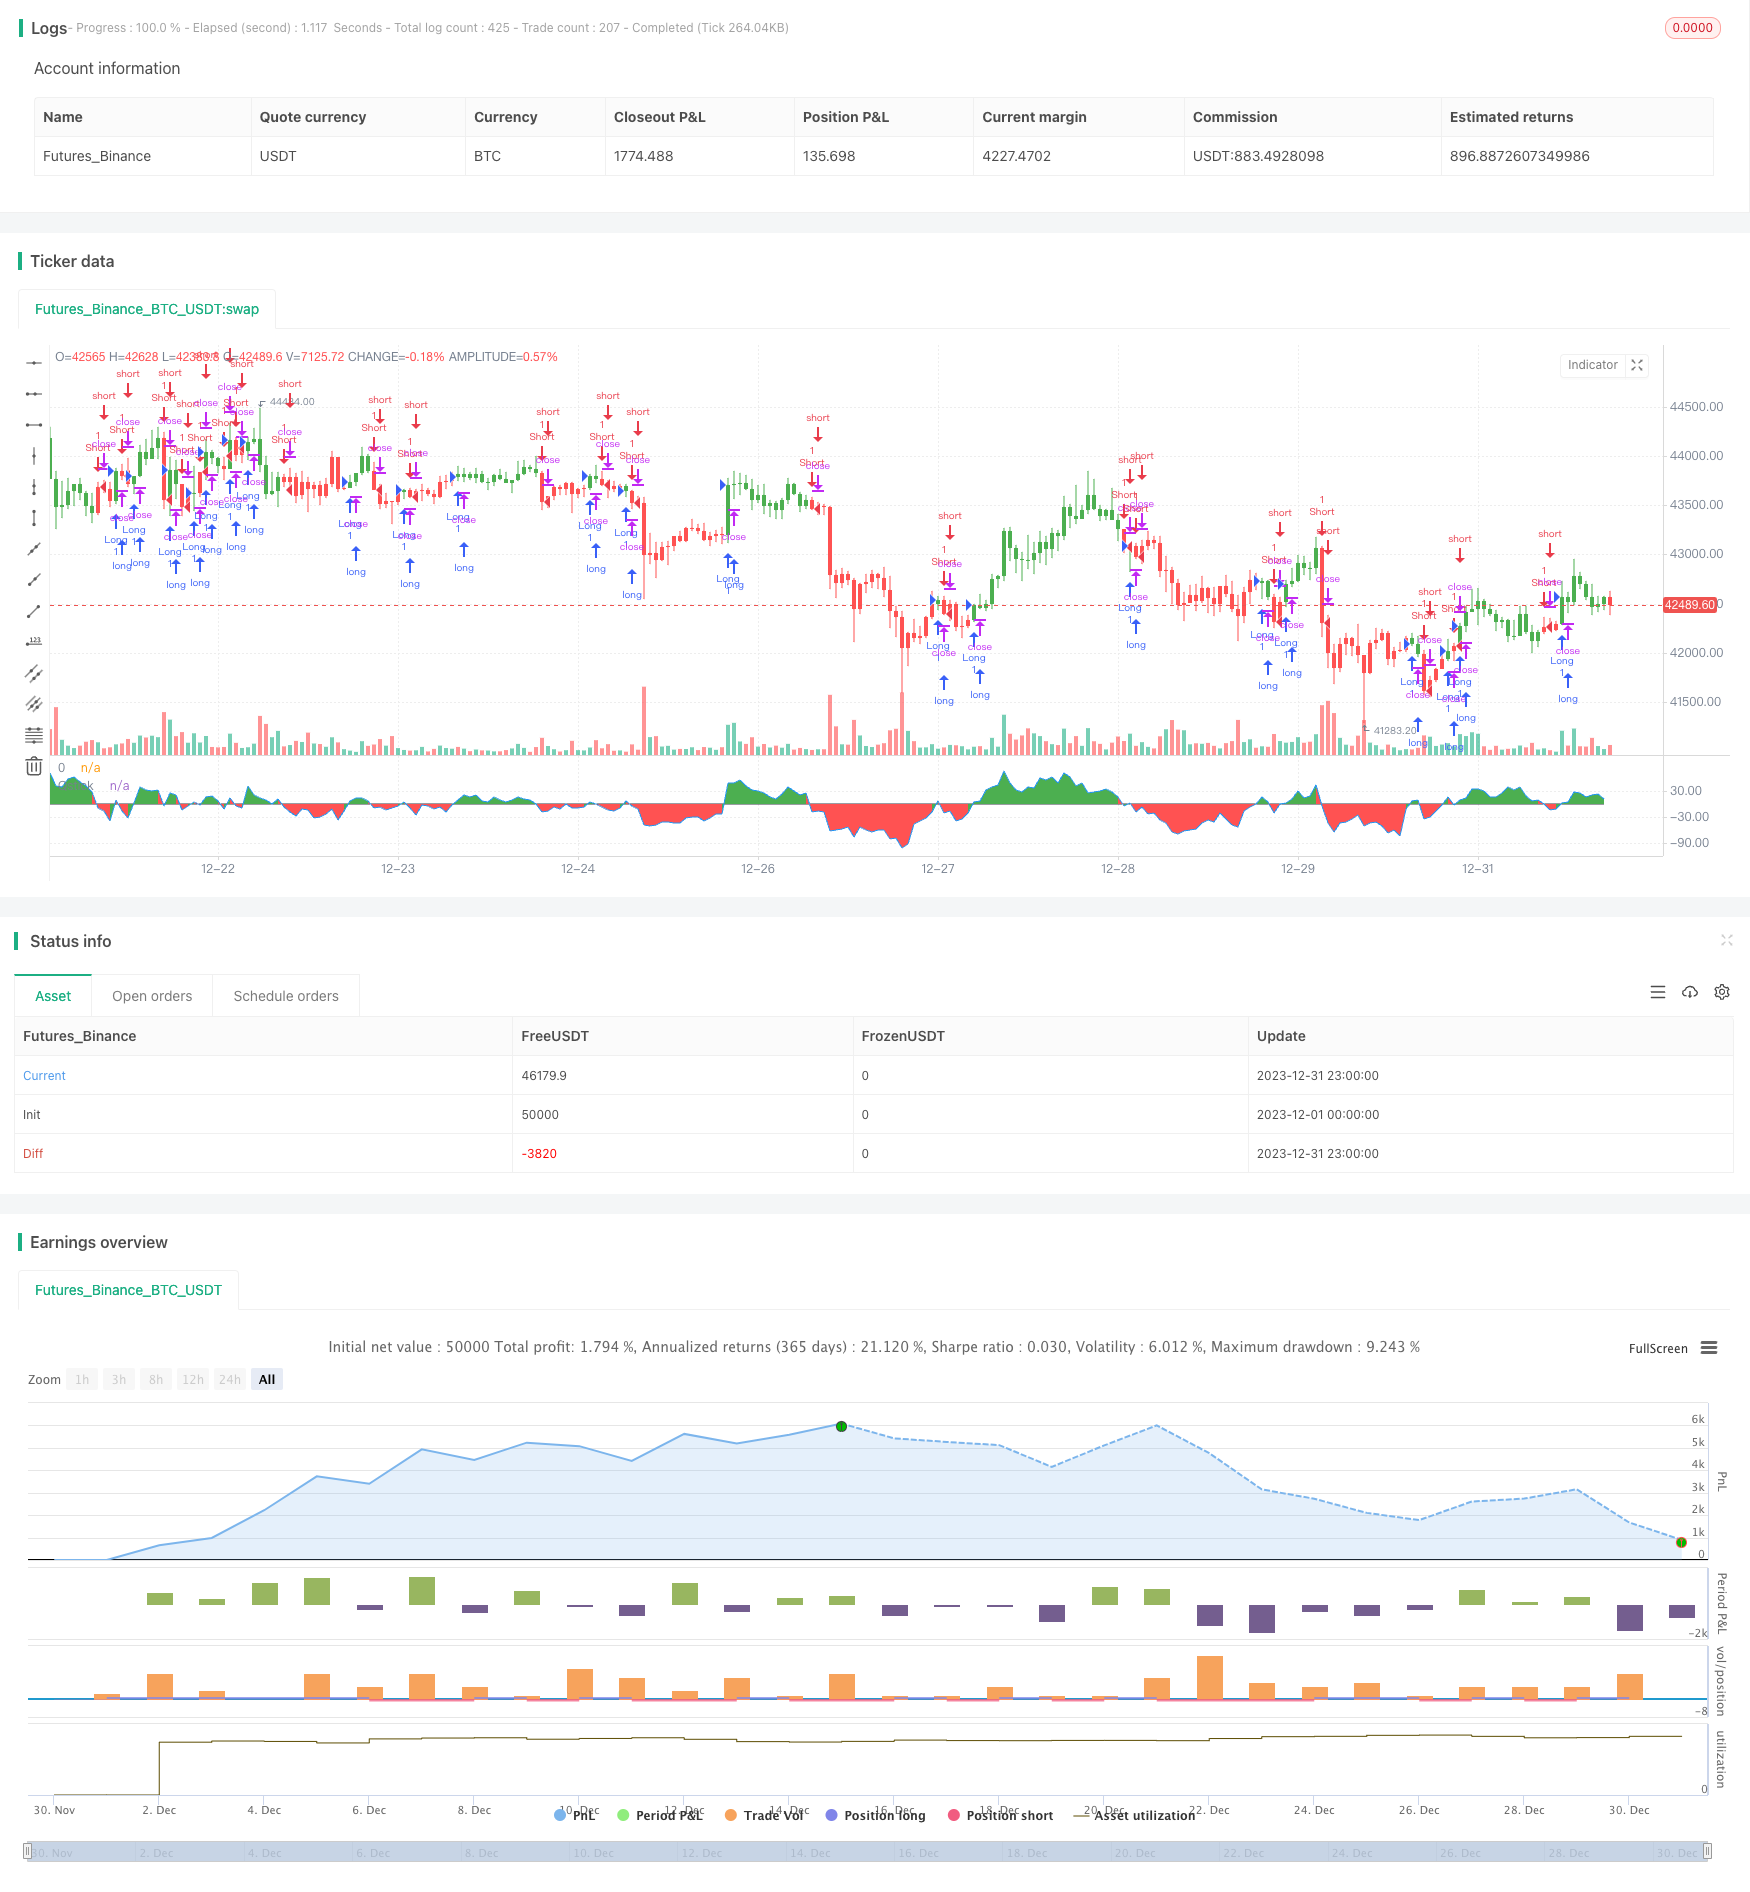
/*backtest
start: 2023-12-01 00:00:00
end: 2023-12-31 23:59:59
period: 1h
basePeriod: 15m
exchanges: [{"eid":"Futures_Binance","currency":"BTC_USDT"}]
*/

//@version=2
////////////////////////////////////////////////////////////
//  Copyright by HPotter v1.0 16/04/2018
// A technical indicator developed by Tushar Chande to numerically identify
// trends in candlestick charting. It is calculated by taking an 'n' period
// moving average of the difference between the open and closing prices. A
// Qstick value greater than zero means that the majority of the last 'n' days
// have been up, indicating that buying pressure has been increasing.
//
// Transaction signals come from when the Qstick indicator crosses through the
// zero line. Crossing above zero is used as the entry signal because it is indicating
// that buying pressure is increasing, while sell signals come from the indicator
// crossing down through zero. In addition, an 'n' period moving average of the Qstick
// values can be drawn to act as a signal line. Transaction signals are then generated
// when the Qstick value crosses through the trigger line.
//
// You can change long to short in the Input Settings
// WARNING:
//  - For purpose educate only
//  - This script to change bars colors.
////////////////////////////////////////////////////////////
strategy(title="Qstick Indicator Backtest")
Length = input(14, minval=1)
reverse = input(false, title="Trade reverse")
xR = close - open
xQstick = sma(xR, Length)
clr = iff(xQstick >= 0, green, red)
pos = iff(xQstick > 0, 1,
       iff(xQstick < 0, -1, nz(pos[1], 0)))
possig = iff(reverse and pos == 1, -1,
          iff(reverse and pos == -1, 1, pos))
if (possig == 1)
    strategy.entry("Long", strategy.long)
if (possig == -1)
    strategy.entry("Short", strategy.short)
barcolor(possig == -1 ? red: possig == 1 ? green : blue )
p1 = plot(0, color=black, title="0")
p2 = plot(xQstick, color=blue, title="Qstick")
fill(p1, p2, color=clr)