SMA移動平均クロスオーバーと市場深度指標に基づく定量的取引戦略
概要
この戦略は,SMA平均線を交差して市場深度指標を1対1で配合した量化取引戦略である.この戦略は,主にSMA平均線の金叉死叉信号を利用し,イチモク市場深度雲図指標の変換線,基准線,前沿線,取引量の多空指標を組み合わせて,ビットコインに対する正反転の自動取引を実現する.
戦略原則
この戦略は以下の原則に基づいています.
異なるパラメータを使用したSMA均線で金叉死叉取引シグナルを構成する.短期SMA上で長期SMAを突破すると買入シグナルが生成され,短期SMA下で長期SMAを突破すると売り出シグナルが生成される.
イチモク雲図指標に基づいて市場の深さとトレンドを判断する. 閉盘価格が雲図の前線と基准線より高い場合にのみ買入シグナルが生じ,雲図の前線と基准線より低い場合にのみ売出シグナルが生じ,偽のシグナルの大半をフィルターする.
取引量に基づく多空指標は,低量の偽信号をフィルターし,取引量が定期間の平均より大きい場合にのみ,買入販売信号を生成する.
plotshape関数で,グラフ上の買出シグナルの位置をマークする。
この戦略は,短期と長期のトレンド,市場深さ指標,取引量指標を総合的に考慮し,取引決定を最適化します.
優位分析
この戦略の利点は以下の通りです.
- SMA平均線の金叉死叉を利用して基本の買入シグナルを生成し,複雑さを避けます.
- イチモク・クラウド・グラフ (Ichimoku Cloud Graph) は,市場の深さと中長期のトレンドを判断し,ノイズを効果的にフィルターします.
- 取引量指数と組み合わせると,偽の破綻が少なくなるのを防ぐことができます.
- パラメータ調整の余地があり,異なる市場向けに最適化することができる.
- 戦略の論理は明確で,理解し,修正しやすい.
- 戦略のテストと最適化に役立つ,直感的な買入・売却のシグナルを表示します.
リスク分析
この戦略には以下のリスクもあります.
- SMA平均線は誤導信号を発生しやすいので,フィルターが必要となる.
- Ichimoku Cloud Graph Indicatorは,市場構造の効果を判断するためのパラメータ設定に依存する.
- 取引量増幅効果は,取引量指標の判断に干渉する可能性があります.
- トレンド市場と振動市場のパラメータ設定は異なります.
- 遅延の問題がある.
これらのリスクに対して,平均線パラメータ,クラウドグラフパラメータ,取引量パラメータなどの調整によって最適化することができ,同時に適切な取引品種を選択してリスクを低減することができる.
最適化の方向
この戦略は以下の方向から最適化できます.
- EMA,VIDYAなどの平均線指標をテストする.
- 異なる Cloud Map パラメータの設定を試してみてください.
- 動力指数に基づいて補助判断を行う.
- 損失防止の仕組みに加入する
- 異なる取引市場と品種に対してパラメータを最適化する.
- 機械学習などの方法で動的最適化パラメータを試す.
要約する
この戦略は,均線交差,市場深度指標,取引量指標を総合的に使用して,より安定し,信頼性の高い量化取引戦略を形成している.この戦略は,パラメータ調整,新しい技術指標の追加などによってさらに最適化され,その反測と実盤の結果は期待に値する.全体的に,この戦略は,初心者にとって良い学習事例を提供する.
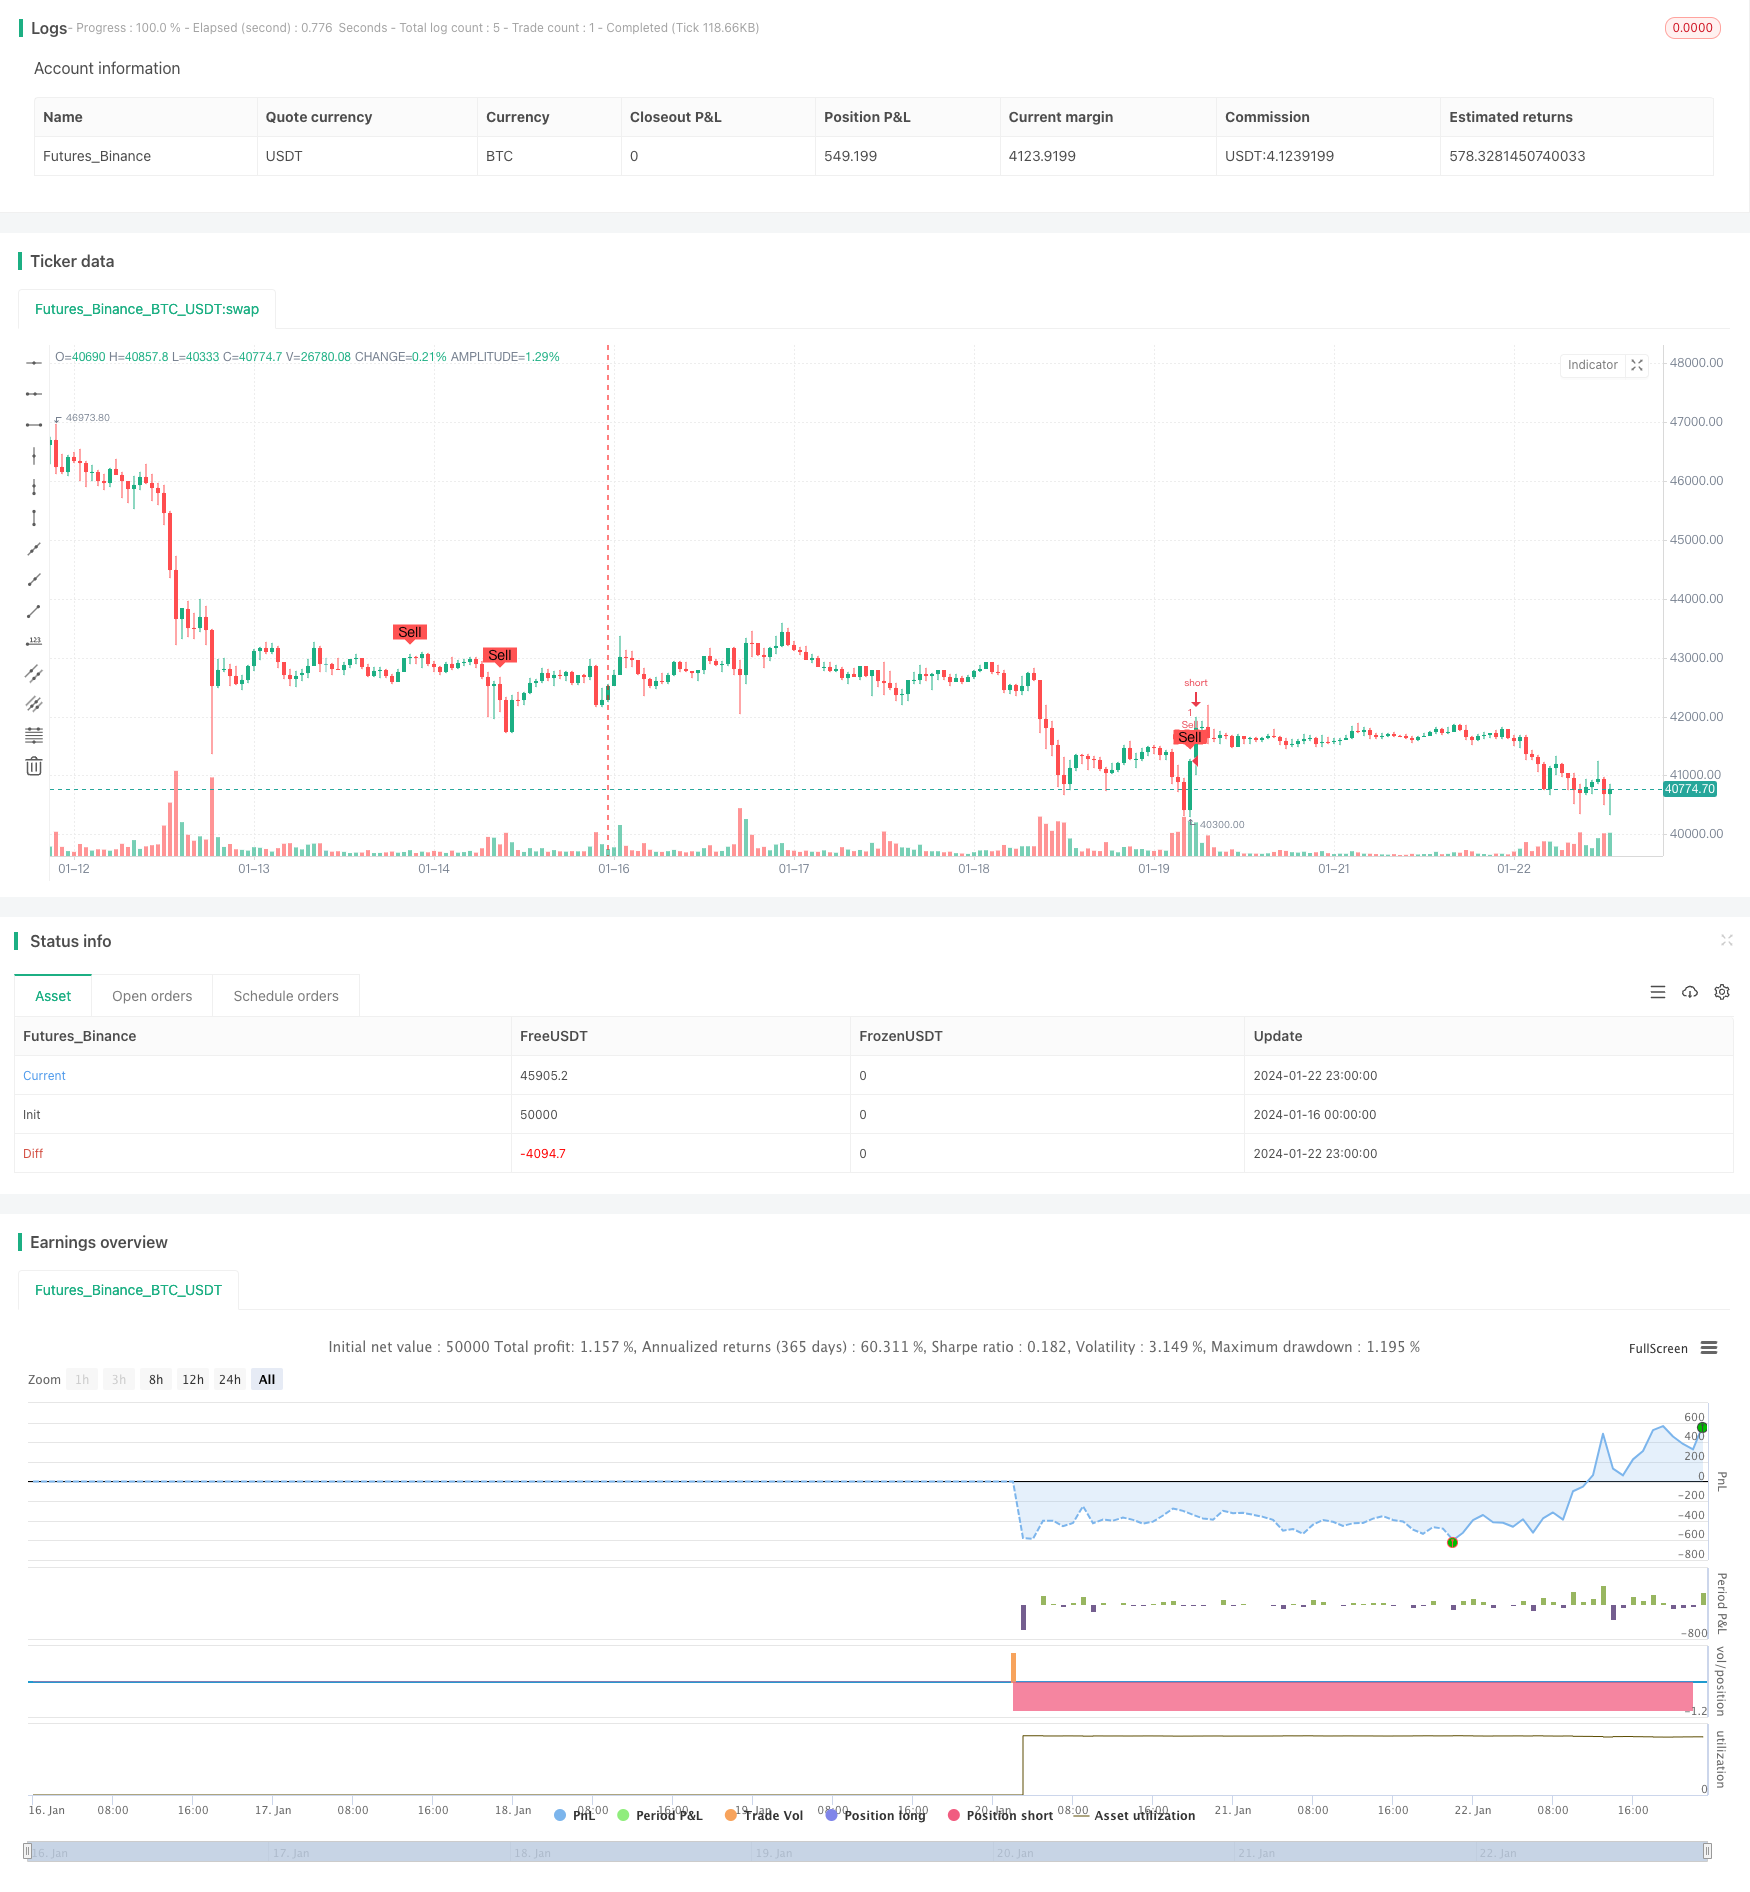
/*backtest
start: 2024-01-16 00:00:00
end: 2024-01-23 00:00:00
period: 1h
basePeriod: 15m
exchanges: [{"eid":"Futures_Binance","currency":"BTC_USDT"}]
*/

//@version=4
strategy("SMA Crossover with Ichimoku & Volume", shorttitle="SCIV", overlay=true)

// Define the length of SMA
shortSmaLength = input(14, title="Short SMA Length")
longSmaLength = input(21, title="Long SMA Length")
volumeLength = input(20, title="Volume Moving Average Length")

// Calculate the SMA and Volume MA
shortSma = sma(close, shortSmaLength)
longSma = sma(close, longSmaLength)
volumeMa = sma(volume, volumeLength)

// Define the lengths of the Ichimoku Cloud components
tenkanLength = input(9, title="Tenkan Length")
kijunLength = input(26, title="Kijun Length")
senkouBLength = input(52, title="Senkou B Length")
displacement = input(26, title="Displacement")

// Calculate the Ichimoku Cloud components
tenkan = (highest(high, tenkanLength) + lowest(low, tenkanLength)) / 2
kijun = (highest(high, kijunLength) + lowest(low, kijunLength)) / 2
senkouA = (tenkan + kijun) / 2
senkouB = (highest(high, senkouBLength) + lowest(low, senkouBLength)) / 2

// Define the conditions for entry and exit with Ichimoku filter and Volume filter
buyEntry = crossover(shortSma, longSma) and close > senkouA[displacement] and close > senkouB[displacement] and volume > volumeMa
sellEntry = crossunder(shortSma, longSma) and close < senkouA[displacement] and close < senkouB[displacement] and volume > volumeMa

// Plot buy/sell conditions on the chart for visual inspection
plotshape(buyEntry, style=shape.labelup, location=location.belowbar, color=color.green, text="Buy", size=size.small)
plotshape(sellEntry, style=shape.labeldown, location=location.abovebar, color=color.red, text="Sell", size=size.small)

// Execute the strategy
if (buyEntry)
    strategy.entry("Buy", strategy.long)
if (sellEntry)
    strategy.entry("Sell", strategy.short)