ダイナミックダブルEMAフリーストップ戦略
概要
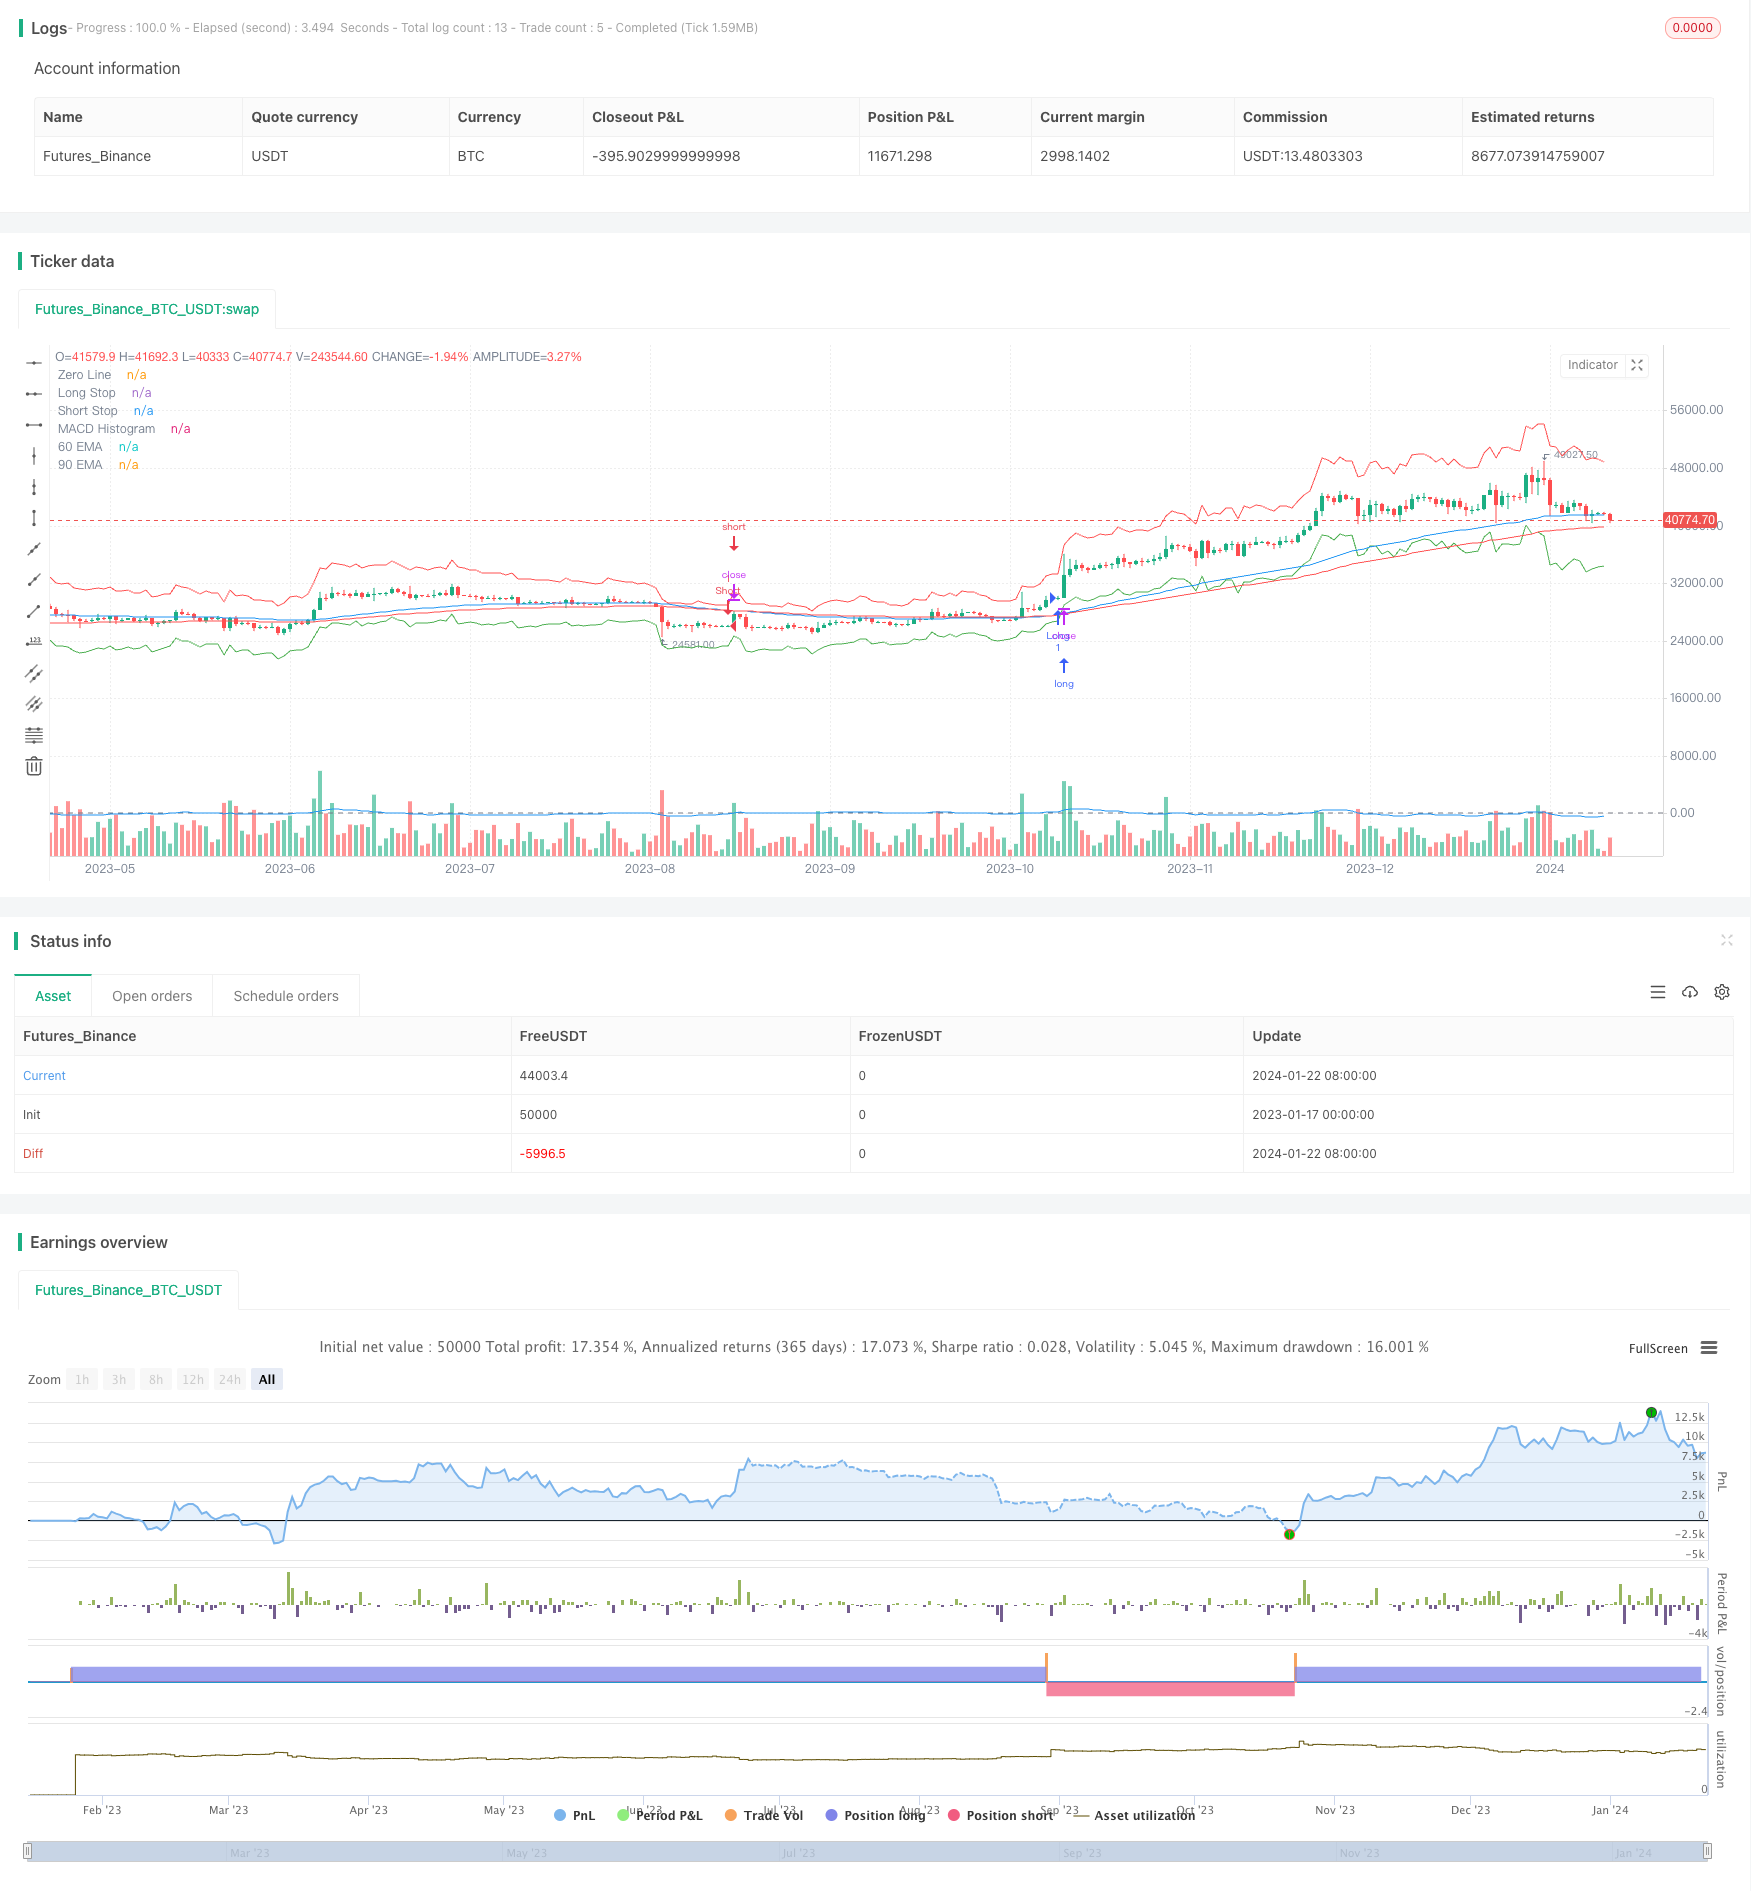
この戦略は,指数移動平均とChande動的集散度平均に基づく実際の範囲の漂流停止を使用して,潜在的なトレンドの逆転または継続を検出することを目的としています. この戦略は,複数の指標を組み合わせて,入場のタイミングを判断し,市場の波動性に基づいてストップとストップのレベルを設定し,新しいトレンドを検出しながらリスクを制御することを目指しています.
戦略原則
この戦略は60周期と90周期の二重EMAを使用してトレンドの方向を判断する.短周期EMAに長周期EMAを穿越すると看板信号である.同時に,MACDの快線に慢線を穿越すると看板も確認できる.入場時に要求される価格は,CDCが以前に計算した脱走停止点より高い.
策略出場ルールは,価格がATRベースのストップポイントに触れたり,CDCを破ってストップポイントから離れたりすると平仓する.
優位分析
この戦略は,双EMAが主動トレンドの方向を判断し,MACDが入場時刻を確認することで,偽の突破を避けます. 移動ストップとストップの位置は,市場の変動性に基づいて計算され,リスクをうまく管理できます. 傾向が逆転するか継続するかは,この戦略は,機会を間に合うように捉えます.
さらに,この戦略の入力パラメータはカスタマイズでき,ユーザーは,戦略を自分の取引方法に適したものにするために,EMAサイクル,ATRサイクル,CDC係数など,必要に応じて調整することができます.
リスク分析
この戦略の最大のリスクは,トレンドを誤判することにある.市場が収束しているときにEMAは誤信号を発しやすい.このとき,MACD指標の確認作用は特に重要である.さらに,突発的な出来事による大幅な飛躍に対応するためにCDCのストップダメージ係数を適切に拡大すべきである.
最適化の方向
- 最適なパラメータの組み合わせを探すためにEMA周期パラメータを調整するテスト
- 異なるCDCの停止因子の大きさをテストする
- 他の指標を組み合わせて タイムラインをフィルターしてみましょう
- 緊急事態に対応するメカニズムの強化
要約する
この戦略は,トレンド判断と波動性指標の優位性を十分に活用し,対象となる証券の潜在的な機会を識別することができます.この戦略は,パラメータの最適化とメカニズムの改善によって,安定性と収益性をさらに高めると期待されています.
/*backtest
start: 2023-01-17 00:00:00
end: 2024-01-23 00:00:00
period: 1d
basePeriod: 1h
exchanges: [{"eid":"Futures_Binance","currency":"BTC_USDT"}]
*/

//@version=5
strategy("Improved EMA & CDC Trailing Stop Strategy", overlay=true)

// Define the inputs
ema60Period = input(60, title="EMA 60 Period")
ema90Period = input(90, title="EMA 90 Period")
atrPeriod = input(24, title="CDC ATR Period")
multiplier = input(4.0, title="CDC Multiplier")
profitTargetMultiplier = input(2.0, title="Profit Target Multiplier (ATR)")

// Calculate EMAs
ema60 = ta.ema(close, ema60Period)
ema90 = ta.ema(close, ema90Period)

// Calculate ATR
atr = ta.atr(atrPeriod)

// MACD calculation
[macdLine, signalLine, _] = ta.macd(close, 12, 26, 9)

// Define the trailing stop and profit target
longStop = close - multiplier * atr
shortStop = close + multiplier * atr
longProfitTarget = close + profitTargetMultiplier * atr
shortProfitTarget = close - profitTargetMultiplier * atr

// Entry conditions
longCondition = close > ema60 and ema60 > ema90 and macdLine > signalLine and close > longStop
shortCondition = close < ema60 and ema60 < ema90 and macdLine < signalLine and close < shortStop

// Exit conditions based on profit target
longProfitCondition = close >= longProfitTarget
shortProfitCondition = close <= shortProfitTarget

// Plot the EMAs, Stops, and MACD for visualization
plot(ema60, color=color.blue, title="60 EMA")
plot(ema90, color=color.red, title="90 EMA")
plot(longStop, color=color.green, title="Long Stop", style=plot.style_linebr)
plot(shortStop, color=color.red, title="Short Stop", style=plot.style_linebr)
hline(0, "Zero Line", color=color.gray)
plot(macdLine - signalLine, color=color.blue, title="MACD Histogram")

// Strategy execution using conditional blocks
if longCondition
    strategy.entry("Long", strategy.long)
if shortCondition
    strategy.entry("Short", strategy.short)

// Exit based on profit target and trailing stop
if longProfitCondition or close < longStop
    strategy.close("Long")
if shortProfitCondition or close > shortStop
    strategy.close("Short")