振動型広域移動平均取引戦略
概要
この戦略は,広範囲の移動平均に基づいており,高速で遅い移動平均の金叉死叉によって取引信号を形成する.広範囲の移動平均は,単純な移動平均から振動移動平均まで,さまざまなタイプをカバーし,パラメータで自由組み合わせを調整することができ,強い適応性を持っています.
戦略原則
この策略は,変数移動平均関数を使用して,12種類の異なる移動平均を生成することができる.基本的には,快線 (Close MA) と慢線 (Open MA) の2つの移動平均を計算し,快線で慢線を横切るときに買い信号を生成し,快線の下で慢線を横切るときに売り信号を生成する.同時に,止損ストップパラメータを設定し,自動止損ストップを実現することができる.
鍵となる論理は,変数関数を使って2つの移動平均を生成することである.closeSeries = variant(basisType, close, basisLen, offsetSigma, offsetALMA)そしてopenSeries = variant(basisType, open, basisLen, offsetSigma, offsetALMA)〔variant関数〕は,12種類の異なる平均計算方法を包み込み,basisTypeパラメータによって自由に選択することができる。このようにして,広スペクトル移動平均の組み合わせを実現する。
基本の取引シグナル生成ロジックは以下の通りです.longCond = xlong そして shortCond = xshort速線を走れば,速線を走れば,空っぽになる.
戦略入場ルールは,longCondまたはshortCond条件が満たされたときに分別多空を行う.止損ストップルルールは,価格が移動してデフォルトの止損ストップポイントに達したときに止損またはストップを行う.
優位分析
この戦略の最大の利点は,さまざまな種類の移動平均を自由に組み合わせることができるという点にある.異なる市場には異なる周期があり,どの移動平均が最も適しているかは不確実である.この戦略は,強力なカスタマイズ能力を提供している.ユーザーは,繰り返しテストすることによって,最適なパラメータの組み合わせを決定し,特定の市場に対して最適なプログラムを策定することができる.
戦略の論理はシンプルで明快であるが,強力な機能を提供している. ユーザは簡単に理解し,使用することができます. また,豊富な入力パラメータは,高度なユーザに十分な最適化スペースを提供します.
リスク分析
この戦略の最大のリスクは,広域移動平均自体が一定の遅れがあることである.異常な価格突破が発生した場合,大きな損失を引き起こす可能性がある.また,パラメータが正しく選ばれなかった場合,取引頻度が過剰に増加したり,余分なシグナルを生成したりする可能性がある.
リスクを軽減するために,他の指標と組み合わせて信号の有効性を判断し,偽ブレークを避けるのが推奨されます. さらに,パラメータの最適化と反測も非常に必要であり,最適なパラメータの組み合わせを見つけるために繰り返しテストする必要があります.
最適化の方向
この戦略は,以下のいくつかの主要な最適化方向を掲げています.
- より多くの種類の移動平均の組み合わせをテストし,最適な組み合わせを探します.
- フィルターを追加し,偽信号を回避します.例えば,取引量指数との組み合わせなど.
- 移動平均の長さのパラメータを最適化し,最適なパラメータを探します.
- ポジションの規模とストップ・ストップのパラメータを最適化
- 異なる品種や周期を試す
戦略の実績を継続的に向上させるには,上記のいくつかの方向を最適化する必要があります.
要約する
この取引戦略は,広スペクトル移動平均に基づいて高度な柔軟性を実現している. それは,強力なカスタマイズ機能を提供し,ユーザーは自由に選択し,異なるタイプの平均を組み合わせることができる. 戦略の論理は,シンプルで明確で,使いやすいが,同時に,豊富な最適化スペースも提供している. 参数最適化とリスク制御により,この戦略は,異なる市場環境に適応し,安定した収益を得ることができる. それは,高効率で柔軟なトレンド追跡戦略である.
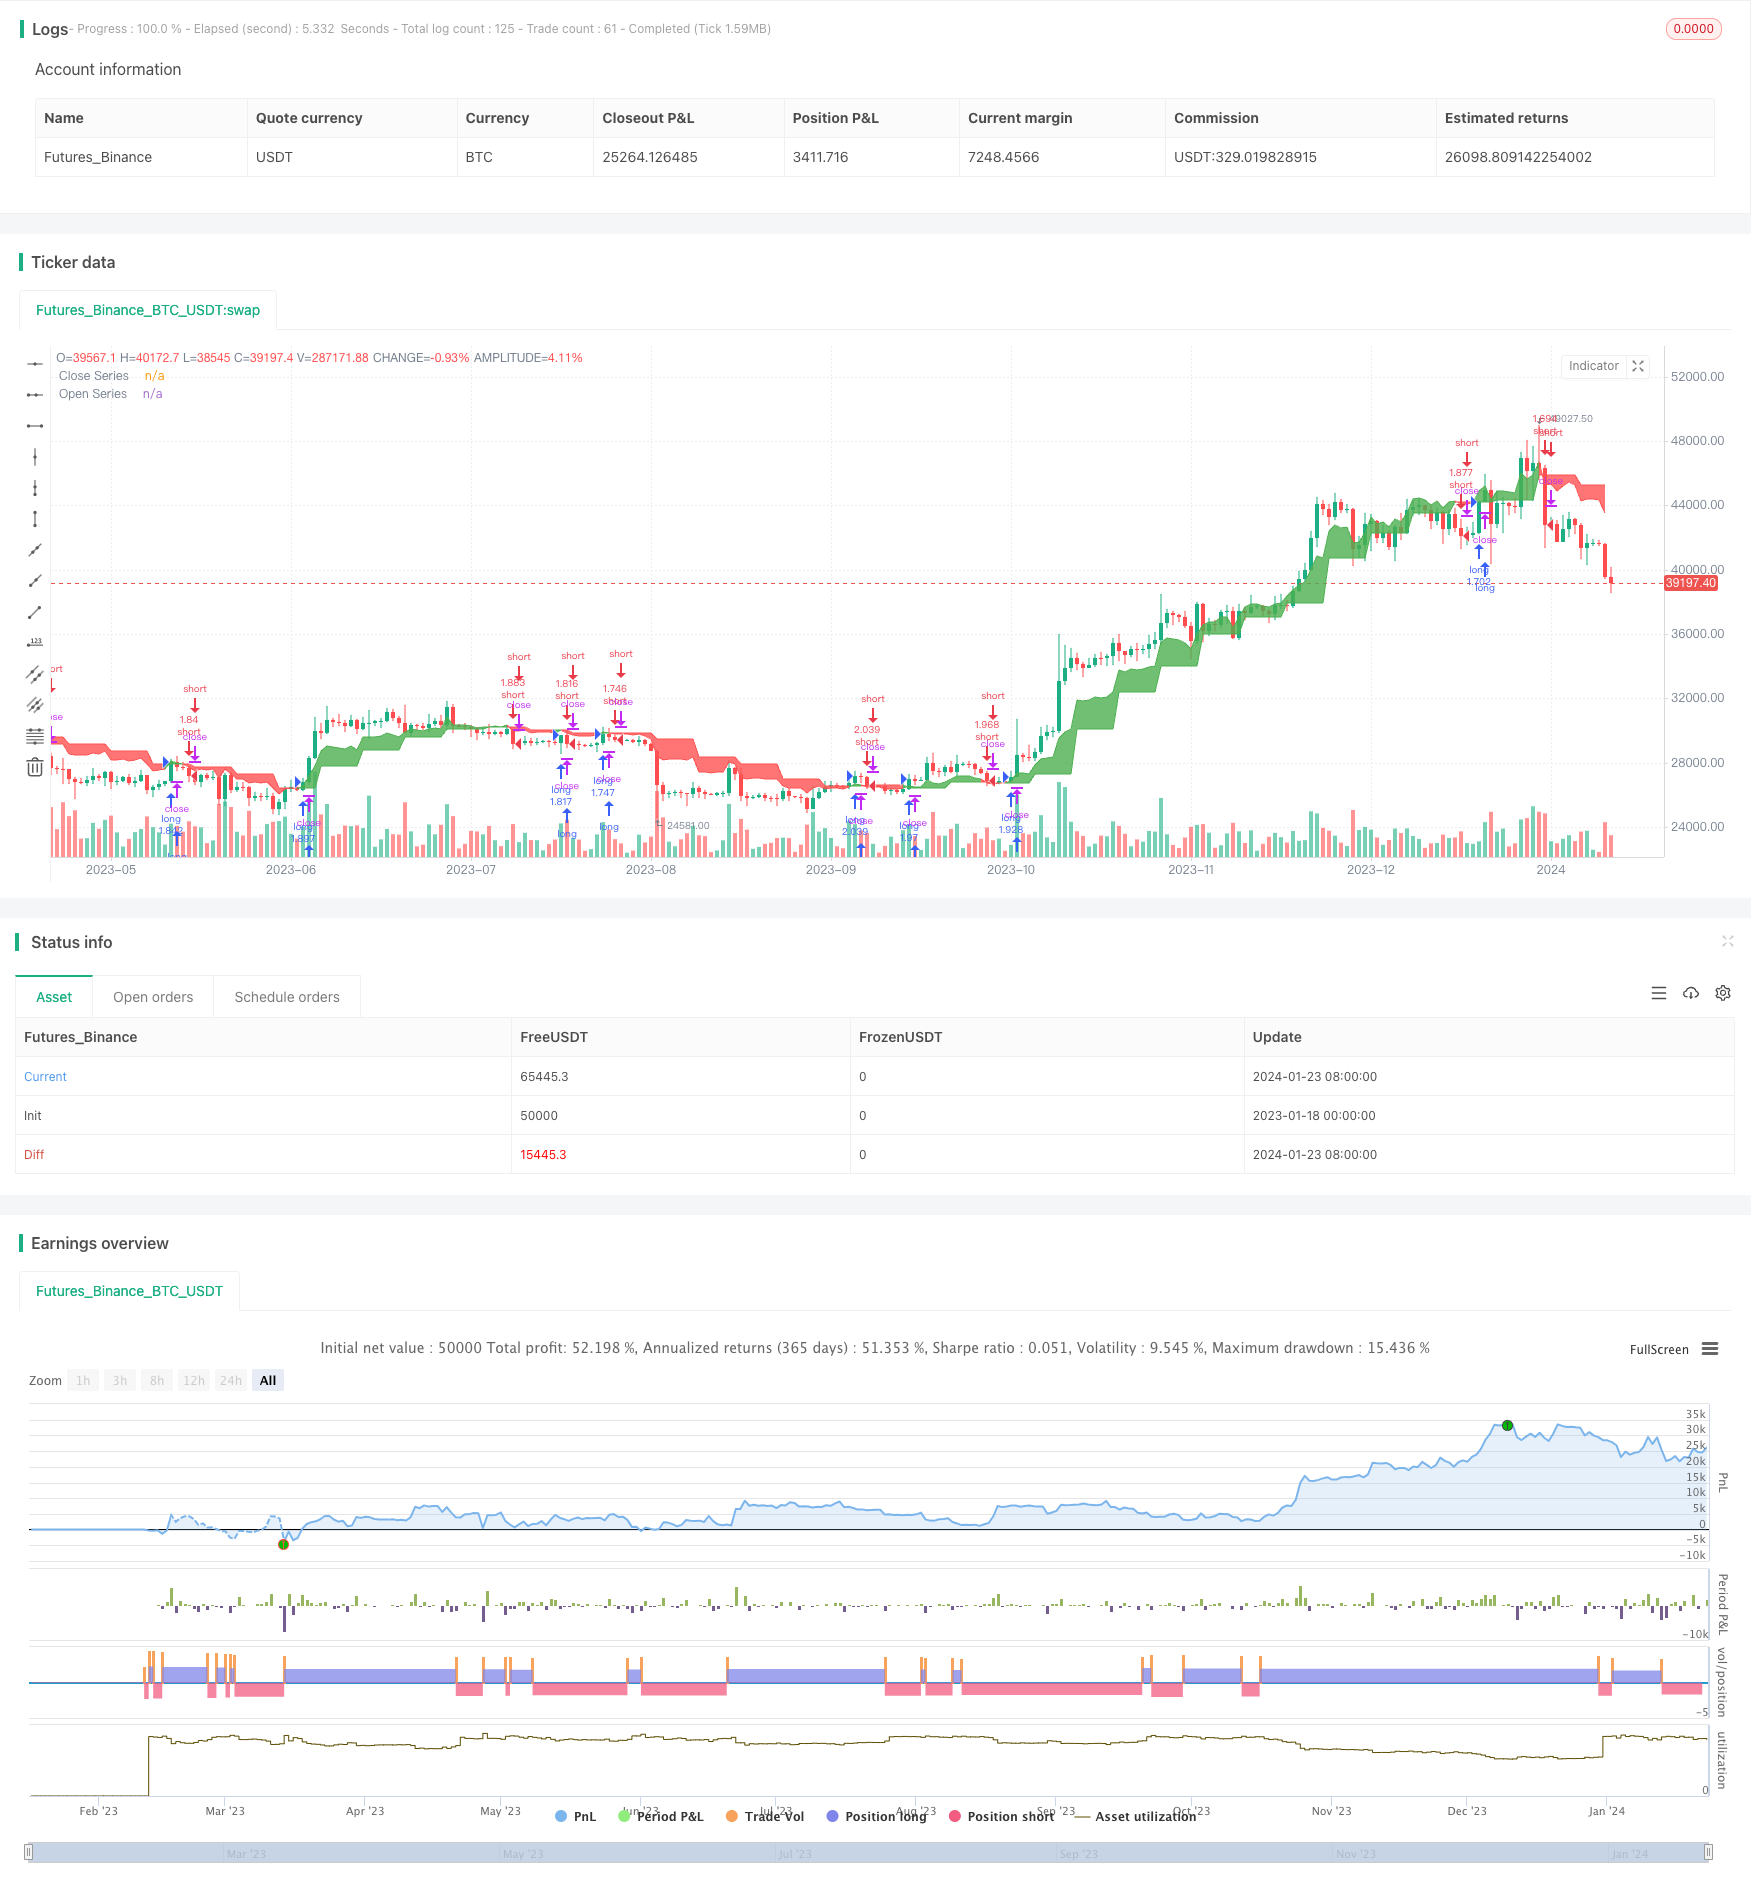
/*backtest
start: 2023-01-18 00:00:00
end: 2024-01-24 00:00:00
period: 1d
basePeriod: 1h
exchanges: [{"eid":"Futures_Binance","currency":"BTC_USDT"}]
*/

//@version=4
//

strategy(title="Long/Short", shorttitle="Banana Maker", overlay=true, pyramiding=0, default_qty_type=strategy.percent_of_equity, default_qty_value=100, calc_on_every_tick=false)


// === INPUTS ===
useRes = input(defval=true, title="Use Alternate Resolution?")
intRes = input(defval=7, title="Multiplier for Alernate Resolution")
stratRes = timeframe.ismonthly ? tostring(timeframe.multiplier * intRes, "###M") :
   timeframe.isweekly ? tostring(timeframe.multiplier * intRes, "###W") :
   timeframe.isdaily ? tostring(timeframe.multiplier * intRes, "###D") :
   timeframe.isintraday ? tostring(timeframe.multiplier * intRes, "####") : '60'
basisType = input(defval="DEMA", title="MA Type: ", options=["SMA", "EMA", "DEMA", "TEMA", "WMA", "VWMA", "SMMA", "HullMA", "LSMA", "ALMA", "SSMA", "TMA"])
basisLen = input(defval=8, title="MA Period", minval=1)
offsetSigma = input(defval=6, title="Offset for LSMA / Sigma for ALMA", minval=0)
offsetALMA = input(defval=0.85, title="Offset for ALMA", minval=0, step=0.01)
scolor = input(false, title="Show coloured Bars to indicate Trend?")
delayOffset = input(defval=0, title="Delay Open/Close MA (Forces Non-Repainting)", minval=0, step=1)
tradeType = input("BOTH", title="What trades should be taken : ", options=["LONG", "SHORT", "BOTH", "NONE"])
// === /INPUTS ===

// Constants colours that include fully non-transparent option.
green100 = #008000FF
lime100 = #6ad279
red100 = #FF0000FF
blue100 = #0000FFFF
aqua100 = #00FFFFFF
darkred100 = #8B0000FF
gray100 = #808080FF

// === BASE FUNCTIONS ===
variant(type, src, len, offSig, offALMA) =>
    v1 = sma(src, len)  // Simple
    v2 = ema(src, len)  // Exponential
    v3 = 2 * v2 - ema(v2, len)  // Double Exponential
    v4 = 3 * (v2 - ema(v2, len)) + ema(ema(v2, len), len)  // Triple Exponential
    v5 = wma(src, len)  // Weighted
    v6 = vwma(src, len)  // Volume Weighted
    v7 = 0.0
    sma_1 = sma(src, len)  // Smoothed
    v7 := na(v7[1]) ? sma_1 : (v7[1] * (len - 1) + src) / len
    v8 = wma(2 * wma(src, len / 2) - wma(src, len), round(sqrt(len)))  // Hull
    v9 = linreg(src, len, offSig)  // Least Squares
    v10 = alma(src, len, offALMA, offSig)  // Arnaud Legoux
    v11 = sma(v1, len)  // Triangular (extreme smooth)
    // SuperSmoother filter
    // © 2013  John F. Ehlers
    a1 = exp(-1.414 * 3.14159 / len)
    b1 = 2 * a1 * cos(1.414 * 3.14159 / len)
    c2 = b1
    c3 = -a1 * a1
    c1 = 1 - c2 - c3
    v12 = 0.0
    v12 := c1 * (src + nz(src[1])) / 2 + c2 * nz(v12[1]) + c3 * nz(v12[2])
    type == "EMA" ? v2 : type == "DEMA" ? v3 :
       type == "TEMA" ? v4 : type == "WMA" ? v5 : type == "VWMA" ? v6 :
       type == "SMMA" ? v7 : type == "HullMA" ? v8 : type == "LSMA" ? v9 :
       type == "ALMA" ? v10 : type == "TMA" ? v11 : type == "SSMA" ? v12 : v1

// security wrapper for repeat calls* NEEDS REFINEMENT- backtesting this shows repaint. need new wrapper
reso(exp, use, res) =>
    security_1 = security(syminfo.tickerid, res, exp, gaps=barmerge.gaps_off, lookahead=barmerge.lookahead_on)
    use ? security_1 : exp


// === /BASE FUNCTIONS ===

// === SERIES SETUP ===
closeSeries = variant(basisType, close[delayOffset], basisLen, offsetSigma, offsetALMA)
openSeries = variant(basisType, open[delayOffset], basisLen, offsetSigma, offsetALMA)
// === /SERIES ===

// === PLOTTING ===

// alt resulution
closeSeriesAlt = reso(closeSeries, useRes, stratRes)
openSeriesAlt = reso(openSeries, useRes, stratRes)
//
trendColour = closeSeriesAlt > openSeriesAlt ? color.green : color.red
bcolour = closeSeries > openSeriesAlt ? lime100 : red100
barcolor(scolor ? bcolour : na, title="Bar Colours")
closeP = plot(closeSeriesAlt, title="Close Series", color=trendColour, linewidth=0, style=plot.style_line, transp=1)
openP = plot(openSeriesAlt, title="Open Series", color=trendColour, linewidth=0, style=plot.style_line, transp=1)
fill(closeP, openP, color=trendColour, transp=80)

// === /PLOTTING ===
//

//
// === ALERT conditions

xlong = crossover(closeSeriesAlt, openSeriesAlt)
xshort = crossunder(closeSeriesAlt, openSeriesAlt)
longCond = xlong  // alternative: longCond[1]? false : (xlong or xlong[1]) and close>closeSeriesAlt and close>=open
shortCond = xshort  // alternative: shortCond[1]? false : (xshort or xshort[1]) and close<closeSeriesAlt and close<=open


// === /ALERT conditions. needs work in study mode. the banana maker is the study script.
// Create alert for cross, shunt back 1 if source is not 'open', this should prevent repaint issue.
//shunt = RSIsrc == open ? 0 : 1
//shunt = 0
//c_alert = (buy[shunt]==1 or sell[shunt]==1)
//alertcondition(c_alert, title="QQECROSS Alert", message="QQECROSS Alert")
// show only when alert condition is met and bar closed.
//plotshape(c_alert,title= "Alert Indicator Closed", location=location.bottom, color=sell[shunt]==1?red:green, transp=0, style=shape.circle)

//Repaint city, study mode will help but wont trigger the alerts


// === STRATEGY ===
// stop loss
slPoints = input(defval=0, title="Initial Stop Loss Points (zero to disable)", minval=0)
tpPoints = input(defval=0, title="Initial Target Profit Points (zero for disable)", minval=0)
// Include bar limiting algorithm
ebar = input(defval=1000, title="Number of Bars for Back Testing", minval=0)
dummy = input(false, title="- SET to ZERO for Daily or Longer Timeframes")
//
// Calculate how many mars since last bar
tdays = (timenow - time) / 60000.0  // number of minutes since last bar
tdays := timeframe.ismonthly ? tdays / 1440.0 / 5.0 / 4.3 / timeframe.multiplier :
   timeframe.isweekly ? tdays / 1440.0 / 5.0 / timeframe.multiplier :
   timeframe.isdaily ? tdays / 1440.0 / timeframe.multiplier :
   tdays / timeframe.multiplier  // number of bars since last bar
//
//set up exit parameters
TP = tpPoints > 0 ? tpPoints : na
SL = slPoints > 0 ? slPoints : na

// Make sure we are within the bar range, Set up entries and exit conditions
if (ebar == 0 or tdays <= ebar) and tradeType != "NONE"
    strategy.entry("long", strategy.long, when=longCond == true and tradeType != "SHORT")
    strategy.entry("short", strategy.short, when=shortCond == true and tradeType != "LONG")
    strategy.close("long", when=shortCond == true and tradeType == "LONG")
    strategy.close("short", when=longCond == true and tradeType == "SHORT")
    strategy.exit("XL", from_entry="long", profit=TP, loss=SL)
    strategy.exit("XS", from_entry="short", profit=TP, loss=SL)


// === /STRATEGY ===
// eof